Changing Label Size in Matplotlib
Matplotlib is a popular Python library for creating visualizations such as plots, charts, and graphs. One common customization that users often want to make is adjusting the size of labels on their plots. In this article, we will explore different ways to change the label size in Matplotlib.
Changing the Font Size of Labels
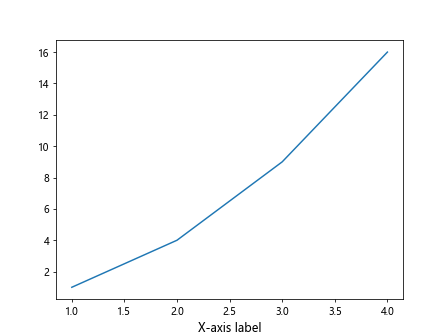
One way to change the label size in Matplotlib is by setting the font size of the labels using the fontsize parameter. This parameter allows you to specify the size of the font in points. Here is an example of how to change the font size of labels on an x-axis:
import matplotlib.pyplot as plt

plt.plot([1, 2, 3, 4], [1, 4, 9, 16])
plt.xlabel('X-axis label', fontsize=12)  # Set the font size of the x-axis label to 12
plt.show()
Output:
Changing the Font Size of Tick Labels
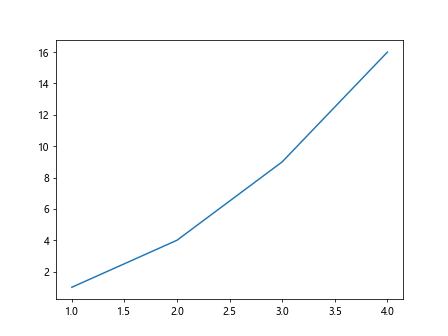
Another common task is changing the font size of tick labels on the axes. This can be done by setting the fontsize parameter for the xticks and yticks methods. Here is an example of how to change the font size of tick labels on the x-axis:
import matplotlib.pyplot as plt

plt.plot([1, 2, 3, 4], [1, 4, 9, 16])
plt.xticks(fontsize=10)  # Set the font size of the x-axis tick labels to 10
plt.show()
Output:
Changing the Font Size of Legends
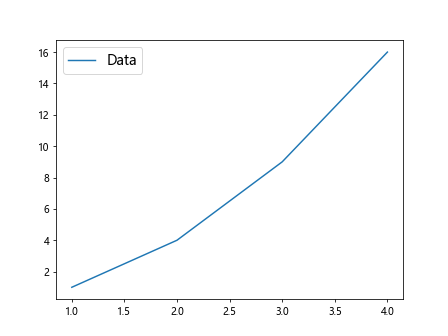
Legends are another important part of plots, and you may want to adjust the font size of the legend labels. This can be done by setting the fontsize parameter for the legend method. Here is an example of how to change the font size of legend labels:
import matplotlib.pyplot as plt

plt.plot([1, 2, 3, 4], [1, 4, 9, 16], label='Data')
plt.legend(fontsize=14)  # Set the font size of the legend labels to 14
plt.show()
Output:
Changing the Font Size of Titles
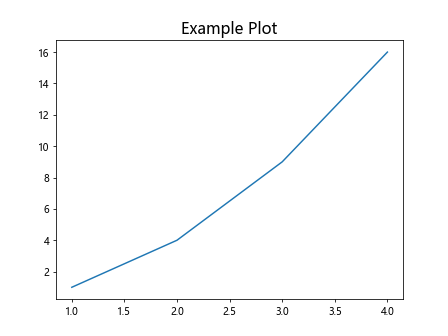
Titles are often used to provide context to a plot, and you may want to adjust the font size of the title. This can be done by setting the fontsize parameter for the title method. Here is an example of how to change the font size of the title:
import matplotlib.pyplot as plt

plt.plot([1, 2, 3, 4], [1, 4, 9, 16])
plt.title('Example Plot', fontsize=16)  # Set the font size of the title to 16
plt.show()
Output:
Setting a Custom Font Size for Labels
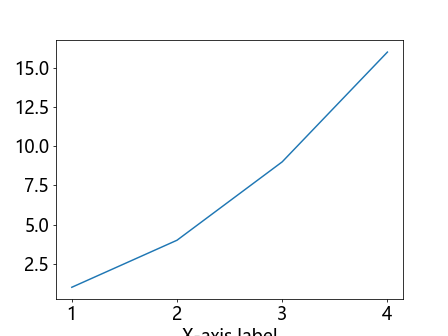
If you want to set a custom font size for labels that is different from the default font size, you can use the rcParams dictionary to modify the default settings. Here is an example of how to set a custom font size for labels:
import matplotlib.pyplot as plt
import matplotlib

matplotlib.rcParams.update({'font.size': 18})  # Set the default font size for labels to 18

plt.plot([1, 2, 3, 4], [1, 4, 9, 16])
plt.xlabel('X-axis label')  # Use the default font size of 18 for the x-axis label
plt.show()
Output:
Changing the Font Size of Annotations
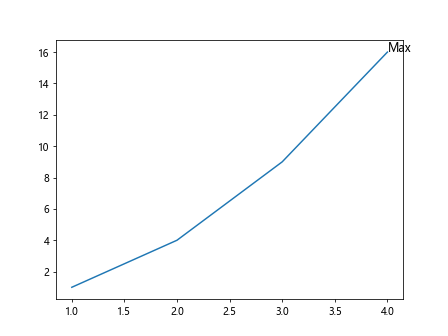
Annotations are often used to highlight specific points on a plot, and you may want to adjust the font size of the annotations. This can be done by setting the fontsize parameter for the annotate method. Here is an example of how to change the font size of annotations:
import matplotlib.pyplot as plt

plt.plot([1, 2, 3, 4], [1, 4, 9, 16])
plt.annotate('Max', (4, 16), fontsize=12)  # Set the font size of the annotation to 12
plt.show()
Output:
Changing the Font Size of Colorbar Labels
Colorbars are used to represent the relationship between the colors in a plot and the data values, and you may want to adjust the font size of the colorbar labels. This can be done by setting the fontsize parameter for the cbar method. Here is an example of how to change the font size of colorbar labels:
import matplotlib.pyplot as plt

plt.imshow([[1, 2, 3], [4, 5, 6]])
plt.colorbar(label='Colorbar', fontsize=14)  # Set the font size of the colorbar labels to 14
plt.show()
Changing the Font Size of Axis Labels on Specific Axes
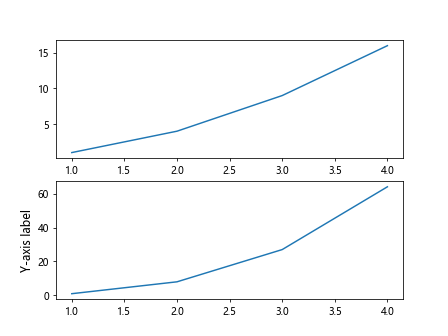
In some cases, you may have multiple axes in a single figure, and you may want to change the font size of the labels on a specific axis. This can be done by getting the specific axis object and setting the font size for the labels. Here is an example of how to change the font size of the labels on the y-axis of a specific subplot:
import matplotlib.pyplot as plt

fig, axs = plt.subplots(2)

axs[0].plot([1, 2, 3, 4], [1, 4, 9, 16])
axs[1].plot([1, 2, 3, 4], [1, 8, 27, 64])

axs[1].set_ylabel('Y-axis label', fontsize=12)  # Set the font size of the y-axis label on the second subplot to 12

plt.show()
Output:
Changing the Font Size of Annotations on Specific Axes
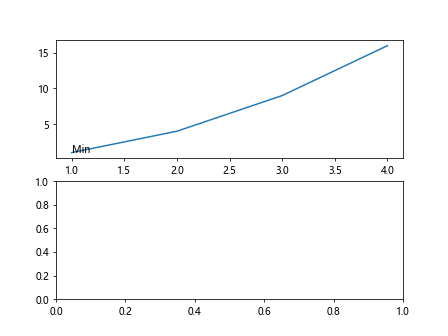
Similarly, you can also change the font size of annotations on a specific axis by getting the axis object and setting the font size for the annotations. Here is an example of how to change the font size of an annotation on a specific axis:
import matplotlib.pyplot as plt

fig, axs = plt.subplots(2)

axs[0].plot([1, 2, 3, 4], [1, 4, 9, 16])
axs[0].annotate('Min', (1, 1), fontsize=10)  # Set the font size of the annotation on the first subplot to 10

plt.show()
Output:
Changing Label Size in Matplotlib Conclusion
In this article, we explored various ways to change the label size in Matplotlib. From adjusting the font size of labels, tick labels, legends, titles, and annotations to setting custom font sizes for labels and colorbar labels, there are several options available to customize the appearance of your plots. By using the examples provided in this article, you can easily change the label size in Matplotlib to suit your visualization needs.