Changing Colorbar Range in Matplotlib
Matplotlib is a popular library for creating static, animated, and interactive visualizations in Python. One common task in data visualization is adjusting the range of colors displayed in a colorbar. In this article, we will explore how to change the colorbar range in Matplotlib.
Example 1: Basic Colorbar Creation
import matplotlib.pyplot as plt
import numpy as np

# Create a dummy heatmap
data = np.random.rand(10, 10)
plt.imshow(data, cmap='viridis')
plt.colorbar()
plt.show()
Output:
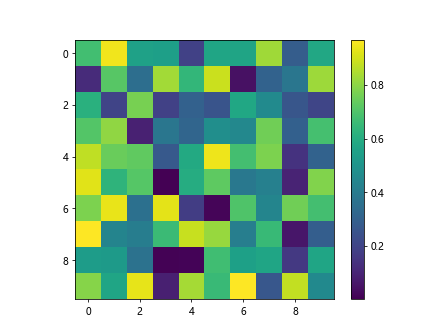
In this example, we create a basic heatmap using random data and display a colorbar using the default settings.
Example 2: Changing Colorbar Limits
import matplotlib.pyplot as plt
import numpy as np

# Create a dummy heatmap
data = np.random.rand(10, 10)
plt.imshow(data, cmap='viridis')
cbar = plt.colorbar()
cbar.set_clim(0, 1)
plt.show()
By using the set_clim method of the colorbar object, we can change the limits of the colorbar to display only a specific range of values.
Example 3: Adjusting Colorbar Range with vmin and vmax
import matplotlib.pyplot as plt
import numpy as np

# Create a dummy heatmap
data = np.random.rand(10, 10)
plt.imshow(data, cmap='viridis', vmin=0.2, vmax=0.8)
plt.colorbar()
plt.show()
Output:
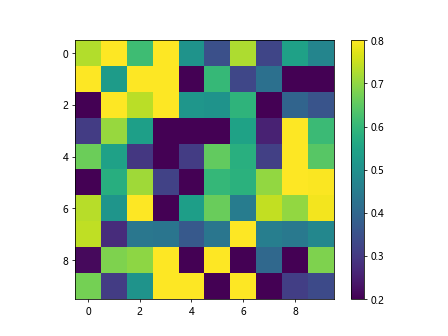
Specifying vmin and vmax arguments in the imshow function allows us to set the minimum and maximum values for the colorbar range.
Example 4: Normalizing Colorbar Range
import matplotlib.pyplot as plt
import numpy as np
from matplotlib.colors import Normalize

# Create a dummy heatmap
data = np.random.rand(10, 10)
norm = Normalize(vmin=0, vmax=1)
plt.imshow(data, cmap='viridis', norm=norm)
plt.colorbar()
plt.show()
Output:
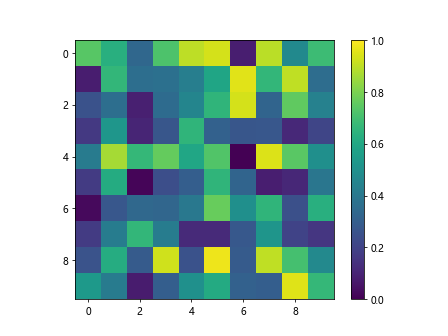
Using the Normalize class from matplotlib.colors, we can normalize the colorbar range to a specific set of values.
Example 5: Logarithmic Colorbar Scale
import matplotlib.pyplot as plt
import numpy as np

# Create a dummy heatmap
data = np.random.rand(10, 10)
plt.imshow(data, cmap='viridis', norm=LogNorm(vmin=0.1, vmax=1))
plt.colorbar()
plt.show()
If you want to use a logarithmic scale for the colorbar, you can utilize LogNorm from matplotlib.colors to set the range in a logarithmic manner.
Example 6: Discretizing Colorbar Range
import matplotlib.pyplot as plt
import numpy as np

# Create a dummy heatmap
data = np.random.rand(10, 10)
levels = np.linspace(0, 1, 6)
plt.imshow(data, cmap='viridis', levels=levels)
plt.colorbar()
plt.show()
By specifying custom levels using np.linspace, we can discretize the colorbar range into specific intervals.
Example 7: Setting Tick Locations on Colorbar
import matplotlib.pyplot as plt
import numpy as np

# Create a dummy heatmap
data = np.random.rand(10, 10)
plt.imshow(data, cmap='viridis')
cbar = plt.colorbar()
cbar.set_ticks([0, 0.25, 0.5, 0.75, 1])
plt.show()
Output:
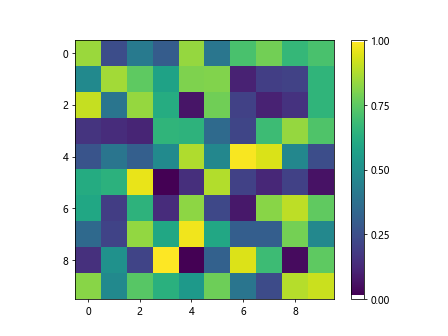
You can set custom tick locations on the colorbar using the set_ticks method of the colorbar object.
Example 8: Formatting Colorbar Ticks
import matplotlib.pyplot as plt
import numpy as np

# Create a dummy heatmap
data = np.random.rand(10, 10)
plt.imshow(data, cmap='viridis')
cbar = plt.colorbar()
cbar.set_ticks([0, 0.5, 1])
cbar.set_ticklabels(['Low', 'Mid', 'High'])
plt.show()
Output:
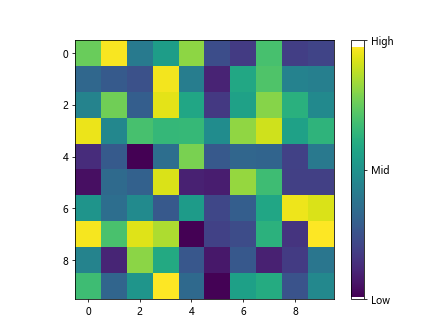
Formatting the colorbar tick labels is possible by providing custom labels using the set_ticklabels method.
Example 9: Reversing Colorbar Range
import matplotlib.pyplot as plt
import numpy as np

# Create a dummy heatmap
data = np.random.rand(10, 10)
plt.imshow(data, cmap='viridis')
cbar = plt.colorbar()
cbar.ax.invert_yaxis()
plt.show()
Output:
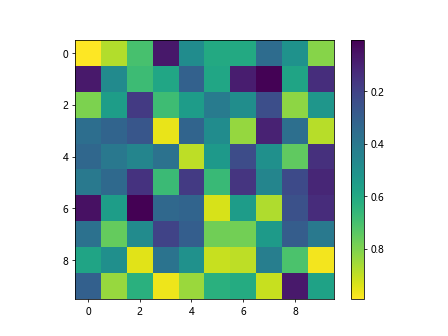
To reverse the colorbar range, you can use the invert_yaxis method of the colorbar axis.
Example 10: Adding Colorbar Title
import matplotlib.pyplot as plt
import numpy as np

# Create a dummy heatmap
data = np.random.rand(10, 10)
plt.imshow(data, cmap='viridis')
cbar = plt.colorbar()
cbar.set_label('Intensity')
plt.show()
Output:
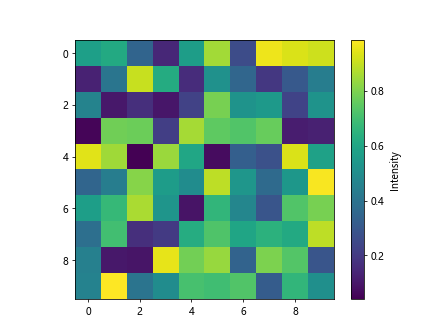
To provide a title to the colorbar, you can use the set_label method of the colorbar object.
Changing Colorbar Range in Matplotlib Conclusion
In this article, we have explored various methods to change the colorbar range in Matplotlib. By using these techniques, you can customize the color scheme of your visualizations to effectively convey your data. Experiment with different settings and find the colorbar range that best suits your visualization needs.