Ax Title Subplot
In Matplotlib, an Axes object can have a title to provide additional information about the plot. You can add a title to each subplot individually when creating multiple subplots with the plt.subplots() function.
Adding Title to Subplot
To add a title to a subplot in Matplotlib, you can use the set_title() method of the Axes object. Here is an example that demonstrates how to add titles to each subplot in a figure:
import matplotlib.pyplot as plt

fig, axs = plt.subplots(2, 2)

axs[0, 0].plot([1, 2, 3, 4], [1, 4, 9, 16])
axs[0, 0].set_title('Subplot 1')
axs[0, 1].plot([1, 2, 3, 4], [1, 2, 3, 4])
axs[0, 1].set_title('Subplot 2')
axs[1, 0].plot([1, 2, 3, 4], [1, 8, 27, 64])
axs[1, 0].set_title('Subplot 3')
axs[1, 1].plot([1, 2, 3, 4], [1, 16, 81, 256])
axs[1, 1].set_title('Subplot 4')

plt.show()
Output:
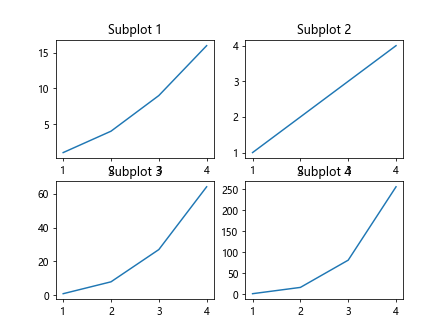
In this example, we create a 2×2 grid of subplots using plt.subplots(2, 2) and then add a title to each subplot using the set_title() method.
Customizing Title Appearance
You can customize the appearance of the title in a subplot by passing additional parameters to the set_title() method. Here is an example that demonstrates how to change the color and font size of the title:
import matplotlib.pyplot as plt

fig, ax = plt.subplots()

ax.plot([1, 2, 3, 4], [1, 4, 9, 16])
ax.set_title('Customized Title', fontsize=16, color='green')

plt.show()
Output:
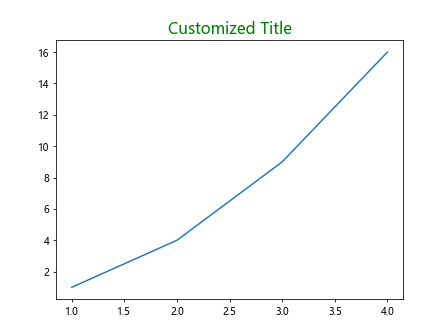
In this example, we create a single subplot and customize the title by setting the font size to 16 and the color to green.
Adding a Title to the Axes
In addition to adding titles to subplots, you can also add a title to the entire figure by using the suptitle() method of the Figure object. Here is an example that demonstrates how to add a title to a figure with multiple subplots:
import matplotlib.pyplot as plt

fig, axs = plt.subplots(2, 2)

fig.suptitle('Figure Title', fontsize=18)

axs[0, 0].plot([1, 2, 3, 4], [1, 4, 9, 16])
axs[0, 1].plot([1, 2, 3, 4], [1, 2, 3, 4])
axs[1, 0].plot([1, 2, 3, 4], [1, 8, 27, 64])
axs[1, 1].plot([1, 2, 3, 4], [1, 16, 81, 256])

plt.show()
Output:
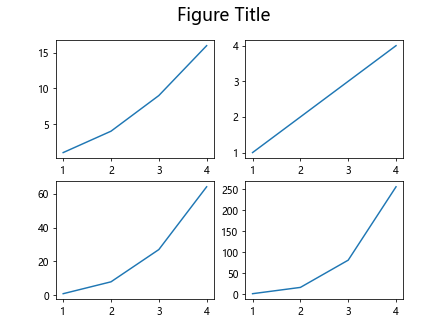
In this example, we create a 2×2 grid of subplots and add a title to the entire figure using the suptitle() method.
Ax Title Subplot Conclusion
In this article, we have discussed how to add titles to subplots and figures in Matplotlib.Titles provide important context to your plots and can help communicate the main message of your data visualizations. By using the set_title() and suptitle() methods, you can easily add and customize titles in your Matplotlib plots. Experiment with different font sizes, colors, and positions to find the style that best suits your needs.