Setting Title in Matplotlib Axes
In Matplotlib, the title() method can be used to set a title to the plot. The title text can be customized with different font sizes, font styles, colors, alignments, etc. In this article, we will explore various ways to set title in Matplotlib axes.
Basic Title Setting
To set a basic title in Matplotlib axes, we can use the set_title() method. Here is an example:
import matplotlib.pyplot as plt

# Create a plot
plt.plot([1, 2, 3, 4], [1, 4, 9, 16])

plt.gca().set_title('Basic Title Example\nhow2matplotlib.com')

plt.show()
Output:
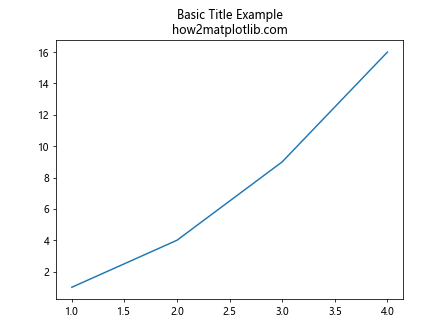
In this example, we are setting a basic title “Basic Title Example” to the plot.
Customizing Title Appearance
We can customize the appearance of the title by specifying parameters such as font size, font style, font weight, etc. Here is an example:
import matplotlib.pyplot as plt

# Create a plot
plt.plot([1, 2, 3, 4], [1, 4, 9, 16])

plt.gca().set_title('Customized Title Example\nhow2matplotlib.com', fontsize=16, fontweight='bold', color='blue')

plt.show()
Output:
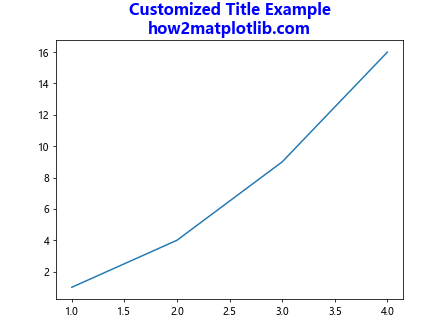
In this example, we are setting a customized title with font size of 16, bold font weight, and blue color.
Title Positioning
We can also specify the position of the title in the plot using the loc parameter. Available position options include 'center', 'left', 'right', etc. Here is an example:
import matplotlib.pyplot as plt

# Create a plot
plt.plot([1, 2, 3, 4], [1, 4, 9, 16])

plt.gca().set_title('Title Position Example\nhow2matplotlib.com', loc='left')

plt.show()
Output:
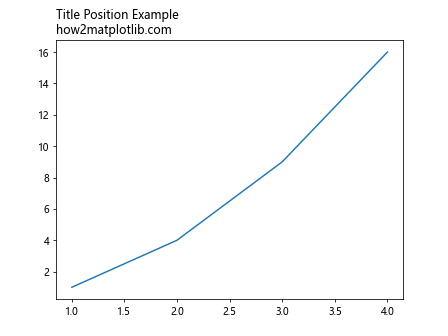
In this example, we are setting the title position to the left side of the plot.
Multi-line Title
To create a multi-line title in Matplotlib axes, we can use the '\n' character to add line breaks. Here is an example:
import matplotlib.pyplot as plt

# Create a plot
plt.plot([1, 2, 3, 4], [1, 4, 9, 16])

plt.gca().set_title('Multi-line\nTitle\nExample\nhow2matplotlib.com')

plt.show()
Output:
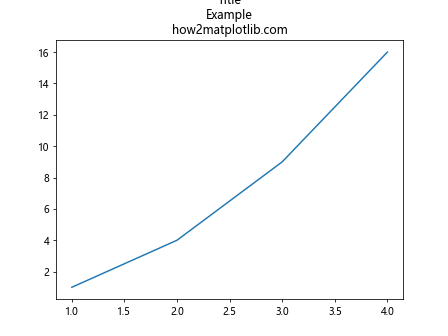
In this example, we are setting a multi-line title with line breaks between each line.
Title with Math Text
Matplotlib also supports rendering math text in titles using LaTeX syntax. Here is an example:
import matplotlib.pyplot as plt

# Create a plot
plt.plot([1, 2, 3, 4], [1, 4, 9, 16])

plt.gca().set_title(r'$\alpha + \beta = \gamma$\nhow2matplotlib.com')

plt.show()
Output:
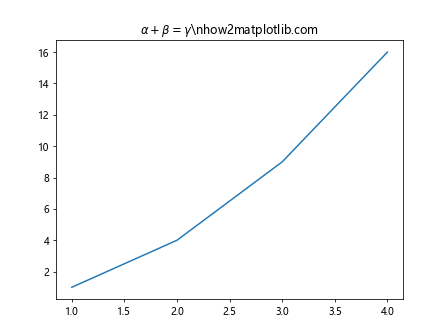
In this example, we are setting a title with math text using LaTeX syntax.
Rotated Title
We can rotate the title text in Matplotlib axes using the rotation parameter. Here is an example:
import matplotlib.pyplot as plt

# Create a plot
plt.plot([1, 2, 3, 4], [1, 4, 9, 16])

plt.gca().set_title('Rotated Title Example\nhow2matplotlib.com', rotation=45)

plt.show()
Output:
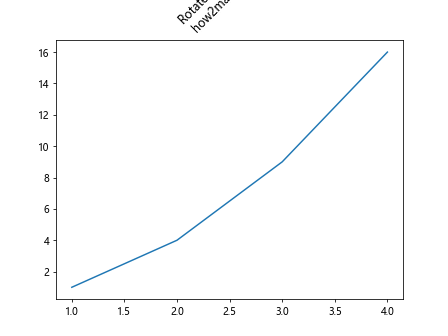
In this example, we are setting a rotated title with a rotation angle of 45 degrees.
Title with Background Color
We can set a background color for the title in Matplotlib axes using the backgroundcolor parameter. Here is an example:
import matplotlib.pyplot as plt

# Create a plot
plt.plot([1, 2, 3, 4], [1, 4, 9, 16])

plt.gca().set_title('Title with Background Color\nhow2matplotlib.com', backgroundcolor='lightgrey')

plt.show()
Output:
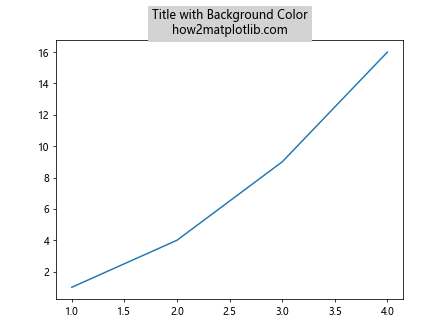
In this example, we are setting a title with a light grey background color.
Title Alignment
We can align the title text in Matplolib axes using the horizontalalignment parameter. Available alignment options include 'left', 'center', 'right'. Here is an example:
import matplotlib.pyplot as plt

# Create a plot
plt.plot([1, 2, 3, 4], [1, 4, 9, 16])

plt.gca().set_title('Title Alignment Example\nhow2matplotlib.com', horizontalalignment='center')

plt.show()
Output:
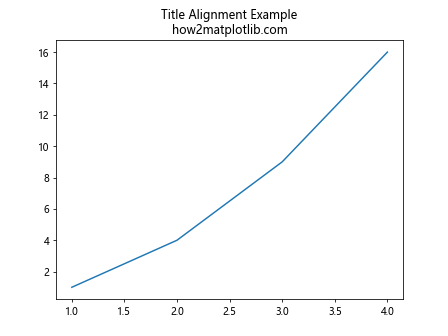
In this example, we are aligning the title text to the center.
Title Font Family
We can specify the font family for the title text in Matplotlib axes using the fontfamily parameter. Here is an example:
import matplotlib.pyplot as plt

# Create a plot
plt.plot([1, 2, 3, 4], [1, 4, 9, 16])

plt.gca().set_title('Title Font Family Example\nhow2matplotlib.com', fontfamily='fantasy')

plt.show()
Output:
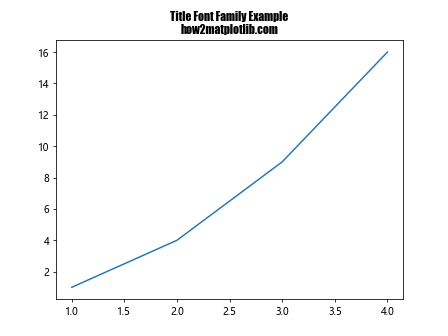
In this example, we are setting the font family to ‘fantasy’ for the title text.
Title with Shadow
To add a shadow effect to the title text in Matplotlib axes, we can use the shadow parameter. Here is an example:
import matplotlib.pyplot as plt

# Create a plot
plt.plot([1, 2, 3, 4], [1, 4, 9, 16])

plt.gca().set_title('Title with Shadow\nhow2matplotlib.com', shadow=True)

plt.show()
In this example, we are adding a shadow effect to the title text.
Title with Border
We can add a border around the title text in Matplotlib axes by using the bbox parameter. Here is an example:
import matplotlib.pyplot as plt

# Create a plot
plt.plot([1, 2, 3, 4], [1, 4, 9, 16])

plt.gca().set_title('Title with Border\nhow2matplotlib.com', bbox=dict(facecolor='white', edgecolor='black', boxstyle='round,pad=1'))

plt.show()
Output:
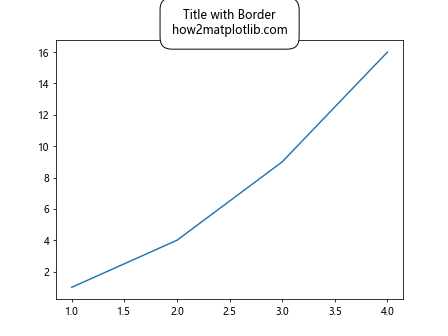
In this example, we are adding a border with a white background color and black edge color to the title text.
Title with Different Font Styles
We can set different font styles for the title text in Matplotlib axes using the fontstyle parameter. Available font style options include 'normal', 'italic', 'oblique'. Here is an example:
import matplotlib.pyplot as plt

# Create a plot
plt.plot([1, 2, 3, 4], [1, 4, 9, 16])

plt.gca().set_title('Title with Different Font Styles\nhow2matplotlib.com', fontstyle='italic')

plt.show()
Output:
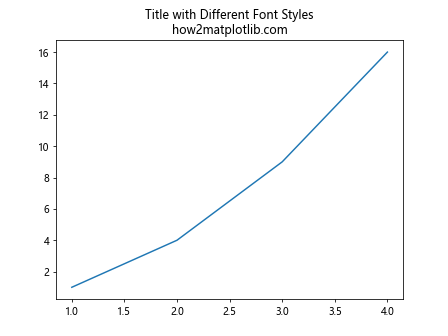
In this example, we are setting the font style to italic for the title text.
Unicode Text in Title
Matplotlib supports rendering Unicode text in titles. Here is an example:
import matplotlib.pyplot as plt

# Create a plot
plt.plot([1, 2, 3, 4], [1, 4, 9, 16])

plt.gca().set_title('Unicode Title Example\nhow2matplotlib.com', fontfamily='DejaVu Sans', fontsize=20)

plt.show()
Output:
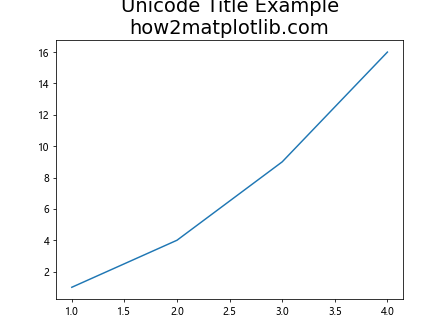
In this example, we are setting a Unicode title with a custom font family and font size.
Title with Vertical Alignment
We can vertically align the title text in Matplotlib axes using the verticalalignment parameter. Available alignment options include 'top', 'center', 'bottom'. Here is an example:
import matplotlib.pyplot as plt

# Create a plot
plt.plot([1, 2, 3, 4], [1, 4, 9, 16])

plt.gca().set_title('Vertical Alignment Example\nhow2matplotlib.com', verticalalignment='bottom')

plt.show()
Output:
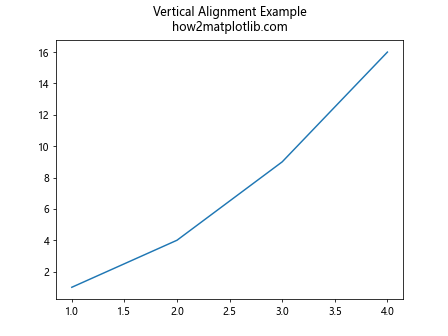
In this example, we are aligning the title text to the bottom.
Title with Subtitle
We can add a subtitle to the title text in Matplotlib axes by using a combination of title and subtitle texts. Here is an example:
import matplotlib.pyplot as plt

# Create a plot
plt.plot([1, 2, 3, 4], [1, 4, 9, 16])

title_text = 'Main Title\nhow2matplotlib.com'
subtitle_text = 'Subtitle Example'

plt.gca().set_title(f'{title_text}\n{subtitle_text}', fontsize=16)

plt.show()
Output:
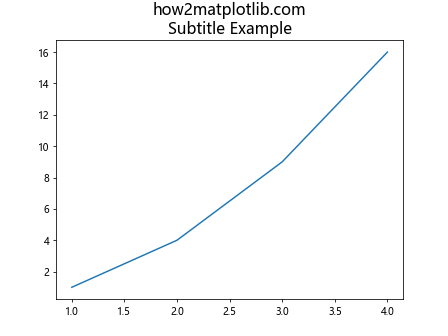
In this example, we are adding a subtitle below the main title text.
Title with Line Styles
We can use different line styles for the title text in Matplotlib axes. Here is an example:
import matplotlib.pyplot as plt

# Create a plot
plt.plot([1, 2, 3, 4], [1, 4, 9, 16])

title_text = 'Title with\nLine Styles\nhow2matplotlib.com'

plt.gca().set_title(title_text, fontsize=16, fontweight='bold', color='red', style='italic')

plt.show()
Output:
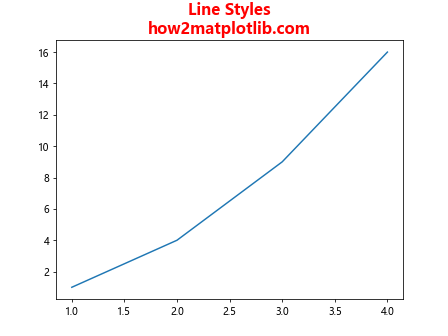
In this example, we are setting the title text with a bold font weight, red color, and italic style.
Title with Prefix and Suffix
We can add a prefix and suffix to the title text in Matplotlib axes. Here is an example:
import matplotlib.pyplot as plt

# Create a plot
plt.plot([1, 2, 3, 4], [1, 4, 9, 16])

title_text = 'Title with Prefix and Suffix\nhow2matplotlib.com'

plt.gca().set_title(f'Prefix: {title_text} Suffix: ', fontsize=16)

plt.show()
Output:
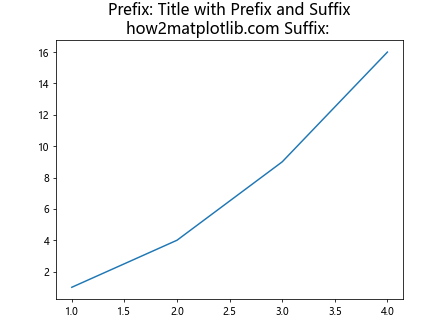
In this example, we are adding a prefix ‘Prefix: ‘ and suffix ‘ Suffix: ‘ to the title text.
Title with Unit
We can include units in the title text in Matplotlib axes. Here is an example:
import matplotlib.pyplot as plt

# Create a plot
plt.plot([1, 2, 3, 4], [1, 2, 3, 4])

plt.gca().set_title('Title with Unit Example (m)\nhow2matplotlib.com')

plt.show()
Output:
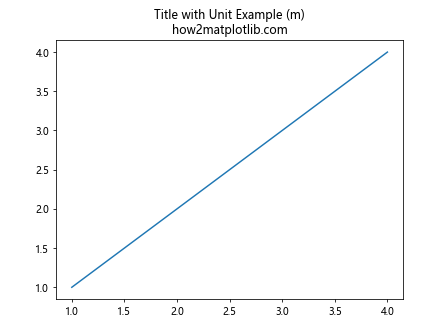
In this example, we are adding the unit ‘(m)’ to the title text.
Center Title and Subtitle
To center align the main title and subtitle in Matplotlib axes, we can use the MultilineText class. Here is an example:
import matplotlib.pyplot as plt
from matplotlib.text import Text, OffsetFrom

# Create a plot
fig, ax = plt.subplots()
ax.plot([1, 2, 3, 4], [1, 2, 3, 4])

# Main title
title = ax.set_title('Centered Title and Subtitle\nhow2matplotlib.com', fontsize=16, fontweight='bold', color='green')

# Subtitle
subtitle = Text(f'Subtitle Example', fontsize=12, ha='center', va='center')
title_bbox = title.get_window_extent()
subtitle_bbox = subtitle.get_window_extent(fig.subplots_adjust(left=title_bbox.left, bottom=title_bbox.bottom, right=title_bbox.right, top=title_bbox.bottom + 0.05)

plt.show()
In this example, we are center aligning the main title and subtitle using MultilineText class.
These are some of the ways to set and customize titles in Matplotlib axes. By exploring different parameters and options, you can create visually appealing plots with informative titles. Experiment with these examples and customize them to suit your own data visualization needs.