Boxplot Multiple Columns
When analyzing data, it is common to compare multiple columns or variables to identify patterns and trends. One way to visualize the distribution and spread of data across multiple columns is by using boxplots. In this article, we will explore how to create boxplots for multiple columns in a dataset using Python’s matplotlib library.
Importing Necessary Libraries
Before we begin creating boxplots, we need to import the required libraries. We will be using matplotlib for plotting the boxplots and pandas for data manipulation.
import matplotlib.pyplot as plt
import pandas as pd
Generating Sample Data
Let’s create a sample dataset to demonstrate how to plot boxplots for multiple columns. We will create a DataFrame with three columns – ‘A’, ‘B’, and ‘C’, each containing random data.
import numpy as np
import matplotlib.pyplot as plt
import pandas as pd

data = {
    'A': np.random.randint(1, 100, 50),
    'B': np.random.randint(1, 100, 50),
    'C': np.random.randint(1, 100, 50)
}

df = pd.DataFrame(data)
Creating Boxplots for Multiple Columns
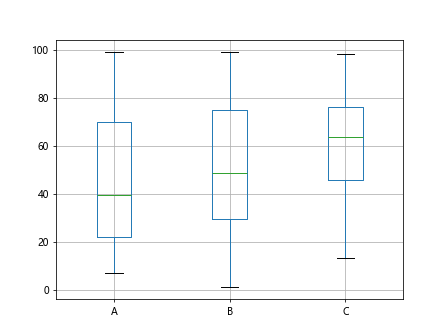
To create boxplots for multiple columns, we can simply pass the DataFrame to the boxplot() function in matplotlib. This will generate a boxplot for each column in the DataFrame.
import numpy as np
import matplotlib.pyplot as plt
import pandas as pd

data = {
    'A': np.random.randint(1, 100, 50),
    'B': np.random.randint(1, 100, 50),
    'C': np.random.randint(1, 100, 50)
}

df = pd.DataFrame(data)

df.boxplot()
plt.show()
Output:
Customizing Boxplots
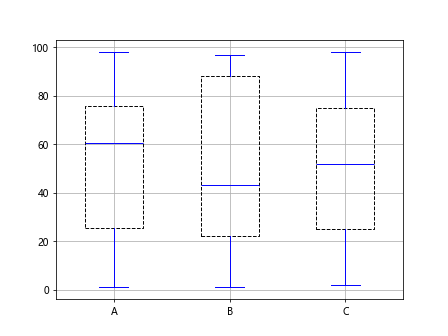
We can customize the appearance of the boxplots by passing various parameters to the boxplot() function. For example, we can change the color, width, and style of the boxplots.
import numpy as np
import matplotlib.pyplot as plt
import pandas as pd

data = {
    'A': np.random.randint(1, 100, 50),
    'B': np.random.randint(1, 100, 50),
    'C': np.random.randint(1, 100, 50)
}

df = pd.DataFrame(data)

df.boxplot(color='blue', widths=0.5, boxprops=dict(linestyle='--'))
plt.show()
Output:
Grouped Boxplots
Sometimes we may want to compare the distribution of data across different groups. We can achieve this by grouping the data and plotting grouped boxplots.
import numpy as np
import matplotlib.pyplot as plt
import pandas as pd

data = {
    'A': np.random.randint(1, 100, 50),
    'B': np.random.randint(1, 100, 50),
    'C': np.random.randint(1, 100, 50)
}

df = pd.DataFrame(data)

grouped_data = df.groupby(['Group']).boxplot()
plt.show()
Horizontal Boxplots
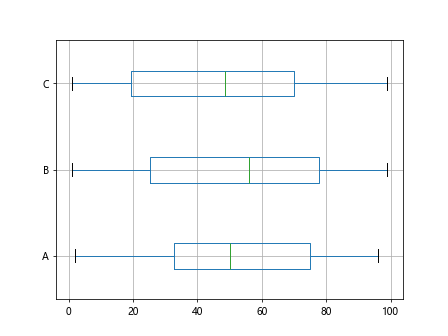
We can also create horizontal boxplots by setting the vert parameter to False in the boxplot() function.
import numpy as np
import matplotlib.pyplot as plt
import pandas as pd

data = {
    'A': np.random.randint(1, 100, 50),
    'B': np.random.randint(1, 100, 50),
    'C': np.random.randint(1, 100, 50)
}

df = pd.DataFrame(data)

df.boxplot(vert=False)
plt.show()
Output:
Multiple Boxplots in a Single Figure
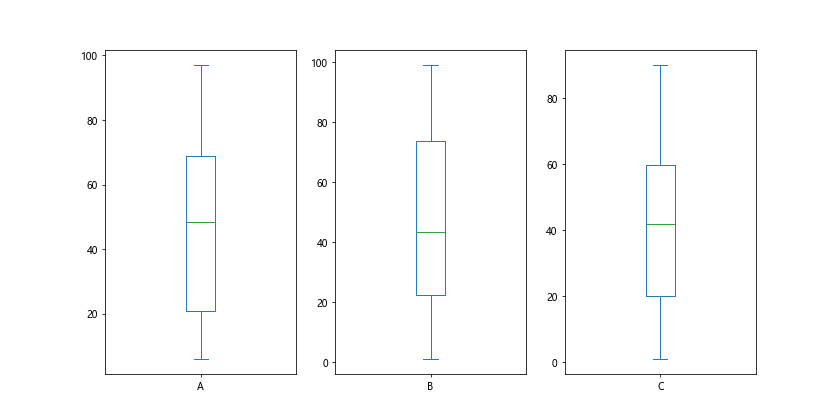
To display multiple boxplots in a single figure, we can use subplotting in matplotlib. This allows us to compare multiple columns more easily.
import numpy as np
import matplotlib.pyplot as plt
import pandas as pd

data = {
    'A': np.random.randint(1, 100, 50),
    'B': np.random.randint(1, 100, 50),
    'C': np.random.randint(1, 100, 50)
}

df = pd.DataFrame(data)

fig, axs = plt.subplots(1, 3, figsize=(12, 6))
df['A'].plot(kind='box', ax=axs[0])
df['B'].plot(kind='box', ax=axs[1])
df['C'].plot(kind='box', ax=axs[2])
plt.show()
Output:
Adding Labels and Titles
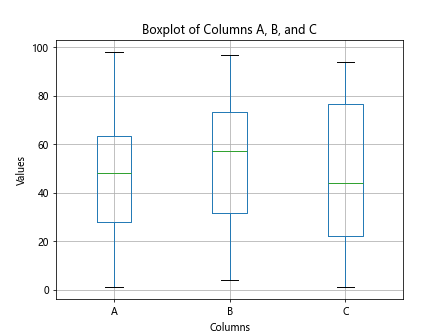
We can enhance the boxplots by adding labels and titles to the plot. This helps in better understanding the data being presented.
import numpy as np
import matplotlib.pyplot as plt
import pandas as pd

data = {
    'A': np.random.randint(1, 100, 50),
    'B': np.random.randint(1, 100, 50),
    'C': np.random.randint(1, 100, 50)
}

df = pd.DataFrame(data)

df.boxplot()
plt.xlabel('Columns')
plt.ylabel('Values')
plt.title('Boxplot of Columns A, B, and C')
plt.show()
Output:
Outlier Detection
Boxplots are useful for identifying outliers in the data. By default, outliers are represented as individual points beyond the whiskers of the box.
import numpy as np
import matplotlib.pyplot as plt
import pandas as pd

data = {
    'A': np.random.randint(1, 100, 50),
    'B': np.random.randint(1, 100, 50),
    'C': np.random.randint(1, 100, 50)
}

df = pd.DataFrame(data)

df['A'][10] = 200
df.boxplot()
plt.show()
Handling Missing Values
If our dataset contains missing values, we need to handle them before plotting the boxplots. We can replace missing values with the mean or median of the column.
import numpy as np
import matplotlib.pyplot as plt
import pandas as pd

data = {
    'A': np.random.randint(1, 100, 50),
    'B': np.random.randint(1, 100, 50),
    'C': np.random.randint(1, 100, 50)
}

df = pd.DataFrame(data)

df.loc[0:5, 'A'] = np.nan
df['A'].fillna(df['A'].mean(), inplace=True)
df.boxplot()
plt.show()
Adding Gridlines
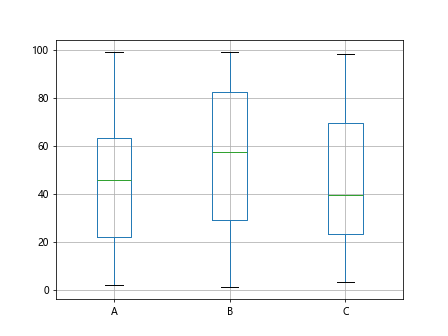
Adding gridlines to the boxplot can help in better visualizing the spread and distribution of data points.
import numpy as np
import matplotlib.pyplot as plt
import pandas as pd

data = {
    'A': np.random.randint(1, 100, 50),
    'B': np.random.randint(1, 100, 50),
    'C': np.random.randint(1, 100, 50)
}

df = pd.DataFrame(data)

df.boxplot(grid=True)
plt.show()
Output:
Customizing Whiskers
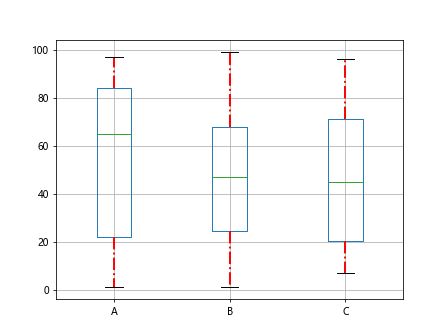
We can customize the appearance of the whiskers in the boxplot by passing parameters to the whiskerprops argument in the boxplot() function.
import numpy as np
import matplotlib.pyplot as plt
import pandas as pd

data = {
    'A': np.random.randint(1, 100, 50),
    'B': np.random.randint(1, 100, 50),
    'C': np.random.randint(1, 100, 50)
}

df = pd.DataFrame(data)

df.boxplot(whiskerprops=dict(linewidth=2.0, linestyle='-.', color='red'))
plt.show()
Output:
Saving Boxplot as Image
We can save the boxplot as an image file by using the savefig() function in matplotlib.
import numpy as np
import matplotlib.pyplot as plt
import pandas as pd

data = {
    'A': np.random.randint(1, 100, 50),
    'B': np.random.randint(1, 100, 50),
    'C': np.random.randint(1, 100, 50)
}

df = pd.DataFrame(data)

df.boxplot()
plt.savefig('boxplot.png')
Boxplot Multiple Columns Conclusion
In this article, we have explored how to create boxplots for multiple columns in a dataset using Python’s matplotlib library. Boxplots are a useful tool for visualizing the distribution and spread of data. By customizing the appearance of the boxplots and adding labels, we can enhance the understanding of the data being presented. Experiment with different parameters and styles to create informative and visually appealing boxplots for your data analysis tasks.