Bbox_to_anchor
The bbox_to_anchor parameter is a useful feature in Matplotlib that allows you to specify the position of a legend relative to a given bounding box. This can be very helpful when you want to place your legend outside the plot area, or when you want to position it in a custom location.
Basic Usage
The bbox_to_anchor parameter can be used when creating a legend in Matplotlib. It takes a tuple of (x, y) coordinates, where (0, 0) represents the lower-left corner and (1, 1) represents the upper-right corner of the plot.
import matplotlib.pyplot as plt
plt.plot([1, 2, 3, 4], label='Line 1')
plt.plot([4, 3, 2, 1], label='Line 2')
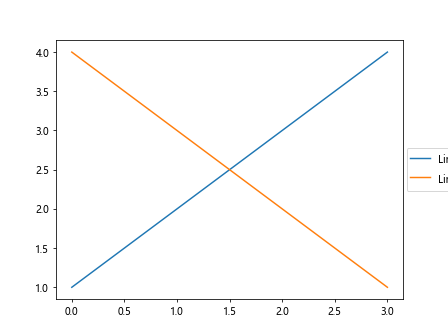
plt.legend(bbox_to_anchor=(1.05, 1), loc='upper left')
plt.show()
Output:
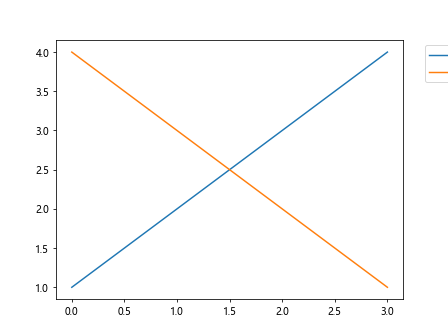
In this example, the legend is positioned just outside the upper-right corner of the plot.
Customizing the Bounding Box
You can further customize the position of the legend by adjusting the bbox_to_anchor parameter. For example, you can specify the anchor point as an offset from the corner of the plot.
import matplotlib.pyplot as plt

plt.plot([1, 2, 3, 4], label='Line 1')
plt.plot([4, 3, 2, 1], label='Line 2')
plt.legend(bbox_to_anchor=(0.5, 0.5), loc='upper left')
plt.show()
Output:
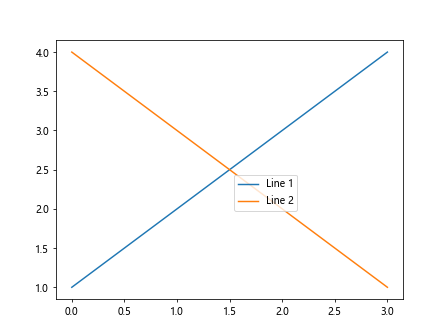
In this case, the legend will be positioned at the center of the plot.
Using Strings for Positioning
You can also use strings to specify the position of the legend relative to the plot. For example, ‘upper right’, ‘center’, ‘lower left’, etc.
import matplotlib.pyplot as plt

plt.plot([1, 2, 3, 4], label='Line 1')
plt.plot([4, 3, 2, 1], label='Line 2')
plt.legend(bbox_to_anchor=(0.5, 0.5), loc='center')
plt.show()
Output:
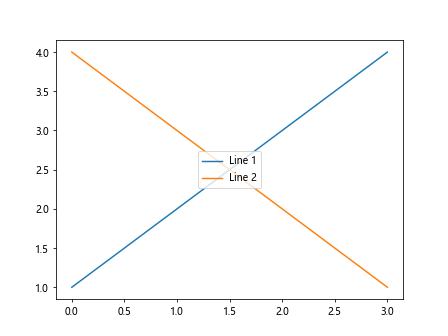
This will place the legend at the center of the plot.
Outside the Plot Area
If you want to place the legend completely outside the plot area, you can use values less than 0 or greater than 1 for the bbox_to_anchor parameter.
import matplotlib.pyplot as plt

plt.plot([1, 2, 3, 4], label='Line 1')
plt.plot([4, 3, 2, 1], label='Line 2')
plt.legend(bbox_to_anchor=(1.1, 0.5), loc='center')
plt.show()
Output:
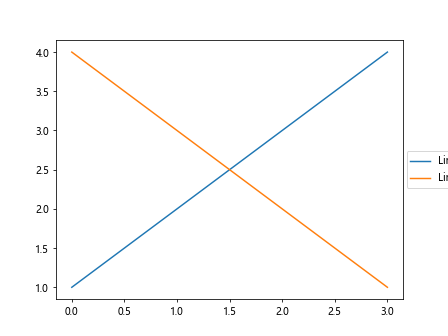
This will position the legend to the right of the plot.
Multiple Legends
You can also create multiple legends in a single plot using the bbox_to_anchor parameter. Each legend can be positioned independently.
import matplotlib.pyplot as plt

plt.plot([1, 2, 3, 4], label='Line 1')
plt.plot([4, 3, 2, 1], label='Line 2')
plt.legend(["A", "B"], title="Legend 1", bbox_to_anchor=(0.5, 0.5), loc='center left')
plt.legend(["C", "D"], title="Legend 2", bbox_to_anchor=(1.1, 0.5), loc='center right')
plt.show()
Output:
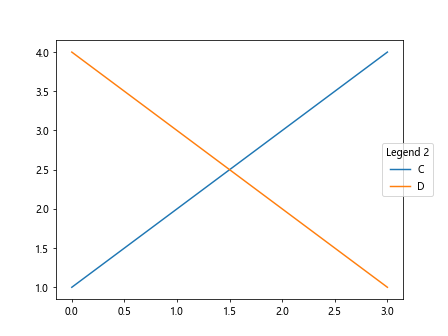
This will create two separate legends in the plot.
Combining with Subplots
When working with subplots, you can use the bbox_to_anchor parameter to position legends independently in each subplot.
import matplotlib.pyplot as plt

fig, axs = plt.subplots(2)

axs[0].plot([1, 2, 3, 4], label='Line 1')
axs[1].plot([4, 3, 2, 1], label='Line 2')

axs[0].legend(bbox_to_anchor=(1.05, 1), loc='upper left')
axs[1].legend(bbox_to_anchor=(1.05, 1), loc='upper left')

plt.show()
Output:
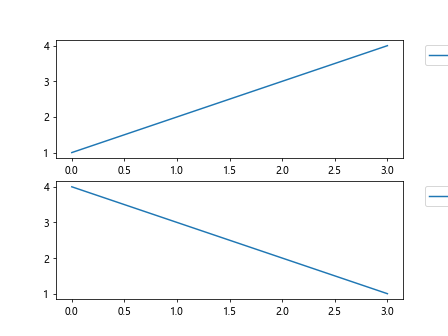
This will show a legend for each subplot positioned outside the respective subplot.
Adjusting the Bounding Box Size
You can also adjust the size of the bounding box using the bbox_transform parameter. This allows you to control the size and shape of the legend.
import matplotlib.pyplot as plt
plt.plot([1, 2, 3, 4], label='Line 1')
plt.plot([4, 3, 2, 1], label='Line 2')
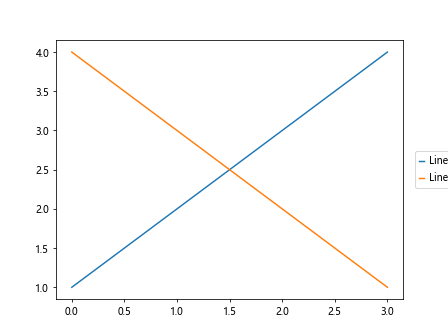
plt.legend(bbox_to_anchor=(1.05, 1), loc='upper left', bbox_transform=plt.gcf().transFigure)
plt.show()
Output:

This will adjust the size of the bounding box relative to the entire figure.
Offsetting the Bounding Box
Additionally, you can offset the bounding box from the anchor point using the bbox_transform parameter. This can be useful when you need to fine-tune the positioning of the legend.
import matplotlib.pyplot as plt

plt.plot([1, 2, 3, 4], label='Line 1')
plt.plot([4, 3, 2, 1], label='Line 2')
plt.legend(bbox_to_anchor=(1.05, 1), loc='upper left', bbox_transform=plt.gcf().transFigure, borderpad=2)
plt.show()
Output:
In this example, the bounding box is offset from the anchor point by 2 points.
Combining with Text
You can combine legends with text annotations in Matplotlib to create more complex visualizations. This can be done by positioning the legend relative to a text annotation.
import matplotlib.pyplot as plt

plt.plot([1, 2, 3, 4], label='Line 1')
plt.plot([4, 3, 2, 1], label='Line 2')

plt.text(4, 4, "Annotation", fontsize=12, color='red', bbox=dict(facecolor='none', edgecolor='black'))

plt.legend(bbox_to_anchor=(1.1, 1), loc='upper left')
plt.show()
Output:
In this example, the legend is placed to the right of the text annotation.
Fine-tuning with Padding
You can adjust the padding of the legend relative to the text or marker using the numpoints parameter. This allows you to control the spacing between the legend items.
import matplotlib.pyplot as plt

plt.plot([1, 2, 3, 4], label='Line 1')
plt.plot([4, 3, 2, 1], label='Line 2')
plt.legend(bbox_to_anchor=(1.1, 0.5), loc='center', numpoints=1)
plt.show()
Output:

In this case, the padding between legend items is set to 1 point.
Resizing the Legend
You can also resize the legend using the handlelength and handleheight parameters. This can be useful when you need to change the size of the legend items.
import matplotlib.pyplot as plt

plt.plot([1, 2, 3, 4], label='Line 1')
plt.plot([4, 3, 2, 1], label='Line 2')
plt.legend(bbox_to_anchor=(1.1, 0.5), loc='center', handlelength=2, handleheight=2)
plt.show()
Output:
This will resize the legend items to have a length and height of 2 points.
Rotating the Legend
You can rotate the legend items using the handlelength and handletextpad parameters. This will adjust the orientation of the legend items.
import matplotlib.pyplot as plt

plt.plot([1, 2, 3, 4], label='Line 1')
plt.plot([4, 3, 2, 1], label='Line 2')
plt.legend(bbox_to_anchor=(1.1, 0.5), loc='center', handlelength=0.5, handletextpad=0.5)
plt.show()
Output:
In this example, the legend items will be rotated by 0.5 points.
Adjusting the Border
You can customize the border of the legend using the fancybox and edgecolor parameters. This allows you to change the style and color of the legend border.
import matplotlib.pyplot as plt

plt.plot([1, 2, 3, 4], label='Line 1')
plt.plot([4, 3, 2, 1], label='Line 2')
plt.legend(bbox_to_anchor=(1.1, 0.5), loc='center', fancybox=True, edgecolor='red')
plt.show()
Output:
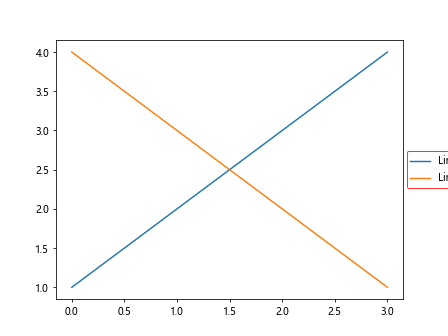
This will create a legend with a red border and a fancybox style.
Adjusting the Background Color
You can change the background color of the legend using the facecolor parameter. This allows you to customize the appearance of the legend.
import matplotlib.pyplot as plt

plt.plot([1, 2, 3, 4], label='Line 1')
plt.plot([4, 3, 2, 1], label='Line 2')
plt.legend(bbox_to_anchor=(1.1, 0.5), loc='center', facecolor='lightblue')
plt.show()
Output:
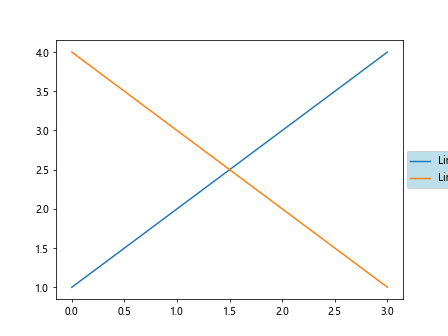
In this example, the legend will have a light blue background color.
Adding a Title to the Legend
You can add a title to the legend using the title parameter. This can be helpful in providing additional context to the legend items.
import matplotlib.pyplot as plt

plt.plot([1, 2, 3, 4], label='Line 1')
plt.plot([4, 3, 2, 1], label='Line 2')
plt.legend(["A", "B"], title="Legend", bbox_to_anchor=(1.1, 0.5), loc='center')
plt.show()
Output:
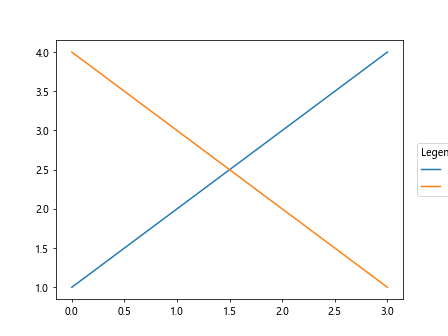
This will display a title “Legend” above the legend items.
Adjusting the Font Size
You can customize the font size of the legend items using the fontsize parameter. This allows you to change the size of the text in the legend.
import matplotlib.pyplot as plt

plt.plot([1, 2, 3, 4], label='Line 1')
plt.plot([4, 3, 2, 1], label='Line 2')
plt.legend(["A", "B"], title="Legend", fontsize=12, bbox_to_anchor=(1.1, 0.5), loc='center')
plt.show()
Output:
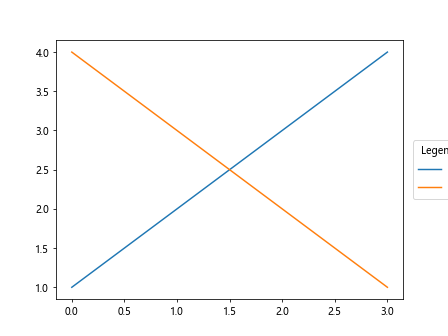
In this example, the font size of the legend items is set to 12 points.
Bbox_to_anchor Conclusion
The bbox_to_anchor parameter in Matplotlib is a versatile tool for positioning legends in custom locations relative to a bounding box. By using this parameter along with other customization options, you can create visually appealing and informative legends in your plots. Experiment with different values and settings to find the best layout for your specific visualization needs.