Adding Colorbar to Matplotlib Plots
Matplotlib is a popular library for creating visualizations in Python. One of the key components of a good visualization is a colorbar, which provides a visual representation of the mapping between colors and values in the plot. In this article, we will explore how to add colorbars to various types of plots using Matplotlib.
1. Adding Colorbar to a Contour Plot
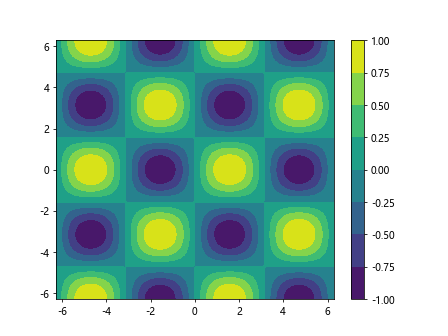
Contour plots are commonly used to visualize 2D data. In Matplotlib, you can add a colorbar to a contour plot by using the colorbar() function. Here’s an example:
import numpy as np
import matplotlib.pyplot as plt

x = np.linspace(-2*np.pi, 2*np.pi, 100)
y = np.linspace(-2*np.pi, 2*np.pi, 100)
X, Y = np.meshgrid(x, y)
Z = np.sin(X) * np.cos(Y)

plt.contourf(X, Y, Z, cmap='viridis')
plt.colorbar()
plt.show()
Output:

2. Adding Colorbar to a Scatter Plot
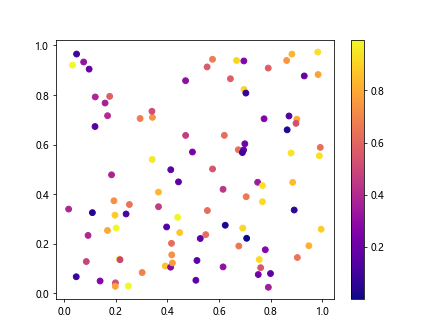
Scatter plots are used to visualize the relationship between two variables. You can add a colorbar to a scatter plot to represent a third variable. Here’s an example:
import numpy as np
import matplotlib.pyplot as plt

x = np.random.rand(100)
y = np.random.rand(100)
colors = np.random.rand(100)

plt.scatter(x, y, c=colors, cmap='plasma')
plt.colorbar()
plt.show()
Output:

3. Adding Colorbar to a 3D Plot
In Matplotlib, you can also add colorbars to 3D plots. Here’s an example of adding a colorbar to a 3D surface plot:
from mpl_toolkits.mplot3d import Axes3D
import numpy as np
import matplotlib.pyplot as plt

fig = plt.figure()
ax = fig.add_subplot(111, projection='3d')
X = np.linspace(-5, 5, 100)
Y = np.linspace(-5, 5, 100)
X, Y = np.meshgrid(X, Y)
Z = np.sin(np.sqrt(X**2 + Y**2))

surf = ax.plot_surface(X, Y, Z, cmap='coolwarm')
fig.colorbar(surf)
plt.show()
4. Customizing Colorbars
You can customize colorbars in Matplotlib by changing various properties such as the orientation, ticks, and labels. Here’s an example of customizing a colorbar:
import numpy as np
import matplotlib.pyplot as plt

x = np.linspace(0, 10, 100)
y = np.linspace(0, 10, 100)
Z = np.sqrt(X**2 + Y**2)

plt.contourf(X, Y, Z, cmap='inferno')
cbar = plt.colorbar()
cbar.set_label('Distance from Origin', fontsize=12)
cbar.ax.tick_params(labelsize=10)
plt.show()
5. Discrete Colorbars
Sometimes you may want to use a discrete colorbar instead of a continuous one. You can achieve this by specifying the number of levels in the colorbar. Here’s an example:
import numpy as np
import matplotlib.pyplot as plt

x = np.linspace(0, 10, 100)
y = np.linspace(0, 10, 100)
Z = np.round(np.sqrt(X**2 + Y**2))

plt.contourf(X, Y, Z, levels=5, cmap='tab10')
plt.colorbar()
plt.show()
6. Colorbar Placement
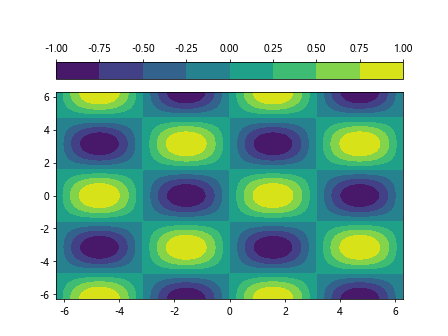
By default, colorbars are placed to the right of the plot. However, you can customize the placement of the colorbar using the location parameter. Here’s an example of placing the colorbar at the top of the plot:
import numpy as np
import matplotlib.pyplot as plt

x = np.linspace(-2*np.pi, 2*np.pi, 100)
y = np.linspace(-2*np.pi, 2*np.pi, 100)
X, Y = np.meshgrid(x, y)
Z = np.sin(X) * np.cos(Y)

plt.contourf(X, Y, Z, cmap='viridis')
cbar = plt.colorbar(location='top')
plt.show()
Output:

7. Vertical Colorbars
By default, colorbars are horizontal. You can change the orientation of the colorbar to vertical using the orientation parameter. Here’s an example:
import numpy as np
import matplotlib.pyplot as plt

x = np.linspace(0, 10, 100)
y = np.linspace(0, 10, 100)
Z = np.sqrt(X**2 + Y**2)

plt.contourf(X, Y, Z, cmap='inferno')
plt.colorbar(orientation='vertical')
plt.show()
8. Logarithmic Colorbars
In some cases, you may want to use a logarithmic color scale. You can achieve this by setting the norm parameter to matplotlib.colors.LogNorm. Here’s an example:
import numpy as np
import matplotlib.pyplot as plt

x = np.linspace(0, 10, 100)
y = np.linspace(0, 10, 100)
Z = np.sqrt(X**2 + Y**2)

plt.contourf(X, Y, Z, norm=matplotlib.colors.LogNorm(), cmap='inferno')
plt.colorbar()
plt.show()
9. Colorbar Callbacks
You can customize colorbars further by adding callback functions. Here’s an example of adding a callback function to format the colorbar ticks as percentages:
import numpy as np
import matplotlib.pyplot as plt

x = np.linspace(0, 10, 100)
y = np.linspace(0, 10, 100)
Z = np.sqrt(X**2 + Y**2)

plt.contourf(X, Y, Z, cmap='inferno')
cbar = plt.colorbar()
cbar.set_ticks([0, 0.5, 1])
cbar.set_ticklabels(['0%', '50%', '100%'])
plt.show()
10. Colorbar Transparency
You can make colorbars partially transparent by setting the alpha parameter. Here’s an example of adding a semi-transparent colorbar:
import numpy as np
import matplotlib.pyplot as plt

x = np.linspace(0, 10, 100)
y = np.linspace(0, 10, 100)
Z = np.sqrt(X**2 + Y**2)

plt.contourf(X, Y, Z, cmap='inferno')
cbar = plt.colorbar()
cbar.set_alpha(0.8)
plt.show()
In conclusion, colorbars are an essential component of visualizations in Matplotlib. By understanding how to add and customize colorbars, you can enhance the clarity and effectiveness of your plots. Experiment with different colorbar settings to create visually appealing and informative visualizations.