Colorbar Fraction
In this article, we will explore how to customize the fraction of a colorbar in Matplotlib. Colorbars are a great way to represent the mapping between colors and numerical values in a plot. By adjusting the fraction of a colorbar, you can control its size and position within a plot.
Basic Colorbar Fraction
The fraction parameter in the colorbar() function allows you to set the size of the colorbar. A fraction of 1 means the colorbar takes up the entire space, while a fraction of 0.5 means it takes up half the space.
import matplotlib.pyplot as plt
import numpy as np

# Create a random 2D array
data = np.random.rand(10, 10)

# Plot the data with a colorbar
plt.imshow(data)
plt.colorbar(fraction=0.5)

plt.show()
Output:
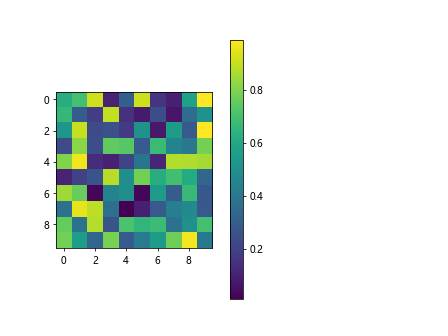
Colorbar Fraction Example
Let’s create a scatter plot with a colorbar and adjust the fraction of the colorbar.
import matplotlib.pyplot as plt
import numpy as np

x = np.random.rand(100)
y = np.random.rand(100)
colors = np.random.rand(100)

plt.scatter(x, y, c=colors, cmap='viridis')
plt.colorbar(fraction=0.7)

plt.show()
Output:
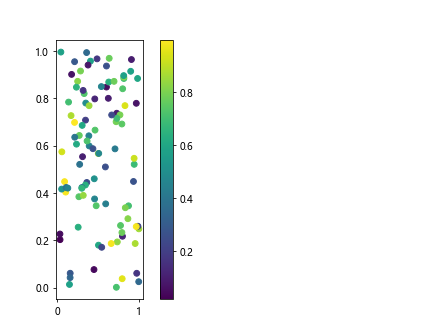
Colorbar Fraction Position
You can also adjust the position of the colorbar within the plot using the pad parameter. This parameter controls the distance between the colorbar and the plot.
import matplotlib.pyplot as plt
import numpy as np

data = np.random.rand(10, 10)

plt.imshow(data)
plt.colorbar(fraction=0.5, pad=0.1)

plt.show()
Output:
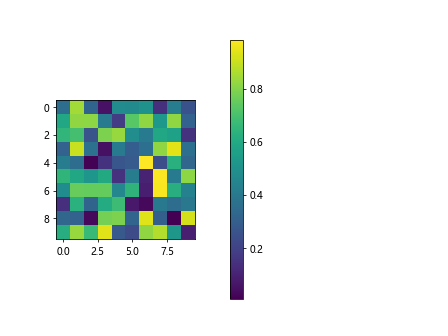
Colorbar Fraction Customization
You can further customize the colorbar by changing its orientation (horizontal or vertical) and the direction of the color mapping (increasing or decreasing).
import matplotlib.pyplot as plt
import numpy as np

data = np.random.rand(10, 10)

plt.imshow(data)
plt.colorbar(fraction=0.7, orientation='horizontal', ticks=[0, 0.5, 1])

plt.show()
Output:
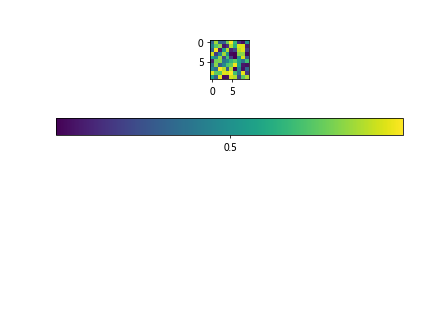
Colorbar Fraction Ticks
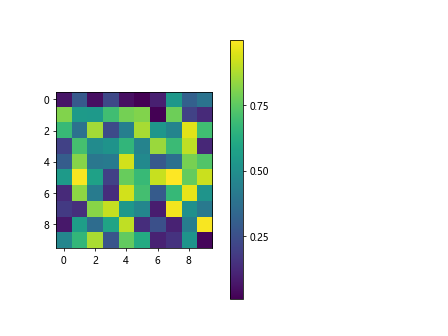
You can specify the tick locations on the colorbar using the ticks parameter. This allows you to control the values shown on the colorbar.
import matplotlib.pyplot as plt
import numpy as np

data = np.random.rand(10, 10)

plt.imshow(data)
plt.colorbar(fraction=0.5, ticks=[0, 0.25, 0.5, 0.75, 1])

plt.show()
Output:
Colorbar Fraction Formatter
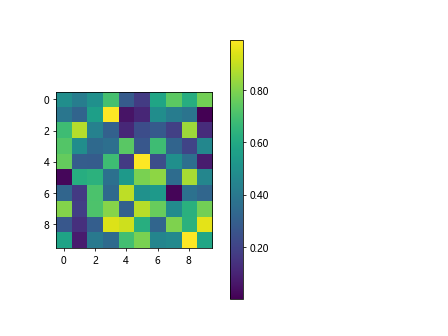
If you want to customize the formatting of the colorbar ticks, you can use the format parameter. This allows you to display the ticks in a specific format, such as scientific notation.
import matplotlib.pyplot as plt
import numpy as np

data = np.random.rand(10, 10)

plt.imshow(data)
plt.colorbar(fraction=0.5, format='%.2f')

plt.show()
Output:
Colorbar Fraction Boundary
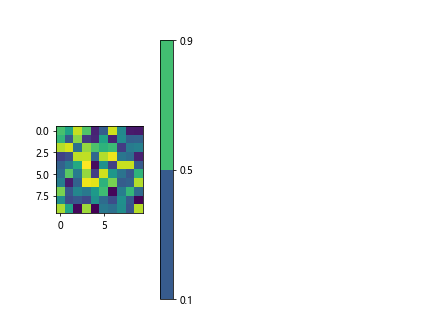
Sometimes you may want to set the boundaries of the colorbar to specific values. This can be achieved using the boundaries parameter.
import matplotlib.pyplot as plt
import numpy as np

data = np.random.rand(10, 10)

plt.imshow(data)
plt.colorbar(fraction=0.7, boundaries=[0.1, 0.5, 0.9])

plt.show()
Output:
Colorbar Fraction Spacing
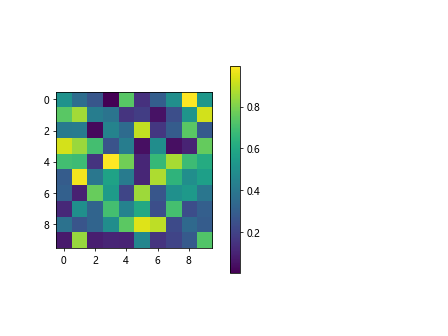
You can adjust the spacing between the colorbar and the plot using the shrink parameter. This allows you to control the size of the colorbar relative to the plot.
import matplotlib.pyplot as plt
import numpy as np

data = np.random.rand(10, 10)

plt.imshow(data)
plt.colorbar(fraction=0.5, shrink=0.8)

plt.show()
Output:
Colorbar Fraction Transparency
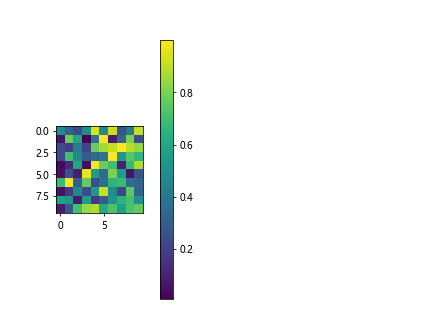
You can make the colorbar partially transparent by setting the alpha value using the alpha parameter.
import matplotlib.pyplot as plt
import numpy as np

data = np.random.rand(10, 10)

plt.imshow(data)
cb = plt.colorbar(fraction=0.7)
cb.set_alpha(0.5)

plt.show()
Output:
Colorbar Fraction Color
You can change the color of the colorbar using the color parameter. This allows you to match the colorbar with the overall color scheme of your plot.
import matplotlib.pyplot as plt
import numpy as np

data = np.random.rand(10, 10)

plt.imshow(data)
cb = plt.colorbar(fraction=0.5)
cb.set_color('red')

plt.show()
Colorbar Fraction Label
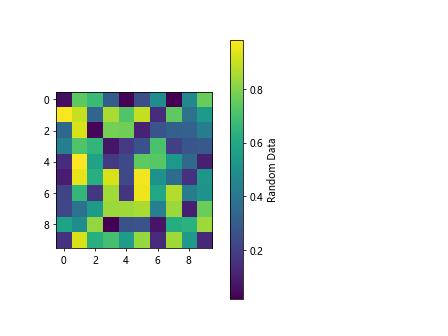
You can add a label to the colorbar to indicate what the color mapping represents using the label parameter.
import matplotlib.pyplot as plt
import numpy as np

data = np.random.rand(10, 10)

plt.imshow(data)
cb = plt.colorbar(fraction=0.5)
cb.set_label('Random Data')

plt.show()
Output:
Colorbar Fraction Fontsize
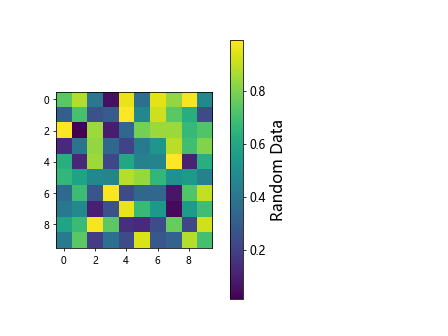
You can adjust the fontsize of the colorbar label and ticks using the fontsize parameter.
import matplotlib.pyplot as plt
import numpy as np

data = np.random.rand(10, 10)

plt.imshow(data)
cb = plt.colorbar(fraction=0.5)
cb.ax.tick_params(labelsize=12)
cb.set_label('Random Data', fontsize=16)

plt.show()
Output:
Colorbar Fraction Thickness
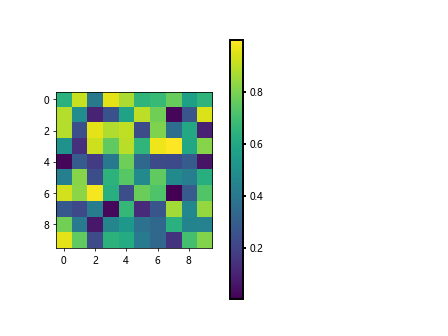
You can set the thickness of the colorbar using the fraction parameter. A larger value will make the colorbar thicker.
import matplotlib.pyplot as plt
import numpy as np

data = np.random.rand(10, 10)

plt.imshow(data)
cb = plt.colorbar(fraction=0.5)
cb.ax.tick_params(width=2)
cb.outline.set_linewidth(2)

plt.show()
Output:
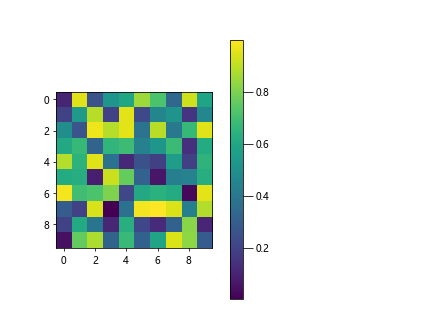
Colorbar Fraction Tick Length
You can control the length of the colorbar ticks using the length parameter. This allows you to adjust the visibility of the ticks.
import matplotlib.pyplot as plt
import numpy as np

data = np.random.rand(10, 10)

plt.imshow(data)
cb = plt.colorbar(fraction=0.5)
cb.ax.tick_params(length=10)

plt.show()
Output:
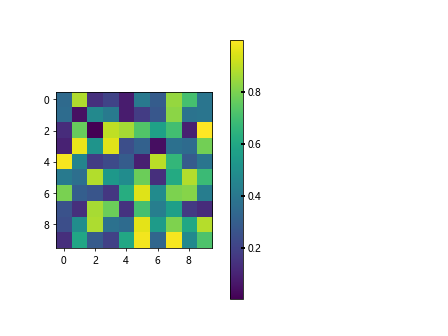
Colorbar Fraction Tick Style
You can change the style of the colorbar ticks using the style parameter. This allows you to customize the appearance of the ticks.
import matplotlib.pyplot as plt
import numpy as np

data = np.random.rand(10, 10)

plt.imshow(data)
cb = plt.colorbar(fraction=0.5)
cb.ax.tick_params(tickdir='inout', width=2)

plt.show()
Output:
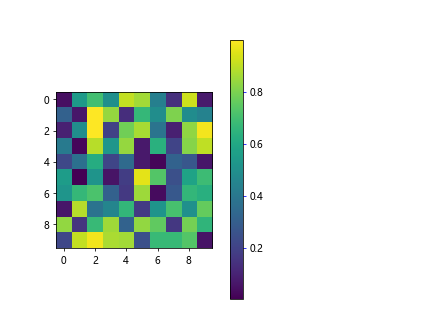
Colorbar Fraction Tick Color
You can set the color of the colorbar ticks using the color parameter. This allows you to match the color of the ticks with the color scheme of your plot.
import matplotlib.pyplot as plt
import numpy as np

data = np.random.rand(10, 10)

plt.imshow(data)
cb = plt.colorbar(fraction=0.5)
cb.ax.tick_params(color='blue')

plt.show()
Output:
Colorbar Fraction Conclusion
In this article, we have explored how to customize the fraction of a colorbar in Matplotlib. By adjusting the size, position, and other parameters of the colorbar, you can create visually appealing plots that effectively convey your data. Experiment with different settings to find the colorbar fraction that best suits your plot.