Contour Colorbar
Contour colorbar is a visual representation of the mapping between the colors and the values of a contour plot. It provides a reference to help identify the range of values associated with different colors in the plot. In this article, we will explore how to customize and enhance the contour colorbar in matplotlib.
Basic Contour Colorbar
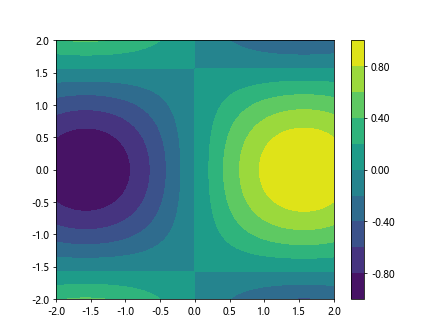
To create a basic contour colorbar in matplotlib, you can use the contourf function along with the colorbar function to add a colorbar to the plot.
import matplotlib.pyplot as plt
import numpy as np

x = np.linspace(-2, 2, 100)
y = np.linspace(-2, 2, 100)
X, Y = np.meshgrid(x, y)
Z = np.sin(X) * np.cos(Y)

plt.contourf(X, Y, Z, levels=10)
plt.colorbar()
plt.show()
Output:
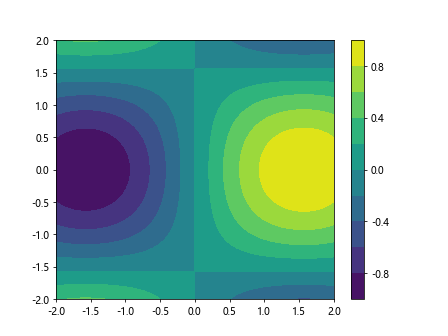
In this example, we first create a meshgrid of x and y values, and then calculate the corresponding z values using a mathematical expression. We use the contourf function to create a filled contour plot with 10 levels, and then add a colorbar to the plot using the colorbar function.
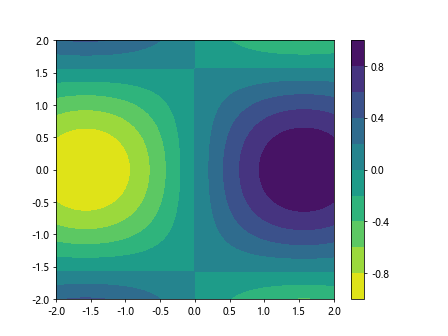
Customizing Contour Colorbar
You can customize the contour colorbar by setting various properties such as the label, ticks, tick labels, and colormap. Here is an example that demonstrates how to customize the contour colorbar.
import matplotlib.pyplot as plt
import numpy as np

x = np.linspace(-2, 2, 100)
y = np.linspace(-2, 2, 100)
X, Y = np.meshgrid(x, y)
Z = np.sin(X) * np.cos(Y)

contour = plt.contourf(X, Y, Z, levels=10, cmap='coolwarm')
cbar = plt.colorbar(contour)
cbar.set_label('Custom Label')
cbar.set_ticks([-1, 0, 1])
cbar.ax.set_yticklabels(['Low', 'Medium', 'High'])
plt.show()
Output:
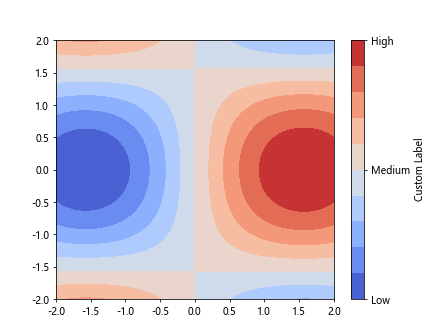
In this example, we set the colormap to ‘coolwarm’ using the cmap parameter in the contourf function. We then customize the colorbar label, ticks, and tick labels using the set_label, set_ticks, and set_yticklabels functions, respectively.
Logarithmic Contour Colorbar
You can create a logarithmic contour colorbar by setting the norm parameter in the contourf function to matplotlib.colors.LogNorm. Here is an example that demonstrates how to create a logarithmic contour colorbar.
import matplotlib.pyplot as plt
import numpy as np
import matplotlib.colors

x = np.linspace(1, 100, 100)
y = np.linspace(1, 100, 100)
X, Y = np.meshgrid(x, y)
Z = np.log(X) + np.log(Y)

contour = plt.contourf(X, Y, Z, levels=np.logspace(0, 4, 10), norm=matplotlib.colors.LogNorm())
cbar = plt.colorbar(contour)
plt.show()
In this example, we calculate the z values using a logarithmic expression and set the levels to logarithmically spaced values using the np.logspace function. We then set the norm parameter in the contourf function to matplotlib.colors.LogNorm to create a logarithmic contour colorbar.
Discrete Contour Colorbar
You can create a discrete contour colorbar by setting the locator parameter in the colorbar function to a matplotlib.ticker.FixedLocator object. Here is an example that demonstrates how to create a discrete contour colorbar.
import matplotlib.pyplot as plt
import numpy as np
import matplotlib.ticker

x = np.linspace(-2, 2, 100)
y = np.linspace(-2, 2, 100)
X, Y = np.meshgrid(x, y)
Z = np.sin(X) * np.cos(Y)

contour = plt.contourf(X, Y, Z, levels=[-1, -0.5, 0, 0.5, 1])
cbar = plt.colorbar(contour)
cbar.locator = matplotlib.ticker.FixedLocator([-1, -0.5, 0, 0.5, 1])
plt.show()
Output:
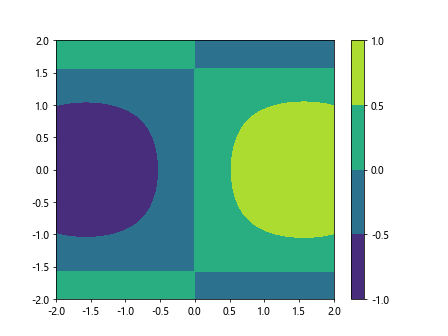
In this example, we set the levels to discrete values in the contourf function and then set the locator parameter in the colorbar function to a FixedLocator object containing the discrete values to create a discrete contour colorbar.
Contour Colorbar with Different Orientation
You can change the orientation of the contour colorbar by setting the orientation parameter in the colorbar function to either ‘vertical’ or ‘horizontal’. Here is an example that demonstrates how to create a vertical contour colorbar.
import matplotlib.pyplot as plt
import numpy as np

x = np.linspace(-2, 2, 100)
y = np.linspace(-2, 2, 100)
X, Y = np.meshgrid(x, y)
Z = np.sin(X) * np.cos(Y)

contour = plt.contourf(X, Y, Z, levels=10)
cbar = plt.colorbar(contour, orientation='vertical')
plt.show()
Output:

In this example, we create a filled contour plot with 10 levels using the contourf function and then add a vertical colorbar to the plot by setting the orientation parameter in the colorbar function to ‘vertical’.
Contour Colorbar with Tick Labels
You can add tick labels to the contour colorbar using the format parameter in the colorbar function. Here is an example that demonstrates how to add tick labels to the contour colorbar.
import matplotlib.pyplot as plt
import numpy as np

x = np.linspace(-2, 2, 100)
y = np.linspace(-2, 2, 100)
X, Y = np.meshgrid(x, y)
Z = np.sin(X) * np.cos(Y)

contour = plt.contourf(X, Y, Z, levels=10)
cbar = plt.colorbar(contour, format='%.2f')
plt.show()
Output:
In this example, we create a filled contour plot with 10 levels using the contourf function and then add tick labels with two decimal places to the colorbar by setting the format parameter in the colorbar function to ‘%.2f’.
Multiple Contour Colorbars
You can create multiple contour colorbars in a single plot by using the colorbar function multiple times with different axes. Here is an example that demonstrates how to create multiple contour colorbars.
import matplotlib.pyplot as plt
import numpy as np

x = np.linspace(-2, 2, 100)
y = np.linspace(-2, 2, 100)
X, Y = np.meshgrid(x, y)
Z1 = np.sin(X) * np.cos(Y)
Z2 = np.cos(X) * np.sin(Y)

contour1 = plt.contourf(X, Y, Z1, levels=10)
cbar1 = plt.colorbar(contour1)
cbar1.set_label('Contour 1')

contour2 = plt.contourf(X, Y, Z2, levels=10)
cbar2 = plt.colorbar(contour2)
cbar2.set_label('Contour 2')

plt.show()
Output:
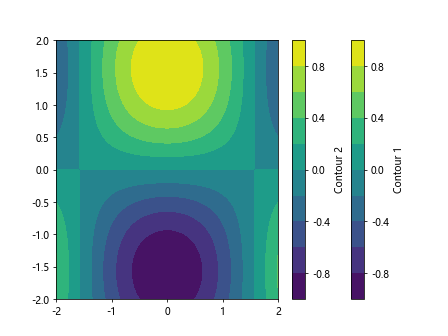
In this example, we create two filled contour plots with 10 levels each using the contourf function, and then add two colorbars to the plot using the colorbar function with different labels for each colorbar.
Contour Colorbar Placement
You can control the placement of the contour colorbar within the plot by creating a separate axis for the colorbar and adjusting its position. Here is an example that demonstrates how to customize the placement of the contour colorbar.
import matplotlib.pyplot as plt
import numpy as np

x = np.linspace(-2, 2, 100)
y = np.linspace(-2, 2, 100)
X, Y = np.meshgrid(x, y)
Z = np.sin(X) * np.cos(Y)

fig, ax = plt.subplots()
contour = ax.contourf(X, Y, Z, levels=10)
cbar = plt.colorbar(contour, ax=ax)
cbar.set_label('Custom Label')
cbar.set_ticks([-1, 0, 1])
cbar.ax.set_yticklabels(['Low', 'Medium', 'High'])

cbar.ax.set_position([0.9, 0.1, 0.02, 0.8])
plt.show()
Output:
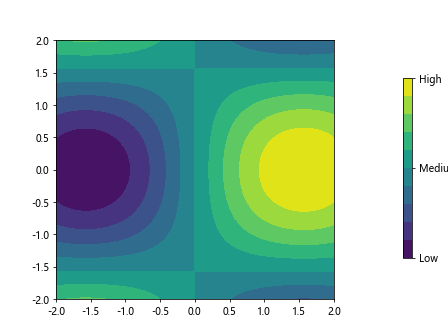
In this example, we create a figure and axis using plt.subplots() and contourf with 10 levels. We then add a colorbar to the plot using the colorbar function with the specified axis ax. We customize the colorbar label, ticks, and tick labels as before, and then adjust the position of the colorbar within the plot by setting the position of the axis using set_position with [left, bottom, width, height] values.
Transparent Contour Colorbar
You can make the contour colorbar transparent by setting the alpha parameter in the colorbar function. Here is an example that demonstrates how to create a transparent contour colorbar.
import matplotlib.pyplot as plt
import numpy as np

x = np.linspace(-2, 2, 100)
y = np.linspace(-2, 2, 100)
X, Y = np.meshgrid(x, y)
Z = np.sin(X) * np.cos(Y)

contour = plt.contourf(X, Y, Z, levels=10)
cbar = plt.colorbar(contour)
cbar.set_alpha(0.5)
plt.show()
Output:

In this example, we create a filled contour plot with 10 levels using the contourf function and then add a colorbar to the plot. We make the colorbar transparent by setting the alpha parameter in the colorbar function to 0.5.
Contour Colorbar with Custom Colormap
You can create a contour colorbar with a custom colormap by using the cmap parameter in the contourf function to specify a custom colormap. Here is an example that demonstrates how to create a contour colorbar with a custom colormap.
import matplotlib.pyplot as plt
import numpy as np
import matplotlib.colors

x = np.linspace(-2, 2, 100)
y = np.linspace(-2, 2, 100)
X, Y = np.meshgrid(x, y)
Z = np.sin(X) * np.cos(Y)

custom_cmap = plt.get_cmap('viridis_r')
contour = plt.contourf(X, Y, Z, levels=10, cmap=custom_cmap)
cbar = plt.colorbar(contour)
plt.show()
Output:
In this example, we create a custom colormap using the get_cmap function with the name of the custom colormap ‘viridis_r’. We then create a filled contour plot with 10 levels using the contourf function and specify the custom colormap using the cmap parameter.
Contour Colorbar Mappable
You can create a mappable object for the contour colorbar and pass it to the colorbar function for more flexibility in customizing the colorbar. Here is an example that demonstrates how to create a mappable object for the contour colorbar.
import matplotlib.pyplot as plt
import numpy as np

x = np.linspace(-2, 2, 100)
y = np.linspace(-2, 2, 100)
X, Y = np.meshgrid(x, y)
Z = np.sin(X) * np.cos(Y)

contour = plt.contourf(X, Y, Z, levels=10)
mappable = plt.cm.ScalarMappable(cmap=plt.cm.viridis)
mappable.set_array(Z)
cbar = plt.colorbar(mappable)
plt.show()
In this example, we create a filled contour plot with 10 levels using the contourf function. We then create a mappable object using ScalarMappable with the desired colormap ‘viridis’ and set the array to be the z values. Finally, we add the colorbar to the plot by passing the mappable object to the colorbar function.
contour colorbar Conclusion
In this article, we have explored various ways to customize and enhance the contour colorbar in matplotlib. By using different parameters and techniques, you can create visually appealing contour colorbars that provide valuable information about the data represented in the plot. Experiment with the examples provided and try out different settings to create the perfect contour colorbar for your plots.