Default Linewidth in Matplotlib
In Matplotlib, a popular Python library for creating 2D plots and graphs, the default linewidth for lines and borders in plots can be customized. This can be useful for adjusting the appearance of your plots according to your preferences or the requirements of your project. In this article, we will explore how to change the default linewidth in Matplotlib.
Setting the Default Line Width
You can change the default linewidth for all lines in your plot by using the rcParams dictionary in Matplotlib. This dictionary contains a variety of customizable parameters that can be set to change the default behavior of the library. To set the default linewidth, you can use the key 'lines.linewidth' and assign it a value of your choice.
import matplotlib.pyplot as plt

# Set default linewidth to 2
plt.rcParams['lines.linewidth'] = 2
Example: Creating a Plot with Default Linewidth
Let’s create a simple plot to demonstrate the effect of changing the default linewidth.
import matplotlib.pyplot as plt

# Set default linewidth to 2
plt.rcParams['lines.linewidth'] = 2

x = [1, 2, 3, 4, 5]
y = [1, 4, 9, 16, 25]

plt.plot(x, y)
plt.show()
Output:
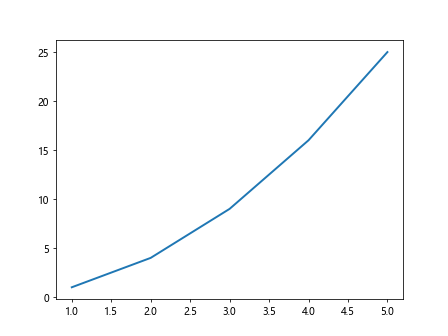
In this example, all lines in the plot will have a linewidth of 2 because we set the default linewidth to 2 earlier.
Resetting the Default Line Width
If you want to reset the default linewidth to its original value, you can simply set it back to the default value of 1.
import matplotlib.pyplot as plt

# Reset default linewidth to 1
plt.rcParams['lines.linewidth'] = 1
Example: Creating a Plot with Reset Default Linewidth
Let’s create another plot to demonstrate how resetting the default linewidth works.
import matplotlib.pyplot as plt

# Reset default linewidth to 1
plt.rcParams['lines.linewidth'] = 1

x = [1, 2, 3, 4, 5]
y = [1, 4, 9, 16, 25]

plt.plot(x, y)
plt.show()
Output:
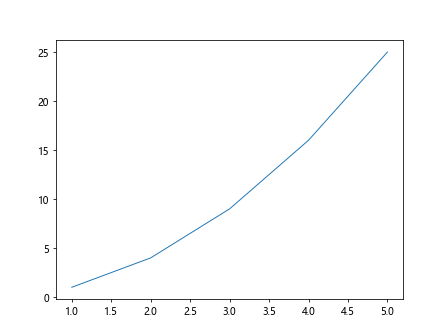
In this example, all lines in the plot will have a linewidth of 1 because we reset the default linewidth to 1.
Changing Line Width for Specific Plots
In addition to changing the default linewidth, you can also set the linewidth for specific lines or borders in your plots using the linewidth parameter in the plot functions. This allows you to have more control over the appearance of individual elements in your plots.
# Set linewidth to 3 for a specific line
plt.plot(x, y, linewidth=3)
Example: Creating a Plot with Specific Line Width
Let’s create a plot where one line has a linewidth of 3 while the other lines use the default linewidth.
import matplotlib.pyplot as plt

x = [1, 2, 3, 4, 5]
y = [1, 4, 9, 16, 25]
y2 = [2, 4, 6, 8, 10]

plt.plot(x, y)
plt.plot(x, y2, linewidth=3)
plt.show()
Output:
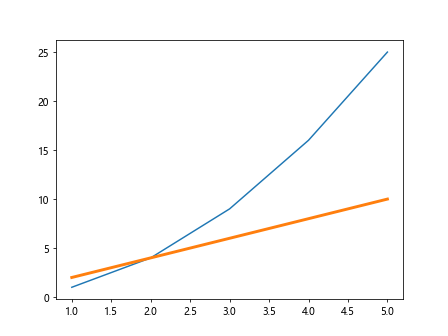
In this example, the second line in the plot will have a linewidth of 3, while the first line will use the default linewidth.
Customizing Line Width in Different Types of Plots
The linewidth parameter can be used in various types of plots in Matplotlib, such as scatter plots and bar plots. By adjusting the linewidth, you can control the thickness of markers in scatter plots or the borders of bars in bar plots.
import matplotlib.pyplot as plt

x = [1, 2, 3, 4, 5]
y = [1, 4, 9, 16, 25]

# Set linewidth for markers in a scatter plot
plt.scatter(x, y, s=100, linewidth=2)

# Set linewidth for the borders of bars in a bar plot
plt.bar(x, y, linewidth=2)
Example: Scatter Plot with Customized Marker Line Width
Let’s create a scatter plot with customized marker linewidth to demonstrate how it affects the appearance of the plot.
import matplotlib.pyplot as plt

x = [1, 2, 3, 4, 5]
y = [1, 4, 9, 16, 25]

plt.scatter(x, y, s=100, linewidth=2)
plt.show()
Output:
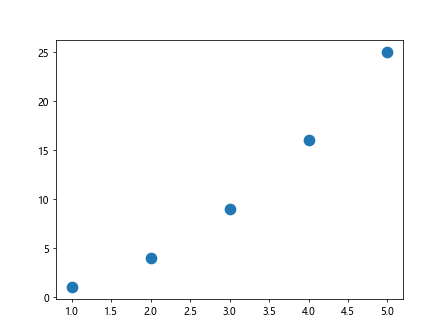
In this example, the markers in the scatter plot will have a linewidth of 2, making them more prominent.
Example: Bar Plot with Customized Border Line Width
Now, let’s create a bar plot with customized border linewidth to see how it changes the appearance of the bars.
import matplotlib.pyplot as plt

x = [1, 2, 3, 4, 5]
y = [1, 4, 9, 16, 25]

plt.bar(x, y, linewidth=2)
plt.show()
Output:
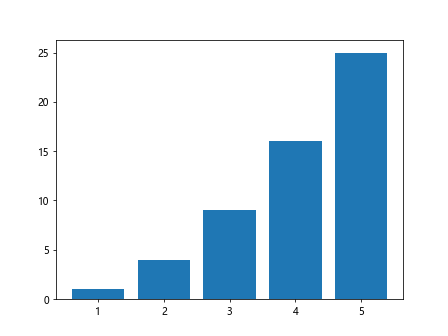
In this example, the borders of the bars in the plot will have a linewidth of 2, making them thicker than the default.
default linewidth matplotlib Conclusion
In conclusion, the default linewidth in Matplotlib can be customized to suit your preferences or the requirements of your project. By using the rcParams dictionary to set the default linewidth or the linewidth parameter in plot functions to change the linewidth for specific elements, you can control the thickness of lines, markers, and borders in your plots. Experiment with different linewidth values to create visually appealing and informative plots in Matplotlib.