Diverging Colormaps in Matplotlib
Diverging colormaps are useful when you want to highlight both high and low extremes in your data. These colormaps use two different colors at the extremes, with a neutral color in the middle. In this article, we will explore how to use diverging colormaps in Matplotlib.
Example 1: Creating a Diverging Colormap
import matplotlib.pyplot as plt
import numpy as np
from matplotlib.colors import LinearSegmentedColormap

cdict = {'red':   [[0.0, 1.0, 1.0],
                   [0.5, 1.0, 1.0],
                   [1.0, 0.0, 0.0]],

         'green': [[0.0, 0.0, 0.0],
                   [0.5, 1.0, 1.0],
                   [1.0, 0.0, 0.0]],

         'blue':  [[0.0, 0.0, 0.0],
                   [0.5, 0.0, 0.0],
                   [1.0, 1.0, 1.0]]}

diverging_map = LinearSegmentedColormap('DivergingMap', cdict)

# Now you can use this colormap in your plots
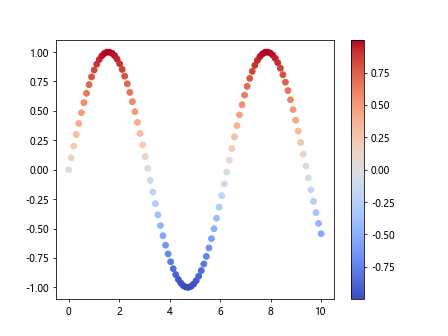
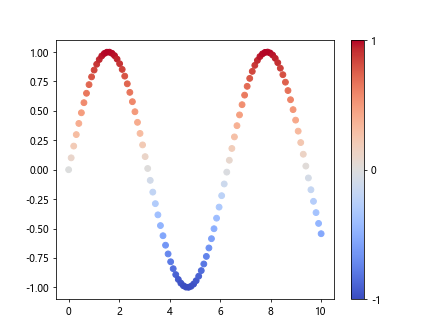
Example 2: Using a Built-in Diverging Colormap
import matplotlib.pyplot as plt
import numpy as np

x = np.linspace(0, 10, 100)
y = np.sin(x)

plt.scatter(x, y, c=y, cmap='coolwarm')
plt.colorbar()
plt.show()
Output:
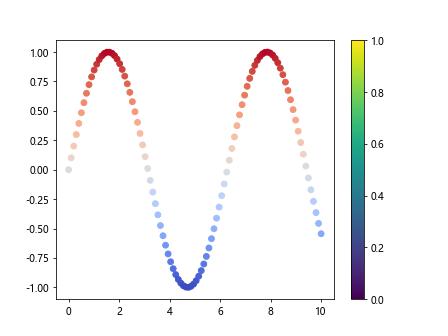
Example 3: Normalizing Colormap
import matplotlib.pyplot as plt
import numpy as np
from matplotlib.colors import Normalize
from matplotlib.cm import ScalarMappable

x = np.linspace(0, 10, 100)
y = np.sin(x)

norm = Normalize(vmin=-1, vmax=1)
cmap = plt.cm.coolwarm

sm = ScalarMappable(norm=norm, cmap=cmap)
colors = sm.to_rgba(y)

plt.scatter(x, y, c=colors)
plt.colorbar()
plt.show()
Output:
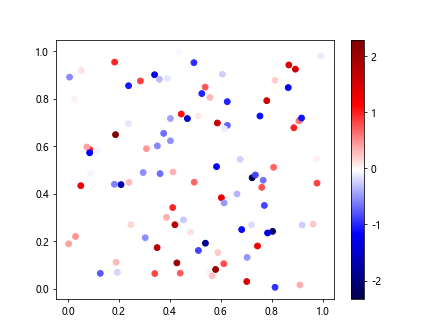
Example 4: Customizing Diverging Colormap
import matplotlib.pyplot as plt
import numpy as np

x = np.random.rand(100)
y = np.random.rand(100)
z = np.random.randn(100)

plt.scatter(x, y, c=z, cmap='seismic')
plt.colorbar()
plt.show()
Output:
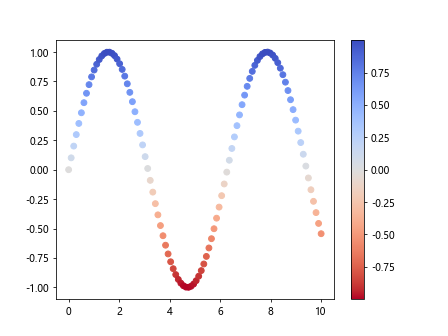
Example 5: Reversing Diverging Colormap
import matplotlib.pyplot as plt
import numpy as np

x = np.linspace(0, 10, 100)
y = np.sin(x)

plt.scatter(x, y, c=y, cmap='coolwarm_r')
plt.colorbar()
plt.show()
Output:
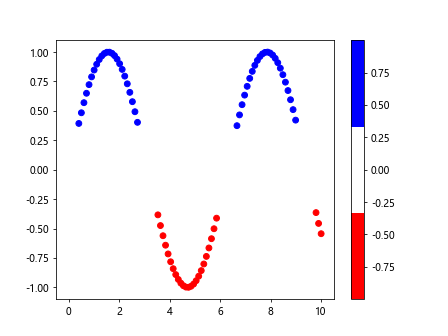
Example 6: Using ListedColormap
import matplotlib.pyplot as plt
import numpy as np
from matplotlib.colors import ListedColormap

colors = ['#FF0000', '#FFFFFF', '#0000FF']
cmap = ListedColormap(colors)

x = np.linspace(0, 10, 100)
y = np.sin(x)

plt.scatter(x, y, c=y, cmap=cmap)
plt.colorbar()
plt.show()
Output:
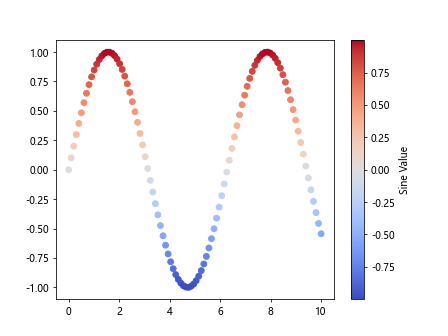
Example 7: Creating a Diverging Colorbar
import matplotlib.pyplot as plt
import numpy as np

x = np.linspace(0, 10, 100)
y = np.sin(x)

plt.scatter(x, y, c=y, cmap='coolwarm')
cbar = plt.colorbar()
cbar.set_label('Sine Value')
plt.show()
Output:
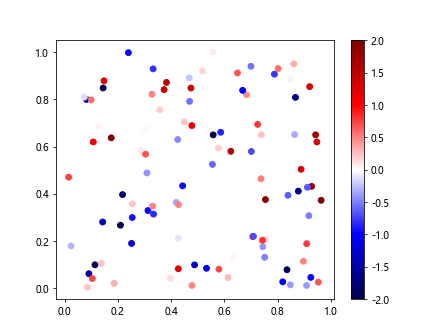
Example 8: Using Symmetric Range
import matplotlib.pyplot as plt
import numpy as np

x = np.random.rand(100)
y = np.random.rand(100)
z = np.random.randn(100)

plt.scatter(x, y, c=z, cmap='seismic', vmin=-2, vmax=2)
plt.colorbar()
plt.show()
Output:
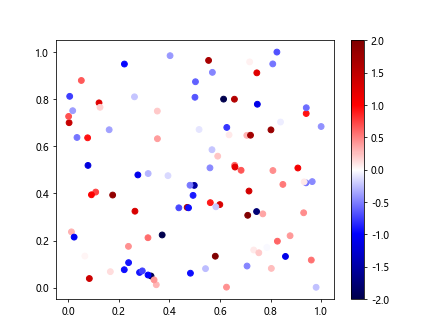
Example 9: Handling Out-of-Bounds Values
import matplotlib.pyplot as plt
import numpy as np

x = np.random.rand(100)
y = np.random.rand(100)
z = np.random.randn(100)
z[0] = -5  # Adding out-of-bounds value

plt.scatter(x, y, c=z, cmap='seismic', vmin=-2, vmax=2)
plt.colorbar()
plt.show()
Output:
Example 10: Colorbar Format
import matplotlib.pyplot as plt
import numpy as np

x = np.linspace(0, 10, 100)
y = np.sin(x)

plt.scatter(x, y, c=y, cmap='coolwarm')
cbar = plt.colorbar()
cbar.set_ticks([-1, 0, 1])
plt.show()
Output:
diverging colormaps matplotlib Conclusion
Diverging colormaps are a useful tool in data visualization, especially when you want to highlight both high and low extremes. In Matplotlib, there are many ways to create and customize diverging colormaps to suit your needs. Experiment with different colormaps and settings to find the best representation for your data.