errorbar capsize
In data visualization using matplotlib, error bars are a common way to represent the uncertainty or variability in data. Error bars can be added to a line plot, scatter plot, or bar plot to visually represent the range of values in the data.
One important parameter when using error bars with matplotlib’s errorbar function is capsize. This parameter determines the size of the caps at the end of each error bar. In this article, we will explore how to customize the capsize of error bars in matplotlib.
Setting the capsize of error bars in a simple line plot
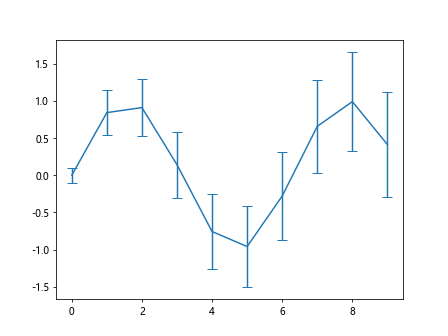
In this example, we will create a simple line plot with error bars and customize the capsize parameter.
import matplotlib.pyplot as plt
import numpy as np

# Data
x = np.arange(0, 10, 1)
y = np.sin(x)
error = 0.1 + 0.2 * np.sqrt(x)

# Plot with error bars
plt.errorbar(x, y, yerr=error, capsize=5)
plt.show()
Output:
Changing the capsize of error bars in a scatter plot
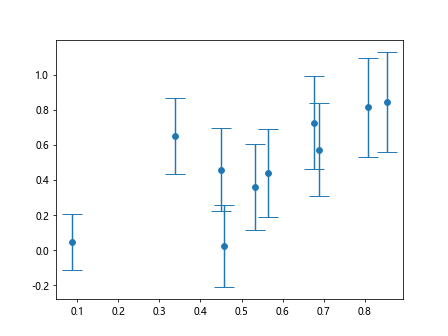
In this example, we will create a scatter plot with error bars and modify the capsize parameter to a different value.
import matplotlib.pyplot as plt
import numpy as np

# Data
x = np.random.rand(10)
y = np.random.rand(10)
error = 0.1 + 0.2 * np.sqrt(x)

# Scatter plot with error bars
plt.errorbar(x, y, yerr=error, fmt='o', capsize=10)
plt.show()
Output:
Customizing error bar capsize in a bar plot
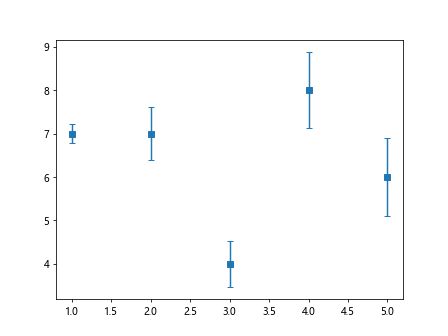
In this example, we will create a bar plot with error bars and adjust the capsize parameter for a different visual effect.
import matplotlib.pyplot as plt
import numpy as np

# Data
x = np.arange(1, 6)
y = np.random.randint(1, 10, size=5)
error = np.random.rand(5)

# Bar plot with error bars
plt.errorbar(x, y, yerr=error, fmt='s', capsize=3)
plt.show()
Output:
Adjusting the capsize of horizontal error bars
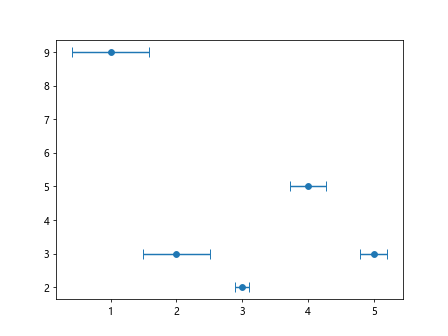
In some cases, you may need to plot horizontal error bars instead of vertical error bars. You can also customize the capsize parameter for horizontal error bars.
import matplotlib.pyplot as plt
import numpy as np

# Data
x = np.arange(1, 6)
y = np.random.randint(1, 10, size=5)
error = np.random.rand(5)

# Horizontal error bars with custom capsize
plt.errorbar(x, y, xerr=error, fmt='o', capsize=5)
plt.show()
Output:
Using different capsize values with multiple error bars
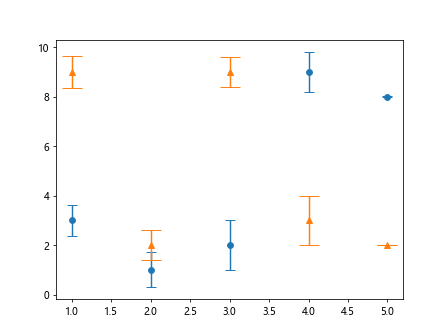
You can also create a plot with multiple error bars and apply different capsize values to each set of error bars.
import matplotlib.pyplot as plt
import numpy as np

# Data
x = np.arange(1, 6)
y1 = np.random.randint(1, 10, size=5)
y2 = np.random.randint(1, 10, size=5)
error1 = np.random.rand(5)
error2 = np.random.rand(5)

# Plot with multiple error bars and different capsize values
plt.errorbar(x, y1, yerr=error1, fmt='o', capsize=5)
plt.errorbar(x, y2, yerr=error2, fmt='^', capsize=10)
plt.show()
Output:
Combining error bars with different capsize values
You can also combine error bars with different capsize values in the same plot to highlight the variability in the data.
import matplotlib.pyplot as plt
import numpy as np

# Data
x = np.arange(1, 6)
y = np.random.randint(1, 10, size=5)
error1 = np.random.rand(5)
error2 = np.random.rand(5)

# Plot with error bars and different capsize values
plt.errorbar(x, y, yerr=[error1, error2], fmt='o', capsize=[3, 7])
plt.show()
Adjusting capsize in log scale plots
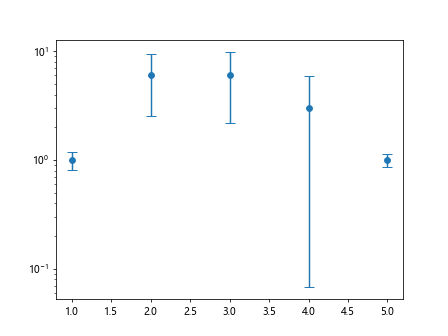
If you are working with log scale plots, you may need to adjust the capsize parameter to ensure the error bars are appropriately sized.
import matplotlib.pyplot as plt
import numpy as np

# Data
x = np.arange(1, 6)
y = np.random.randint(1, 10, size=5)
error = np.random.rand(5) * y

# Log scale plot with custom capsize
plt.errorbar(x, y, yerr=error, fmt='o', capsize=5)
plt.yscale('log')
plt.show()
Output:
Setting the capsize color and style
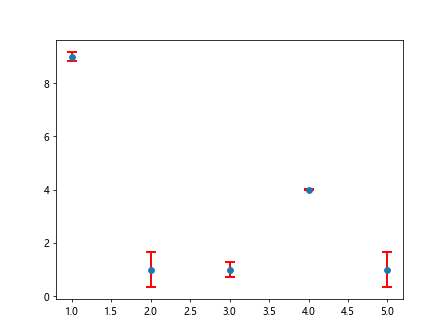
You can also customize the color and style of the error bar caps by specifying the capsize parameter with additional styling options.
import matplotlib.pyplot as plt
import numpy as np

# Data
x = np.arange(1, 6)
y = np.random.randint(1, 10, size=5)
error = np.random.rand(5)

# Plot with error bars and custom capsize color and style
plt.errorbar(x, y, yerr=error, fmt='o', capsize=5, ecolor='red', elinewidth=2, capthick=2)
plt.show()
Output:
Using different capsize sizes with different plot styles
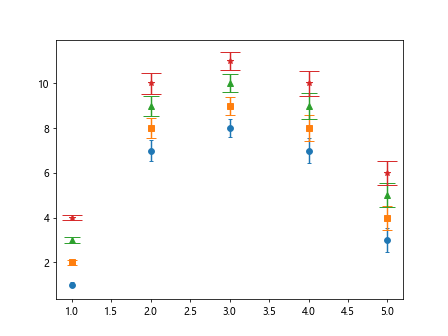
You can experiment with different capsize sizes and plot styles to create visually appealing and informative data visualizations.
import matplotlib.pyplot as plt
import numpy as np

# Data
x = np.arange(1, 6)
y = np.random.randint(1, 10, size=5)
error = np.random.rand(5)

# Plot with error bars, different capsize sizes, and plot styles
plt.errorbar(x, y, yerr=error, fmt='o', capsize=2)
plt.errorbar(x, y+1, yerr=error, fmt='s', capsize=5)
plt.errorbar(x, y+2, yerr=error, fmt='^', capsize=8)
plt.errorbar(x, y+3, yerr=error, fmt='*', capsize=10)
plt.show()
Output:
errorbar capsize Conclusion
In this article, we have explored how to customize the capsize of error bars in matplotlib plots. By adjusting the capsize parameter, you can control the size of the caps at the end of each error bar, allowing you to create clearer and more informative data visualizations. Experiment with different capsize values, colors, and styles to find the best representation for your data.