Errorbar Linestyle
In Matplotlib, error bars are used to visually represent the uncertainty or variability of data in plots. The
errorbar function allows us to add error bars to a plot, indicating the spread or uncertainty of the data points. One customizable parameter for error bars in Matplotlib is the linestyle. In this article, we will explore how to customize the linestyle of error bars in Matplotlib.
Setting Errorbar Linestyle
The
errorbar function in Matplotlib has a linestyle parameter that allows us to customize the linestyle of the error bars. The linestyle parameter accepts various values to specify the style of the error bars. Let’s see some examples of how to set the linestyle for error bars in Matplotlib.
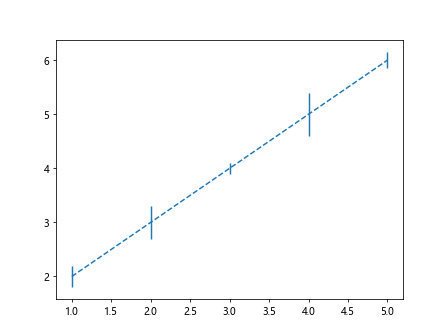
Example 1: Dashed Line
import matplotlib.pyplot as plt

x = [1, 2, 3, 4, 5]
y = [2, 3, 4, 5, 6]
errors = [0.2, 0.3, 0.1, 0.4, 0.15]

plt.errorbar(x, y, yerr=errors, linestyle='dashed')
plt.show()
Output:
Example 2: Dotted Line
import matplotlib.pyplot as plt

x = [1, 2, 3, 4, 5]
y = [2, 3, 4, 5, 6]
errors = [0.2, 0.3, 0.1, 0.4, 0.15]

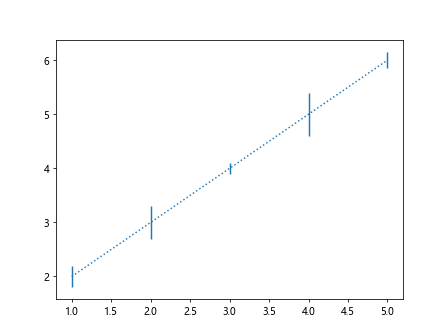
plt.errorbar(x, y, yerr=errors, linestyle='dotted')
plt.show()
Output:
Example 3: Dash-dot Line
import matplotlib.pyplot as plt

x = [1, 2, 3, 4, 5]
y = [2, 3, 4, 5, 6]
errors = [0.2, 0.3, 0.1, 0.4, 0.15]

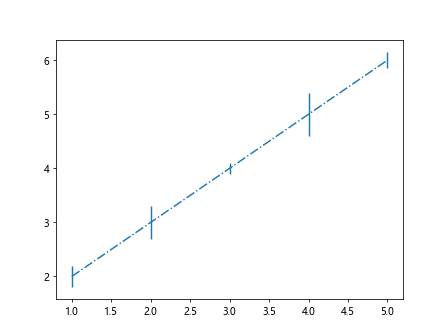
plt.errorbar(x, y, yerr=errors, linestyle='dashdot')
plt.show()
Output:
Customizing Errorbar Linestyle
In addition to specifying the basic linestyle of error bars, we can further customize the linestyle by adjusting the line width, color, and transparency. Let’s see some examples of how to customize the errorbar linestyle in Matplotlib.
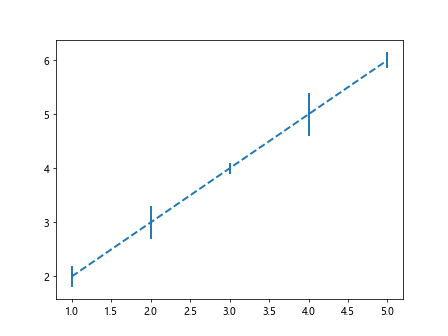
Example 4: Custom Line Width
import matplotlib.pyplot as plt

x = [1, 2, 3, 4, 5]
y = [2, 3, 4, 5, 6]
errors = [0.2, 0.3, 0.1, 0.4, 0.15]

plt.errorbar(x, y, yerr=errors, linestyle='dashed', linewidth=2)
plt.show()
Output:
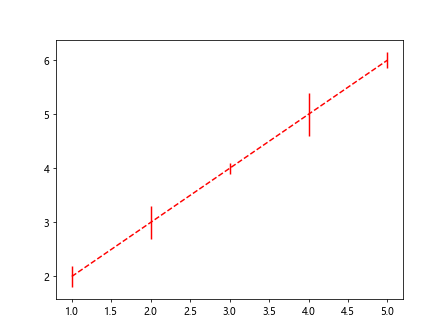
Example 5: Custom Line Color
import matplotlib.pyplot as plt

x = [1, 2, 3, 4, 5]
y = [2, 3, 4, 5, 6]
errors = [0.2, 0.3, 0.1, 0.4, 0.15]

plt.errorbar(x, y, yerr=errors, linestyle='dashed', color='red')
plt.show()
Output:
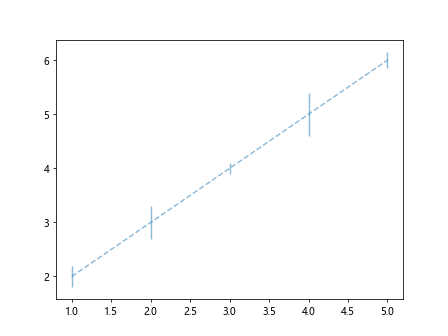
Example 6: Custom Line Transparency
import matplotlib.pyplot as plt

x = [1, 2, 3, 4, 5]
y = [2, 3, 4, 5, 6]
errors = [0.2, 0.3, 0.1, 0.4, 0.15]

plt.errorbar(x, y, yerr=errors, linestyle='dashed', alpha=0.5)
plt.show()
Output:
Multiple Errorbar Linestyles
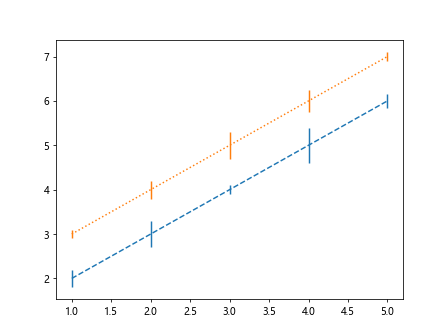
Sometimes, we may want to use different linestyles for different error bars in the same plot. Matplotlib allows us to achieve this by specifying a list of linestyles for the error bars. Let’s see an example of how to use multiple errorbar linestyles in Matplotlib.
Example 7: Multiple Linestyles
import matplotlib.pyplot as plt

x = [1, 2, 3, 4, 5]
y1 = [2, 3, 4, 5, 6]
errors1 = [0.2, 0.3, 0.1, 0.4, 0.15]

y2 = [3, 4, 5, 6, 7]
errors2 = [0.1, 0.2, 0.3, 0.25, 0.1]

plt.errorbar(x, y1, yerr=errors1, linestyle='dashed')
plt.errorbar(x, y2, yerr=errors2, linestyle='dotted')
plt.show()
Output:
Combined Errorbar Linestyle
In some cases, we may want to combine multiple linestyles for error bars to achieve a specific visual effect in the plot. Matplotlib allows us to customize the error bars by combining different linestyles. Let’s see an example of how to create combined errorbar linestyles in Matplotlib.
Example 8: Combined Linestyles
import matplotlib.pyplot as plt

x = [1, 2, 3, 4, 5]
y = [2, 3, 4, 5, 6]
errors = [0.2, 0.3, 0.1, 0.4, 0.15]

plt.errorbar(x, y, yerr=errors, linestyle='dashed,dotted')
plt.show()
Errorbar Linestyle Conclusion
In this article, we have explored how to customize the linestyle of error bars in Matplotlib. By adjusting the linestyle, line width, color, and transparency, we can create visually appealing plots with error bars that effectively represent the uncertainty or variability of the data. Experiment with different linestyles and customizations to enhance the quality of your plots.