Colorbar Max Min in Matplotlib
Matplotlib is a popular Python library for creating static, animated, and interactive visualizations in Python. One common element in visualizations is the colorbar, which shows the mapping of data values to colors in a plot. In this article, we will explore how to set the maximum and minimum values of a colorbar in Matplotlib.
Setting Colorbar Max and Min Values
Example 1: Setting Colorbar Max and Min Values
import matplotlib.pyplot as plt
import numpy as np

# Create a random data array
data = np.random.rand(10, 10)

# Plot the data with a colorbar
plt.imshow(data, cmap='viridis')
plt.colorbar()

# Set the colorbar maximum and minimum values
plt.clim(0.2, 0.8)

plt.show()
Output:
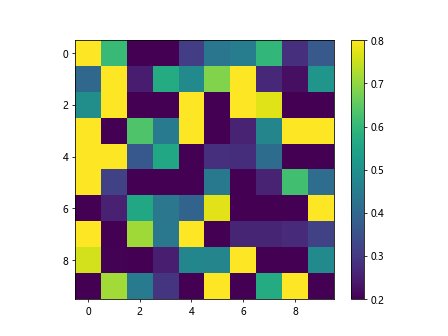
In this example, we generate a random 10×10 array of data and plot it using the imshow function with the ‘viridis’ colormap. We then add a colorbar and set the maximum and minimum values of the colorbar using the clim function.
Example 2: Setting Colorbar Range
import matplotlib.pyplot as plt
import numpy as np
import matplotlib.colors as mcolors

# Create a random data array
data = np.random.rand(10, 10)

# Plot the data with a colorbar
plt.imshow(data, cmap='viridis')
plt.colorbar()

# Set the colorbar range
norm = mcolors.Normalize(vmin=0.3, vmax=0.7)
plt.colorbar(plt.cm.ScalarMappable(norm=norm, cmap='viridis'))

plt.show()
In this example, we create a normalized colormap using the Normalize function from matplotlib.colors module. We then pass the normalized colormap to the ScalarMappable function and set the colorbar range by specifying the minimum and maximum values.
Example 3: Discrete Colorbar with Bounds
import matplotlib.pyplot as plt
import numpy as np
import matplotlib.colors as mcolors

# Create a random data array
data = np.random.randint(1, 10, size=(10, 10))

# Plot the data with a colorbar
plt.imshow(data, cmap='viridis')
plt.colorbar()

# Set colorbar bounds
bounds = [1, 3, 5, 7, 9]
norm = mcolors.BoundaryNorm(bounds, len(bounds))
plt.colorbar(plt.cm.ScalarMappable(norm=norm, cmap='viridis'))

plt.show()
In this example, we create a discrete colormap using the BoundaryNorm function from matplotlib.colors module. We specify the boundaries for the data values and pass them to the ScalarMappable function to create a discrete colorbar.
Using Colorbar Max and Min in Subplots
Example 4: Colorbar Max and Min in Subplots
import matplotlib.pyplot as plt
import numpy as np

# Create random data arrays
data1 = np.random.rand(10, 10)
data2 = np.random.rand(10, 10)

# Plot the data in subplots with colorbars
fig, axs = plt.subplots(1, 2, figsize=(10, 5))

im1 = axs[0].imshow(data1, cmap='viridis')
plt.colorbar(im1, ax=axs[0])
axs[0].set_title('Plot 1')

im2 = axs[1].imshow(data2, cmap='viridis')
plt.colorbar(im2, ax=axs[1])
axs[1].set_title('Plot 2')

# Set colorbar maximum and minimum values for each subplot
axs[0].clim(0.3, 0.7)
axs[1].clim(0.2, 0.8)

plt.show()
In this example, we create two random 10×10 data arrays and plot them in subplots using the plt.subplots function. We add colorbars to each subplot and set the maximum and minimum values of the colorbars for each subplot individually using the clim function.
Example 5: Using Shared Colorbar for Subplots
import matplotlib.pyplot as plt
import numpy as np

# Create random data arrays
data1 = np.random.rand(10, 10)
data2 = np.random.rand(10, 10)

# Plot the data in subplots with a shared colorbar
fig, axs = plt.subplots(1, 2, figsize=(10, 5))

im1 = axs[0].imshow(data1, cmap='viridis')
im2 = axs[1].imshow(data2, cmap='viridis')

# Share colorbar between subplots
cbar = plt.colorbar(im2, ax=axs.ravel().tolist())
cbar.set_label('Colorbar')

# Set colorbar maximum and minimum values for all subplots
cbar.set_clim(0.3, 0.7)

plt.show()
In this example, we create two random 10×10 data arrays and plot them in subplots using the plt.subplots function. We share a single colorbar between the subplots using the plt.colorbar function with the ax argument. We then set the maximum and minimum values of the colorbar for all subplots using the set_clim function.
Customizing Colorbar Tick Labels
Example 6: Customizing Colorbar Tick Labels
import matplotlib.pyplot as plt
import numpy as np

# Create a random data array
data = np.random.rand(10, 10)

# Plot the data with a colorbar
plt.imshow(data, cmap='viridis')
cbar = plt.colorbar()

# Customize colorbar tick labels
cbar.set_ticks([0.2, 0.4, 0.6, 0.8])
cbar.set_ticklabels(['Low', 'Medium', 'High', 'Very High'])

plt.show()
Output:
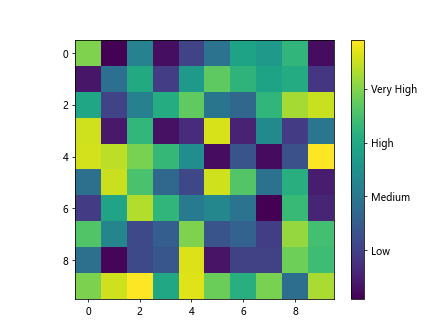
In this example, we generate a random 10×10 array of data and plot it using the imshow function with the ‘viridis’ colormap. We then add a colorbar and customize the tick labels using the set_ticks and set_ticklabels functions.
Example 7: Custom Colorbar Tick Labels
import matplotlib.pyplot as plt
import numpy as np

# Create a random data array
data = np.random.rand(10, 10)

# Plot the data with a colorbar
plt.imshow(data, cmap='viridis')
cbar = plt.colorbar()

# Custom colorbar tick labels
cbar.set_ticks([0.1, 0.3, 0.5, 0.7, 0.9])
cbar.set_ticklabels(['Min', 'Low', 'Medium', 'High', 'Max'])

plt.show()
Output:
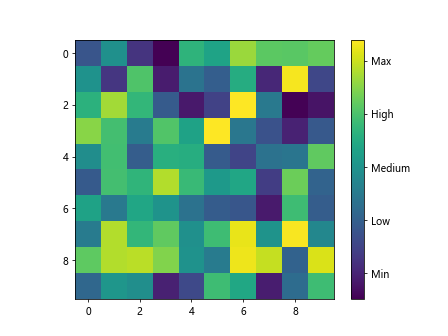
In this example, we create a random 10×10 array of data and plot it with a colorbar displaying the ‘viridis’ colormap. We customize the colorbar tick labels by specifying the tick locations and their corresponding labels using the set_ticks and set_ticklabels functions.
Adjusting Colorbar Placement
Example 8: Adjusting Colorbar Position
import matplotlib.pyplot as plt
import numpy as np

# Create a random data array
data = np.random.rand(10, 10)

# Plot the data with a colorbar
plt.imshow(data, cmap='viridis')
cbar = plt.colorbar()
cbar.set_label('Data Values')

# Adjust colorbar position
cbar.ax.set_position([0.8, 0.1, 0.03, 0.8])

plt.show()
Output:
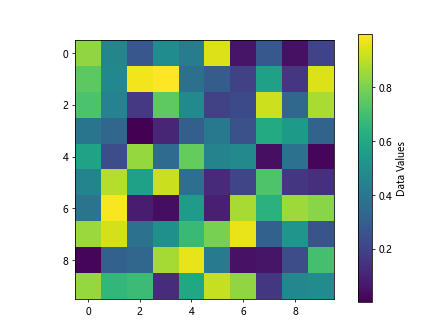
In this example, we generate a random 10×10 array of data and plot it using the imshow function with the ‘viridis’ colormap. We then add a colorbar and adjust its position within the plot by setting the position of the colorbar axes using the set_position function.
Example 9: Colorbar Orientation
import matplotlib.pyplot as plt
import numpy as np

# Create a random data array
data = np.random.rand(10, 10)

# Plot the data with a horizontal colorbar
plt.imshow(data, cmap='viridis')
cbar = plt.colorbar(orientation='horizontal')
cbar.set_label('Data Values')

plt.show()
Output:
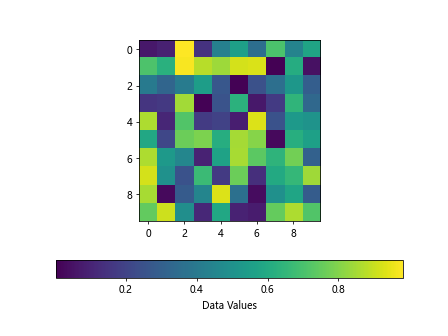
In this example, we create a random 10×10 array of data and plot it with a horizontal colorbar usingthe ‘viridis’ colormap. We set the colorbar orientation to horizontal by passing the orientation='horizontal' argument to the plt.colorbar function.
Formatting Colorbar Labels
Example 10: Formatting Colorbar Labels
import matplotlib.pyplot as plt
import numpy as np

# Create a random data array
data = np.random.rand(10, 10)

# Plot the data with a colorbar
plt.imshow(data, cmap='viridis')
cbar = plt.colorbar()
cbar.set_label('Data Values')

# Format colorbar labels
cbar.formatter.set_powerlimits((0, 0))
cbar.update_ticks()

plt.show()
Output:
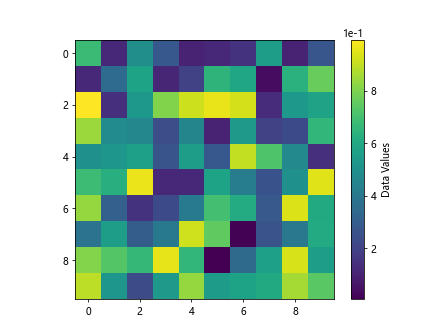
In this example, we generate a random 10×10 array of data and plot it using the imshow function with the ‘viridis’ colormap. We add a colorbar and format the colorbar labels using the formatter.set_powerlimits function to control the power limits of the colorbar labels.
Example 11: Formatting Scientific Notation
import matplotlib.pyplot as plt
import numpy as np

# Create a random data array
data = np.random.rand(10, 10)

# Plot the data with a colorbar
plt.imshow(data, cmap='viridis')
cbar = plt.colorbar()
cbar.set_label('Data Values')

# Format colorbar labels in scientific notation
cbar.formatter.set_scientific(True)
cbar.formatter.set_powerlimits((-2, 2))
cbar.update_ticks()

plt.show()
Output:
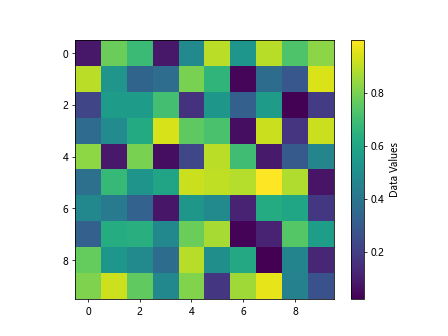
In this example, we generate a random 10×10 array of data and plot it with a colorbar displaying the ‘viridis’ colormap. We format the colorbar labels to show values in scientific notation by setting set_scientific(True) and specifying the power limits for the scientific notation using set_powerlimits.
colorbar max min matplotlib Conclusion
In this article, we explored how to set the maximum and minimum values of a colorbar in Matplotlib. We learned how to customize colorbar tick labels, adjust colorbar position, and format colorbar labels to suit our visualization needs. By understanding these techniques, we can enhance the visual representation of our data in Matplotlib plots. Colorbars play a crucial role in conveying information through colors in our visualizations, and knowing how to manipulate and customize colorbars can significantly improve the clarity and effectiveness of our plots.