Colorbar Min Max
When working with data visualization, colorbars play an important role in representing the range of data values. In this article, we will explore how to set the min and max values for a colorbar in matplotlib.
Setting Min and Max Values for Colorbar
Example 1: Set Min and Max Values for Colorbar
import matplotlib.pyplot as plt
import numpy as np

data = np.random.rand(10, 10)
plt.imshow(data, cmap='viridis')
cbar = plt.colorbar()
cbar.set_clim(0, 1)
plt.show()
Example 2: Set Automatic Min and Max Values for Colorbar
import matplotlib.pyplot as plt
import numpy as np

data = np.random.rand(10, 10)
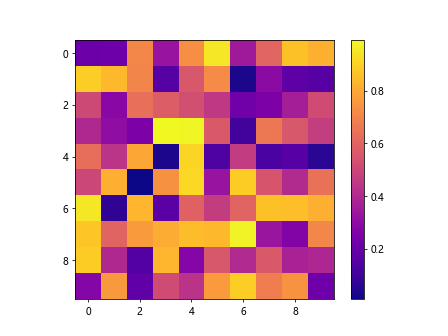
plt.imshow(data, cmap='plasma')
plt.colorbar()
plt.show()
Output:
Controlling Colorbar Limits
Example 3: Limit Colorbar Range
import matplotlib.pyplot as plt
import numpy as np

data = np.random.randn(10, 10)
plt.imshow(data, cmap='cividis')
cbar = plt.colorbar()
cbar.set_clim(-2, 2)
plt.show()
Example 4: Adjust Colorbar Range Automatically
import matplotlib.pyplot as plt
import numpy as np

data = np.random.randn(10, 10)
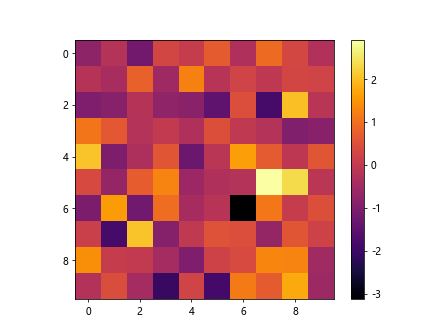
plt.imshow(data, cmap='inferno')
plt.colorbar()
plt.show()
Output:
Setting Colorbar Ticks
Example 5: Setting Colorbar Ticks
import matplotlib.pyplot as plt
import numpy as np

data = np.random.randn(10, 10)
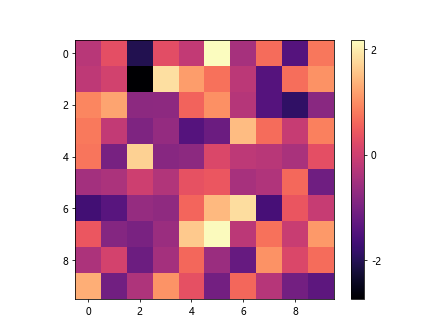
plt.imshow(data, cmap='magma')
cbar = plt.colorbar()
cbar.set_ticks([-2, 0, 2])
plt.show()
Output:
Example 6: Setting Colorbar Tick Labels
import matplotlib.pyplot as plt
import numpy as np

data = np.random.randn(10, 10)
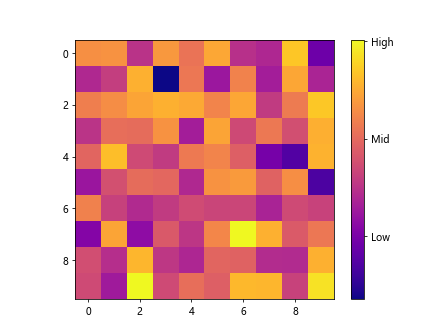
plt.imshow(data, cmap='plasma')
cbar = plt.colorbar()
cbar.set_ticks([-2, 0, 2])
cbar.set_ticklabels(['Low', 'Mid', 'High'])
plt.show()
Output:
Adjusting Colorbar Formatting
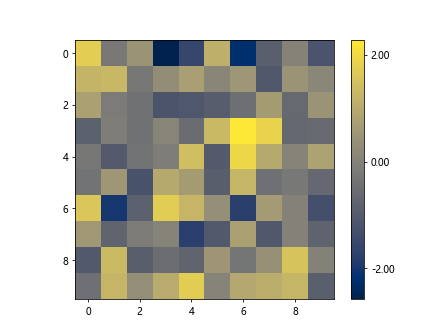
Example 7: Format Colorbar Tick Labels
import matplotlib.pyplot as plt
import numpy as np

data = np.random.randn(10, 10)
plt.imshow(data, cmap='cividis')
cbar = plt.colorbar()
cbar.set_ticks([-2, 0, 2])
cbar.set_ticklabels(['{:.2f}'.format(i) for i in [-2, 0, 2]])
plt.show()
Output:
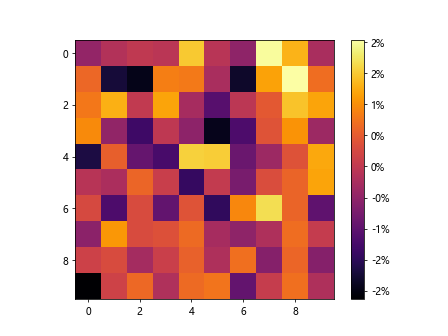
Example 8: Format Colorbar Tick Labels as Percentage
import matplotlib.pyplot as plt
import numpy as np

data = np.random.randn(10, 10)
plt.imshow(data, cmap='inferno')
cbar = plt.colorbar(format='%.0f%%')
plt.show()
Output:
Customizing Colorbar Appearance
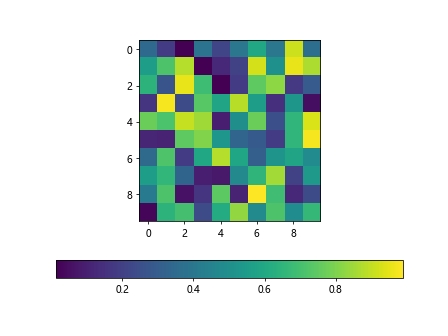
Example 9: Set Colorbar Orientation
import matplotlib.pyplot as plt
import numpy as np

data = np.random.rand(10, 10)
plt.imshow(data, cmap='viridis')
cbar = plt.colorbar(orientation='horizontal')
plt.show()
Output:
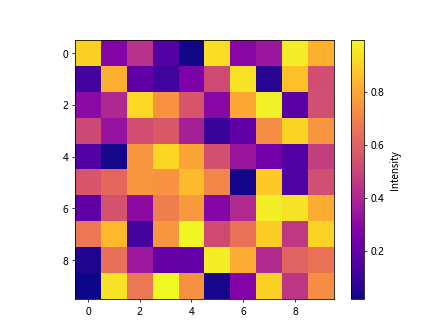
Example 10: Set Colorbar Title
import matplotlib.pyplot as plt
import numpy as np

data = np.random.rand(10, 10)
plt.imshow(data, cmap='plasma')
cbar = plt.colorbar()
cbar.set_label('Intensity')
plt.show()
Output:
Colorbar Min Max Conclusion
In this article, we have explored how to set the min and max values for a colorbar in matplotlib. By understanding how to control colorbar limits, set colorbar ticks, adjust formatting, and customize appearance, you can create more effective and visually appealing visualizations. Experiment with the examples provided to further enhance your data visualization skills.