Colorbar Limit in Matplotlib
In matplotlib, colorbars are used to represent the mapping from scalar values to colors in a plot. Sometimes, we may want to set the limits of the colorbar to emphasize certain data ranges or to improve the clarity of the plot. In this article, we will explore how to set the colorbar limit in matplotlib using various examples.
Example 1: Setting Colorbar Limit in a Scatter Plot
import matplotlib.pyplot as plt
import numpy as np

x = np.random.rand(100)
y = np.random.rand(100)
colors = np.random.rand(100)

plt.scatter(x, y, c=colors, cmap='viridis')
plt.colorbar()
plt.clim(0.2, 0.8)  # Set colorbar limit
plt.show()
Output:

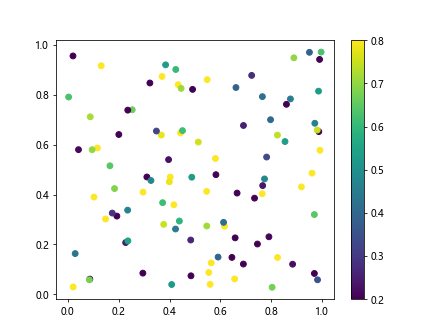
In this example, we create a scatter plot with random data points and colors. By using the plt.clim() function, we can set the limit of the colorbar to highlight specific data values.
Example 2: Colorbar Limit in a Contour Plot
import matplotlib.pyplot as plt
import numpy as np

x = np.linspace(-2, 2, 100)
y = np.linspace(-2, 2, 100)
X, Y = np.meshgrid(x, y)
Z = np.sin(X) * np.cos(Y)

plt.contourf(X, Y, Z, cmap='coolwarm')
plt.colorbar()
plt.clim(-0.5, 0.5)  # Set colorbar limit
plt.show()
Output:

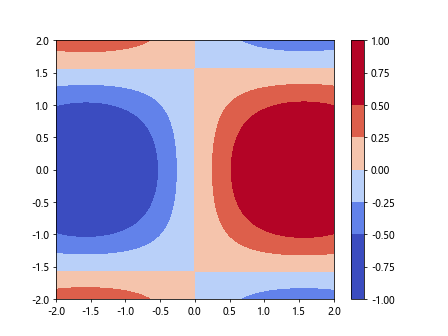
In this example, we generate a contour plot of the sine and cosine functions. By setting the colorbar limit with plt.clim(), we can focus on the values within a specific range.
Example 3: Colorbar Limit for a 3D Plot
import matplotlib.pyplot as plt
import numpy as np
from mpl_toolkits.mplot3d import Axes3D

x = np.linspace(-5, 5, 100)
y = np.linspace(-5, 5, 100)
X, Y = np.meshgrid(x, y)
Z = np.sin(np.sqrt(X**2 + Y**2))

fig = plt.figure()
ax = fig.add_subplot(111, projection='3d')
surf = ax.plot_surface(X, Y, Z, cmap='plasma')
fig.colorbar(surf, shrink=0.5, aspect=5)
plt.clim(0, 0.5)  # Set colorbar limit
plt.show()
This example demonstrates setting the colorbar limit for a 3D plot. By specifying the range of values using plt.clim(), we can adjust the appearance of the colorbar to suit our needs.
Example 4: Custom Colorbar Ticks
import matplotlib.pyplot as plt
import numpy as np

x = np.linspace(0, 10, 100)
y = np.sin(x)

plt.plot(x, y, c='magenta')
cbar = plt.colorbar()
cbar.set_ticks([0, 0.5, 1])  # Define custom colorbar ticks
plt.show()
In this example, we create a custom colorbar with specific tick locations using the cbar.set_ticks() function. This allows us to control the placement of ticks on the colorbar.
Example 5: Discrete Colorbar Levels
import matplotlib.pyplot as plt
import numpy as np

x = np.linspace(0, 10, 100)
y = np.sin(x)

plt.plot(x, y, c='cyan')
cbar = plt.colorbar()
cbar.set_ticks(np.linspace(0, 1, 5))  # Define discrete colorbar levels
plt.show()
By using np.linspace() to specify discrete colorbar levels, we can create a colorbar with evenly spaced ticks at specific values.
Example 6: Symmetrical Colorbar Limits
import matplotlib.pyplot as plt
import numpy as np

x = np.linspace(-10, 10, 100)
y = np.tanh(x)

plt.plot(x, y, c='orange')
cbar = plt.colorbar()
cbar.set_clim(-1, 1)  # Set symmetrical colorbar limits
plt.show()
By setting symmetrical colorbar limits with cbar.set_clim(), we can ensure that the colorbar represents the values symmetrically around zero.
Example 7: Adjusting Colorbar Orientation
import matplotlib.pyplot as plt
import numpy as np

x = np.linspace(0, 10, 100)
y = np.cos(x)

plt.plot(x, y, c='lime')
cbar = plt.colorbar(orientation='horizontal')  # Adjust colorbar orientation
plt.show()
In this example, we change the orientation of the colorbar to horizontal by specifying orientation='horizontal'. This allows us to display the colorbar below the plot.
Example 8: Changing Colorbar Font Size
import matplotlib.pyplot as plt
import numpy as np

x = np.linspace(0, 10, 100)
y = np.exp(x)

plt.plot(x, y, c='yellow')
cbar = plt.colorbar()
cbar.ax.tick_params(labelsize=8)  # Change colorbar font size
plt.show()
By adjusting the font size of the colorbar labels using cbar.ax.tick_params(labelsize=8), we can make the colorbar text more readable.
Example 9: Colorbar Limit with Logarithmic Scale
import matplotlib.pyplot as plt
import numpy as np

x = np.linspace(1, 10, 100)
y = np.log(x)

plt.plot(x, y, c='red')
cbar = plt.colorbar()
cbar.set_clim(0, 2)  # Set colorbar limit with logarithmic scale
plt.yscale('log')
plt.show()
In this example, we set the colorbar limit with a logarithmic scale by using plt.yscale('log'). This allows us to emphasize specific data ranges on a log scale.
Example 10: Colorbar Limit for Multiple Subplots
import matplotlib.pyplot as plt
import numpy as np

x = np.linspace(0, 10, 100)
y1 = np.sin(x)
y2 = np.cos(x)

fig, axs = plt.subplots(2)
fig.subplots_adjust(hspace=0.5)

axs[0].plot(x, y1, c='blue')
cbar1 = plt.colorbar(ax=axs[0])
cbar1.set_clim(-1, 1)

axs[1].plot(x, y2, c='green')
cbar2 = plt.colorbar(ax=axs[1])
cbar2.set_clim(-1, 1)

plt.show()
By creating multiple subplots and setting colorbar limits individually for each subplot, we can compare different datasets within the same plot while emphasizing specific data ranges.
colorbar limit matplotlib Conclusion
In this article, we have explored various examples of setting colorbar limits in matplotlib to enhance the visual representation of data in plots. By adjusting colorbar limits, ticks, levels, orientation, font size, and scale, we can customize the appearance of colorbars to effectively communicate the information in our plots. Experiment with the provided examples to discover the versatility of colorbar limits in matplotlib.