Clear Axes in Matplotlib
Matplotlib is a popular data visualization library in Python that allows users to create a wide range of plots and charts. When working with plots, it is often necessary to clear the axes to update the plot or create a new one. In this article, we will explore different ways to clear and reset axes in Matplotlib.
1. Clearing the Axes
The clear() method can be used to clear the current axes in Matplotlib. This method removes all the plotted data and resets the axes for a new plot. Here’s an example:
import matplotlib.pyplot as plt

# Plotting a simple line graph
plt.plot([1, 2, 3, 4], [1, 4, 9, 16])

# Clearing the axes
plt.gca().clear()

plt.show()
Output:
2. Removing all Artists
Another way to clear the axes is by removing all the artists (lines, patches, etc.) from the figure. This can be achieved using the clf() method. Here’s an example:
import matplotlib.pyplot as plt

# Plotting a simple scatter plot
plt.scatter([1, 2, 3, 4], [1, 4, 9, 16])

# Removing all artists from the figure
plt.clf()

plt.show()
Output:

3. Clearing Specific Axes
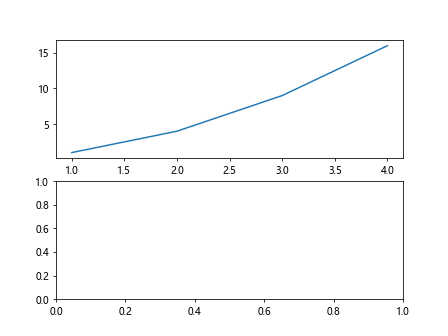
If you have multiple subplots in a figure and want to clear a specific axes, you can use the clear() method on that specific axes object. Here’s an example:
import matplotlib.pyplot as plt

# Creating multiple subplots
fig, axs = plt.subplots(2)
ax1, ax2 = axs

# Plotting data on the first subplot
ax1.plot([1, 2, 3, 4], [1, 4, 9, 16])

# Clearing the second subplot
ax2.clear()

plt.show()
Output:
4. Clearing Multiple Axes
To clear multiple axes at once, you can iterate over all the axes objects in the figure and clear each one individually. Here’s an example:
import matplotlib.pyplot as plt

# Creating multiple subplots
fig, axs = plt.subplots(2)
ax1, ax2 = axs

# Plotting data on both subplots
ax1.plot([1, 2, 3, 4], [1, 4, 9, 16])
ax2.scatter([1, 2, 3, 4], [1, 4, 9, 16])

# Clearing both subplots
for ax in axs:
    ax.clear()

plt.show()
Output:
5. Clearing Specific Artists
If you want to clear specific artists from the axes, you can remove them individually using the remove() method. Here’s an example:
import matplotlib.pyplot as plt

# Plotting a line graph
line = plt.plot([1, 2, 3, 4], [1, 4, 9, 16])

# Removing the line from the axes
line[0].remove()

plt.show()
Output:
6. Clearing Annotations
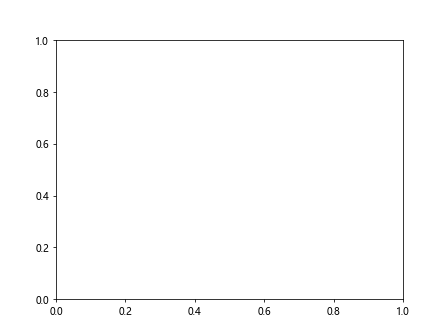
Annotations like text, arrows, and shapes can be added to plots in Matplotlib. To clear annotations from the axes, you can iterate over the annotations and remove them. Here’s an example:
import matplotlib.pyplot as plt

# Adding text annotation to the plot
text = plt.text(0.5, 0.5, 'Hello, how2matplotlib.com!',
                fontsize=12, ha='center')

# Removing the text annotation
text.remove()

plt.show()
Output:
7. Clearing Spines
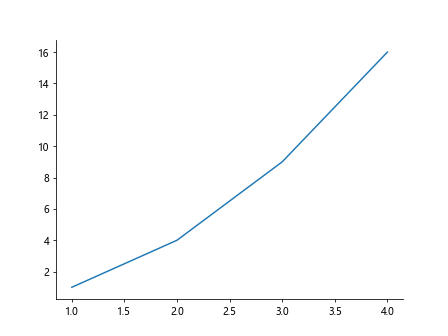
Spines are the borders around the axes in Matplotlib. You can clear spines by setting their visibility to False. Here’s an example:
import matplotlib.pyplot as plt

# Plotting a simple line graph
plt.plot([1, 2, 3, 4], [1, 4, 9, 16])

# Clearing the spines
plt.gca().spines['top'].set_visible(False)
plt.gca().spines['right'].set_visible(False)

plt.show()
Output:
8. Clearing Tick Labels
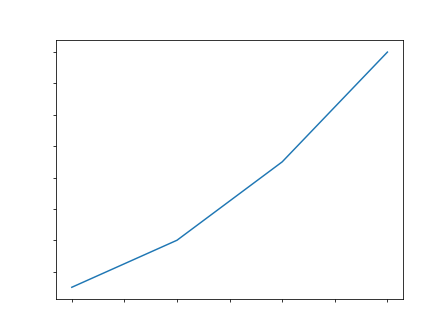
If you want to clear the tick labels from the axes, you can set them to an empty list. Here’s an example:
import matplotlib.pyplot as plt

# Plotting a simple line graph
plt.plot([1, 2, 3, 4], [1, 4, 9, 16])

# Clearing the tick labels
plt.gca().set_xticklabels([])
plt.gca().set_yticklabels([])

plt.show()
Output:
9. Clearing Grid Lines
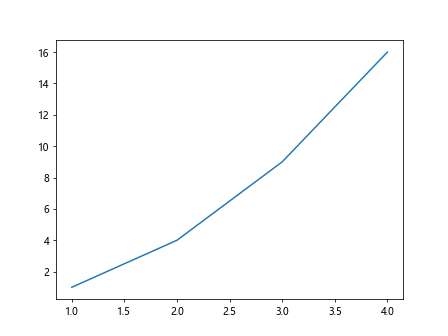
Grid lines can be added to plots in Matplotlib to aid in data visualization. You can clear the grid lines by setting them to invisible. Here’s an example:
import matplotlib.pyplot as plt

# Plotting a simple line graph with grid lines
plt.plot([1, 2, 3, 4], [1, 4, 9, 16])
plt.grid(True)

# Clearing the grid lines
plt.grid(False)

plt.show()
Output:
10. Clearing Background Color
The background color of a plot can be cleared by setting it to transparent. Here’s an example:
import matplotlib.pyplot as plt

# Plotting a simple line graph with a background color
plt.plot([1, 2, 3, 4], [1, 4, 9, 16])
plt.gca().set_facecolor('lightgray')

# Clearing the background color
plt.gca().set_facecolor('none')

plt.show()
Output:
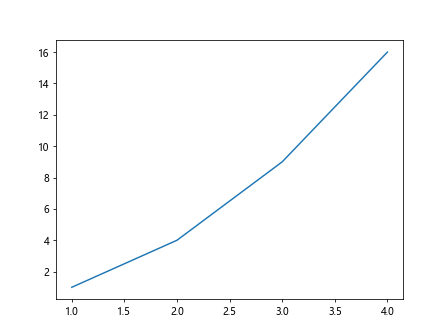
Clear Axes in Matplotlib Conclusion
In this article, we explored various ways to clear and reset axes in Matplotlib. Whether you want to remove all plotted data, specific artists, annotations, spines, tick labels, grid lines, or background color, there are methods available to help you clean up your plots for a fresh start. Experiment with these examples in your own Matplotlib plots to see how you can effectively clear the axes for a new visualization.