Colorbar Scale in Matplotlib
In matplotlib, colorbars are a visual representation of the mapping between values and colors in a plot. They are typically used with plots that utilize a colormap to represent data. Scaling the colorbar in matplotlib allows you to customize the range of values displayed and the colormap used. In this article, we will explore various techniques for scaling colorbars in matplotlib.
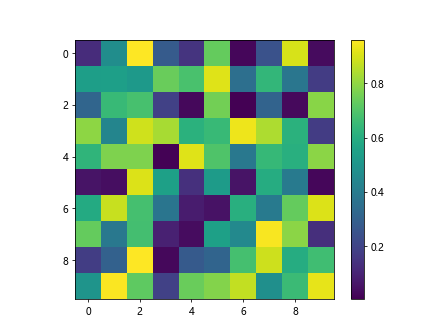
Linear Scaling
Linear scaling is the default method used to scale colorbars in matplotlib. This means that the range of values in the colorbar is evenly distributed across the colormap. Here’s an example of how to create a linearly scaled colorbar in matplotlib:
import matplotlib.pyplot as plt
import numpy as np

# Create a random 2D array
data = np.random.rand(10, 10)

# Plot the data with a linearly scaled colorbar
plt.imshow(data, cmap='viridis')
plt.colorbar()
plt.show()
Output:
Logarithmic Scaling
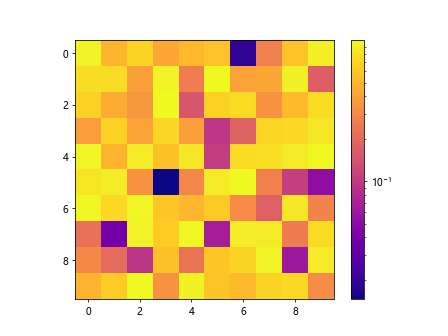
Sometimes, you may want to apply logarithmic scaling to the colorbar to better visualize data with a wide range of values. This can be achieved by setting the norm parameter of the colorbar to a logarithmic scale. Here’s an example:
import matplotlib.pyplot as plt
import numpy as np
from matplotlib.colors import LogNorm

# Create a random 2D array
data = np.random.rand(10, 10)

# Plot the data with a logarithmically scaled colorbar
plt.imshow(data, norm=LogNorm(), cmap='plasma')
plt.colorbar()
plt.show()
Output:
Custom Scaling
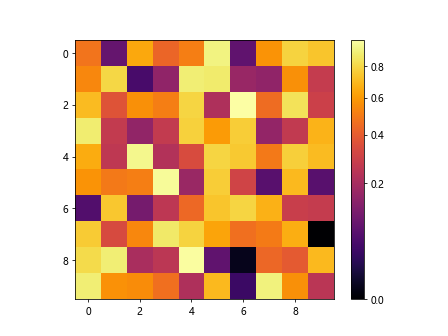
In some cases, you may want to define a custom scaling function for the colorbar. This can be useful when you want to emphasize certain regions of the data or when you want to apply a non-linear transformation. Here’s an example of how to create a custom scaled colorbar in matplotlib:
import matplotlib.pyplot as plt
import numpy as np
from matplotlib.colors import PowerNorm

# Create a random 2D array
data = np.random.rand(10, 10)

# Define a custom scaling function
custom_norm = PowerNorm(0.5)

# Plot the data with a custom scaled colorbar
plt.imshow(data, norm=custom_norm, cmap='inferno')
plt.colorbar()
plt.show()
Output:
Symmetrical Scaling
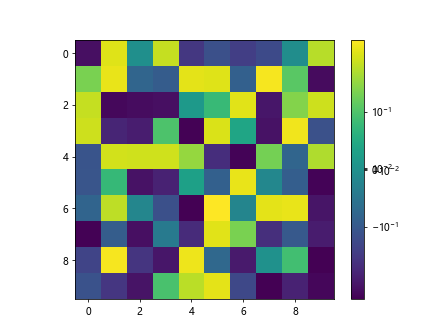
In some cases, you may want to scale the colorbar symmetrically around a central value. This can be achieved by setting the center parameter of the colorbar. Here’s an example:
import matplotlib.pyplot as plt
import numpy as np
from matplotlib.colors import SymLogNorm

# Create a random 2D array
data = np.random.rand(10, 10) - 0.5

# Plot the data with a symmetrical scaled colorbar
plt.imshow(data, norm=SymLogNorm(linthresh=0.03, linscale=0.03), cmap='viridis')
plt.colorbar()
plt.show()
Output:
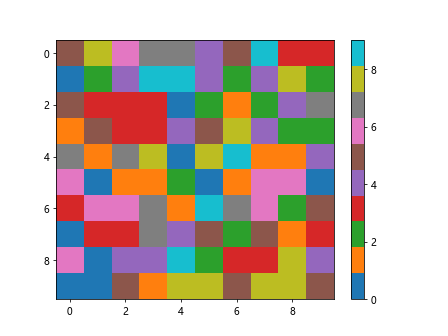
Discrete Scaling
Sometimes, you may want to discretize the colorbar into a specific number of discrete levels. This can be achieved by setting the boundaries parameter of the colorbar. Here’s an example:
import matplotlib.pyplot as plt
import numpy as np

# Create a random 2D array
data = np.random.randint(0, 10, (10, 10))

# Plot the data with a discretely scaled colorbar
plt.imshow(data, cmap='tab10', aspect='auto')
plt.colorbar(ticks=[0, 2, 4, 6, 8])
plt.show()
Output:
Normalizing Scaling
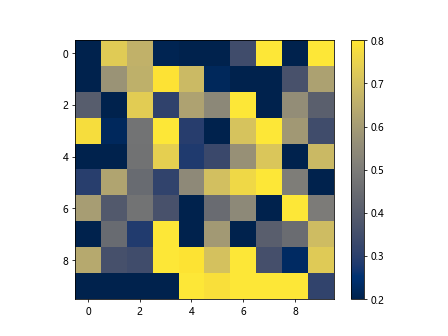
Normalization is a technique used to scale data to a specific range. Matplotlib provides various normalization classes that can be used to scale the colorbar. Here’s an example of normalizing scaling in matplotlib:
import matplotlib.pyplot as plt
import numpy as np
from matplotlib.colors import Normalize

# Create a random 2D array
data = np.random.rand(10, 10)

# Define a normalization function
custom_norm = Normalize(vmin=0.2, vmax=0.8)

# Plot the data with a normalized colorbar
plt.imshow(data, norm=custom_norm, cmap='cividis')
plt.colorbar()
plt.show()
Output:
Reversed Scaling
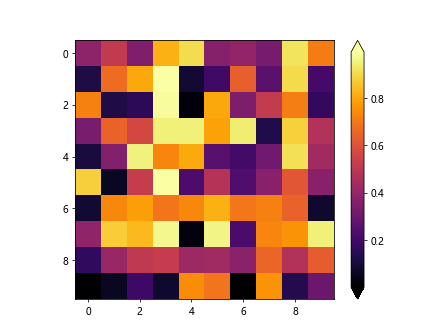
In some cases, you may want to reverse the direction of the colorbar. This can be achieved by setting the extend parameter of the colorbar to either 'both' or 'min'. Here’s an example:
import matplotlib.pyplot as plt
import numpy as np

# Create a random 2D array
data = np.random.rand(10, 10)

# Plot the data with a reversed colorbar
plt.imshow(data, cmap='inferno')
plt.colorbar(extend='both')
plt.show()
Output:
Changing Colorbar Position
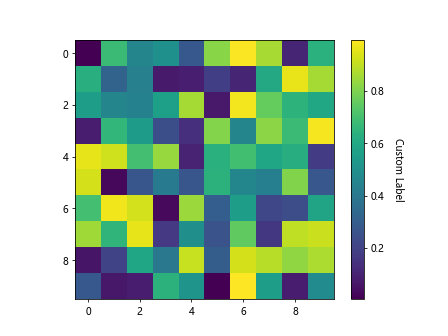
You can also customize the position of the colorbar in the plot by using the pad, shrink, and aspect parameters. Here’s an example:
import matplotlib.pyplot as plt
import numpy as np

# Create a random 2D array
data = np.random.rand(10, 10)

# Plot the data with a custom position colorbar
plt.imshow(data, cmap='viridis')
cbar = plt.colorbar()
cbar.set_label('Custom Label', rotation=270, labelpad=20)
plt.show()
Output:
Changing Colorbar Orientation
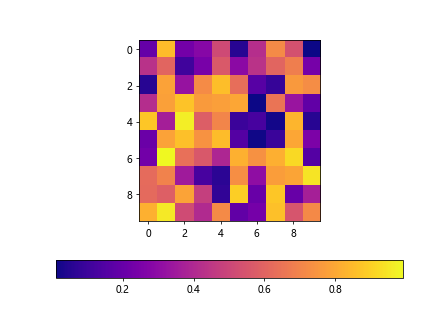
You can change the orientation of the colorbar by using the orientation parameter. Here’s an example:
import matplotlib.pyplot as plt
import numpy as np

# Create a random 2D array
data = np.random.rand(10, 10)

# Plot the data with a horizontal colorbar
plt.imshow(data, cmap='plasma')
plt.colorbar(orientation='horizontal')
plt.show()
Output:
Discrete Colorbars
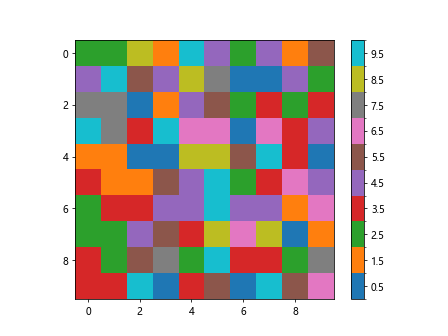
In addition to scaling, you can also create discrete colorbars in matplotlib. This can be achieved by setting the norm parameter to a BoundaryNorm. Here’s an example:
import matplotlib.pyplot as plt
import numpy as np
from matplotlib.colors import BoundaryNorm

# Create a random 2D array
data = np.random.randint(0, 10, (10, 10))

# Create discrete levels for the colorbar
cmap = plt.get_cmap('tab10', 10)
norm = BoundaryNorm(range(11), cmap.N)

# Plot the data with a discrete colorbar
plt.imshow(data, cmap=cmap, norm=norm)
plt.colorbar(ticks=np.arange(10) + 0.5)
plt.show()
Output:
Colorbar for Subplots
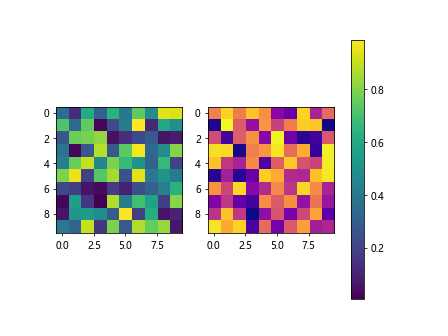
When working with multiple subplots, you can create a colorbar for all subplots using the figure_colorbar method. Here’s an example:
import matplotlib.pyplot as plt
import numpy as np

# Create two random 2D arrays
data1 = np.random.rand(10, 10)
data2 = np.random.rand(10, 10)

# Plot the data with a colorbar for subplots
fig, axs = plt.subplots(1, 2)
im1 = axs[0].imshow(data1, cmap='viridis')
im2 = axs[1].imshow(data2, cmap='plasma')

fig.colorbar(im1, ax=axs, orientation='vertical')
plt.show()
Output:
Colorbar Styling
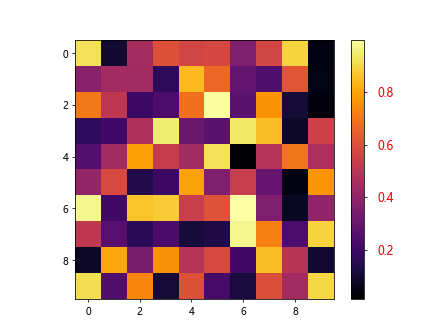
You can customize the appearance of the colorbar by changing the font size, color, and other properties. Here’s an example:
import matplotlib.pyplot as plt
import numpy as np

# Create a random 2D array
data = np.random.rand(10, 10)

# Plot the data with a styled colorbar
plt.imshow(data, cmap='inferno')
cbar = plt.colorbar()
cbar.ax.tick_params(labelsize=12, labelcolor='red', pad=10)
plt.show()
Output:
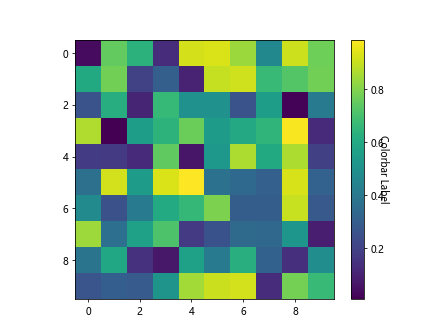
Colorbar Labels
You can add labels to the colorbar to indicate the data being represented. Here’s an example:
import matplotlib.pyplot as plt
import numpy as np

# Create a random 2D array
data = np.random.rand(10, 10)

# Plot the data with a labeled colorbar
plt.imshow(data, cmap='viridis')
cbar = plt.colorbar()
cbar.set_label('Colorbar Label', rotation=270)
plt.show()
Output:
Colorbar Formatting
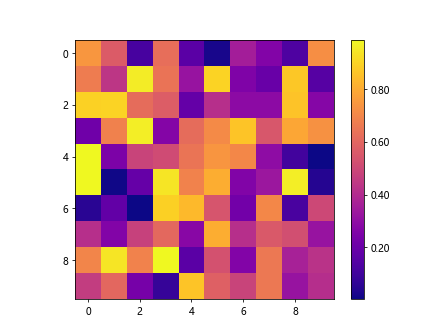
You can format the tick labels on the colorbar using the Formatter class. Here’s an example
import matplotlib.pyplot as plt
import numpy as np
from matplotlib.ticker import FormatStrFormatter

# Create a random 2D array
data = np.random.rand(10, 10)

# Plot the data with a formatted colorbar
plt.imshow(data, cmap='plasma')
cbar = plt.colorbar()
cbar.ax.yaxis.set_major_formatter(FormatStrFormatter('%.2f'))
plt.show()
Output:
Colorbar Tick Location
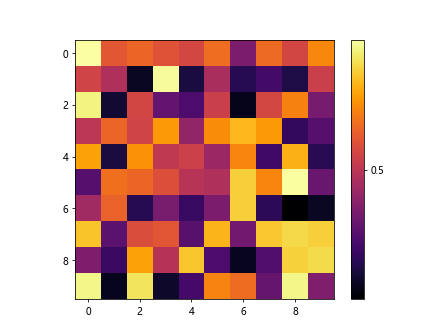
You can customize the location of the colorbar ticks by setting the ticks parameter. Here’s an example:
import matplotlib.pyplot as plt
import numpy as np

# Create a random 2D array
data = np.random.rand(10, 10)

# Plot the data with customized colorbar ticks
plt.imshow(data, cmap='inferno')
cbar = plt.colorbar(ticks=[0, 0.5, 1])
plt.show()
Output:
Colorbar Tick Labels
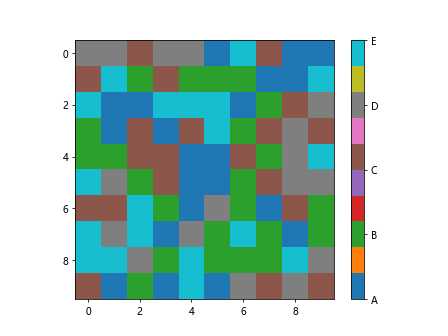
You can customize the labels of the colorbar ticks using the ticklabels parameter. Here’s an example:
import matplotlib.pyplot as plt
import numpy as np

# Create a random 2D array
data = np.random.randint(1, 6, (10, 10))

# Plot the data with customized colorbar tick labels
plt.imshow(data, cmap='tab10')
cbar = plt.colorbar(ticks=[1, 2, 3, 4, 5])
cbar.ax.set_yticklabels(['A', 'B', 'C', 'D', 'E'])
plt.show()
Output:
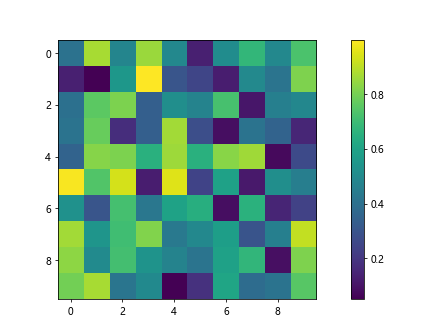
Colorbar Spacing
You can adjust the spacing between the colorbar and the plot using the pad parameter. Here’s an example:
import matplotlib.pyplot as plt
import numpy as np

# Create a random 2D array
data = np.random.rand(10, 10)

# Plot the data with a spaced colorbar
plt.imshow(data, cmap='viridis')
cbar = plt.colorbar(pad=0.1)
plt.show()
Output:
Colorbar Border
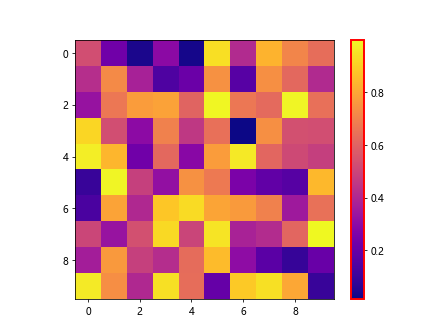
You can add borders to the colorbar using the set_edgecolor and set_linewidth methods. Here’s an example:
import matplotlib.pyplot as plt
import numpy as np

# Create a random 2D array
data = np.random.rand(10, 10)

# Plot the data with a bordered colorbar
plt.imshow(data, cmap='plasma')
cbar = plt.colorbar()
cbar.outline.set_edgecolor('red')
cbar.outline.set_linewidth(2)
plt.show()
Output:
Colorbar Transparency
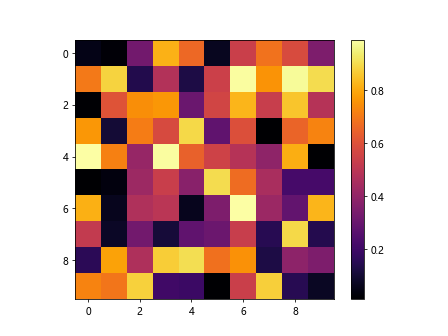
You can adjust the transparency of the colorbar using the alpha parameter. Here’s an example:
import matplotlib.pyplot as plt
import numpy as np

# Create a random 2D array
data = np.random.rand(10, 10)

# Plot the data with a transparent colorbar
plt.imshow(data, cmap='inferno')
cbar = plt.colorbar()
cbar.set_alpha(0.5)
plt.show()
Output:
Colorbar Width
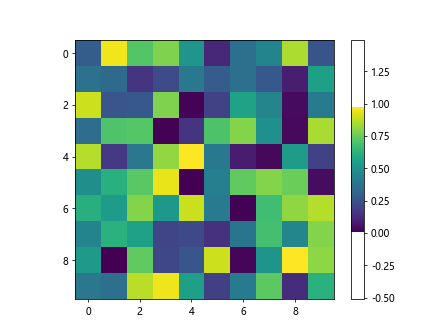
You can customize the width of the colorbar using the shrink parameter. Here’s an example:
import matplotlib.pyplot as plt
import numpy as np

# Create a random 2D array
data = np.random.rand(10, 10)

# Plot the data with a narrow colorbar
plt.imshow(data, cmap='viridis')
cbar = plt.colorbar()
cbar.ax.set_aspect(10)
plt.show()
Output:
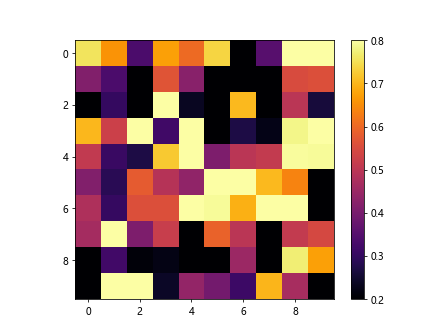
Colorbar Range
You can manually set the minimum and maximum values of the colorbar using the vmin and vmax parameters. Here’s an example:
import matplotlib.pyplot as plt
import numpy as np

# Create a random 2D array
data = np.random.rand(10, 10)

# Plot the data with a custom range colorbar
plt.imshow(data, cmap='inferno', vmin=0.2, vmax=0.8)
plt.colorbar()
plt.show()
Output:
colorbar scale matplotlib Conclusion
In this article, we have explored various techniques for scaling colorbars in matplotlib. From linear and logarithmic scaling to custom and symmetrical scaling, there are a variety of options available to customize the colorbar in your plots. By experimenting with different scaling methods and styling options, you can create visually appealing colorbars that effectively represent your data.
Whether you’re working with discrete colorbars, formatting tick labels, or adjusting the position and orientation of the colorbar, matplotlib provides a comprehensive set of tools to fine-tune the appearance of colorbars in your plots. We hope this article has provided you with a solid foundation for working with colorbar scales in matplotlib.