Understanding the cmap viridis colormap in Matplotlib
In this article, we will dive deep into the viridis colormap in Matplotlib. Colormaps are essential for visualizing data effectively, and viridis is a popular choice due to its perceptually uniform progression of colors, making it suitable for representing data accurately.
Part 1: Introduction to Viridis Colormap
The viridis colormap was introduced in Matplotlib 2.0 as the default colormap for plots. It is a colormap that is designed to be perceptually uniform and to be easily interpreted by those with colorblindness.
Let’s start by plotting a simple line plot using the viridis colormap:
import matplotlib.pyplot as plt
import numpy as np

x = np.linspace(0, 10, 100)
y = np.sin(x)

plt.plot(x, y, cmap='viridis')
plt.show()
Part 2: Customizing Viridis Colormap
You can customize the appearance of the viridis colormap by adjusting its properties. For example, you can change the transparency of the colors by setting the alpha parameter:
import matplotlib.pyplot as plt
import numpy as np

x = np.linspace(0, 10, 100)
y = np.sin(x)

plt.plot(x, y, cmap='viridis', alpha=0.5)
plt.show()
Part 3: Using Viridis in Different Plot Types
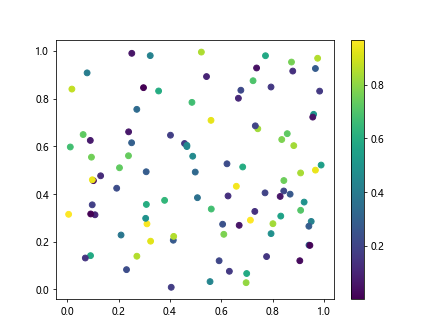
The viridis colormap can be used in various types of plots, not just line plots. Let’s see how it looks in a scatter plot:
import matplotlib.pyplot as plt
import numpy as np

N = 100
x = np.random.rand(N)
y = np.random.rand(N)
colors = np.random.rand(N)

plt.scatter(x, y, c=colors, cmap='viridis')
plt.colorbar()
plt.show()
Output:
Part 4: Using Viridis in 3D Plots
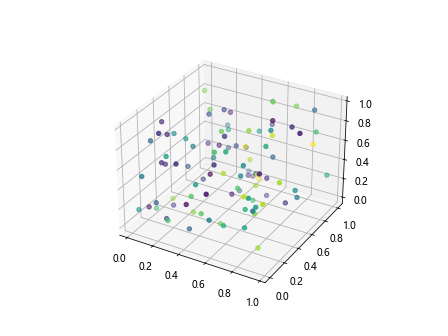
You can also utilize the viridis colormap in 3D plots. Let’s create a 3D scatter plot using viridis:
from mpl_toolkits.mplot3d import Axes3D
import matplotlib.pyplot as plt
import numpy as np

fig = plt.figure()
ax = fig.add_subplot(111, projection='3d')

x = np.random.rand(100)
y = np.random.rand(100)
z = np.random.rand(100)
colors = np.random.rand(100)

ax.scatter(x, y, z, c=colors, cmap='viridis')
plt.show()
Output:
Part 5: Creating Colorbars with Viridis
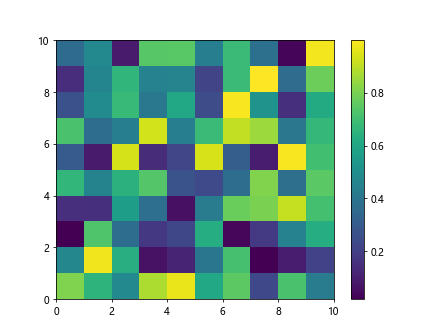
Colorbars are crucial for understanding the color mapping in visualizations. Let’s create a colorbar for a plot using the viridis colormap:
import matplotlib.pyplot as plt
import numpy as np

plt.pcolormesh(np.random.rand(10,10), cmap='viridis')
plt.colorbar()
plt.show()
Output:
Part 6: Handling Out-of-Bounds Values
Sometimes, your data might have values that exceed the range of the colormap. Matplotlib provides options for handling out-of-bounds values with the vmin, vmax, and extend parameters. Let’s see how it works with viridis:
import matplotlib.pyplot as plt
import numpy as np

data = np.random.rand(10, 10)
data[0, 0] = 100

plt.imshow(data, cmap='viridis', vmin=0, vmax=1, extend='both')
plt.colorbar()
plt.show()
Part 7: Reversing the Viridis Colormap
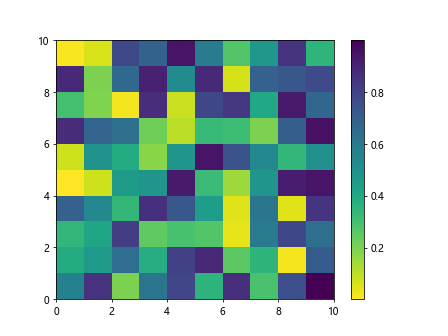
You can reverse the viridis colormap to change the color progression. This can be done by setting the cmap parameter to viridis_r:
import matplotlib.pyplot as plt
import numpy as np

plt.pcolormesh(np.random.rand(10,10), cmap='viridis_r')
plt.colorbar()
plt.show()
Output:
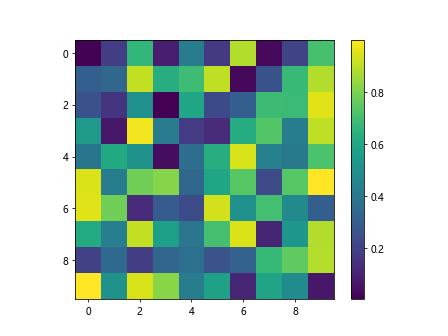
Part 8: Using Viridis for Heatmaps
Heatmaps are often used to visualize data intensity. Let’s create a heatmap using the viridis colormap:
import matplotlib.pyplot as plt
import numpy as np

data = np.random.rand(10, 10)

plt.imshow(data, cmap='viridis', interpolation='nearest')
plt.colorbar()
plt.show()
Output:
Part 9: Visualizing Images with Viridis
The viridis colormap can also be used to visualize images. Let’s see how an image looks with the viridis colormap:
import matplotlib.pyplot as plt
import numpy as np

image = np.random.rand(100, 100)

plt.imshow(image, cmap='viridis')
plt.axis('off')
plt.show()
Output:

Part 10: Conclusion
In conclusion, the viridis colormap in Matplotlib is a versatile and visually pleasing option for representing data in various types of plots. Its perceptually uniform progression of colors makes it a popular choice for both scientific and aesthetic visualizations. By understanding how to use and customize the viridis colormap, you can enhance the clarity and effectiveness of your data visualizations.
I hope this comprehensive guide has provided you with a better understanding of the viridis colormap and how it can be utilized in your Matplotlib plots.