Binary Colormap in Matplotlib
When creating visualizations, choosing the right colormap is essential to effectively convey information. In this article, we will explore the binary colormap in Matplotlib, which is a colormap that only consists of two distinct colors – typically black and white. This colormap is commonly used for visualizing binary data or for emphasizing sharp contrasts in the data.
Creating a Binary Colormap
To create a binary colormap in Matplotlib, you can use the ListedColormap class from the matplotlib.colors module.
import matplotlib.pyplot as plt
from matplotlib.colors import ListedColormap

binary_cmap = ListedColormap(['black', 'white'])
Using Binary Colormap in Plotting
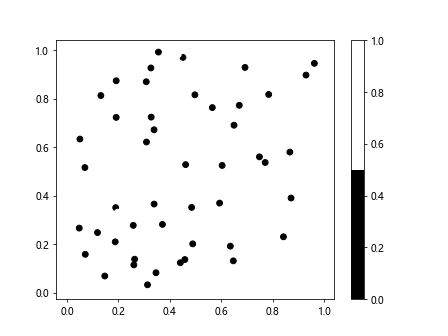
Let’s now see how we can use the binary colormap in a scatter plot.
import numpy as np
import matplotlib.pyplot as plt
from matplotlib.colors import ListedColormap

binary_cmap = ListedColormap(['black', 'white'])

x = np.random.rand(100)
y = np.random.rand(100)
colors = np.random.randint(0, 2, 100)

plt.scatter(x, y, c=colors, cmap=binary_cmap)
plt.colorbar()
plt.show()
Output:

Customizing Binary Colormap
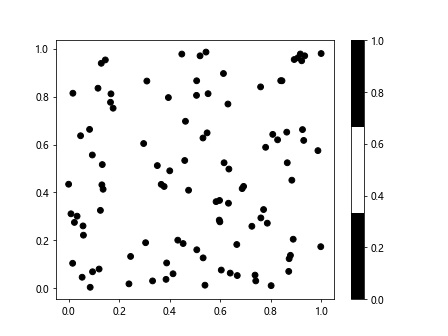
You can also customize the binary colormap by adjusting the color boundaries.
import numpy as np
import matplotlib.pyplot as plt
from matplotlib.colors import ListedColormap

binary_cmap = ListedColormap(['black', 'white'], N=3)

x = np.random.rand(100)
y = np.random.rand(100)
colors = np.random.randint(0, 2, 100)

plt.scatter(x, y, c=colors, cmap=binary_cmap)
plt.colorbar()
plt.show()
Output:

Visualizing Binary Data
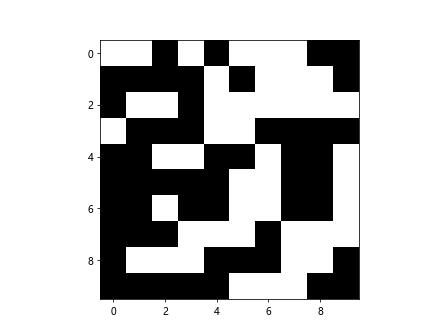
One common use case for the binary colormap is visualizing binary data. Let’s create a simple binary matrix and visualize it using the binary colormap.
import numpy as np
import matplotlib.pyplot as plt
from matplotlib.colors import ListedColormap

binary_cmap = ListedColormap(['black', 'white'])

binary_data = np.random.randint(0, 2, (10, 10))

plt.imshow(binary_data, cmap=binary_cmap, interpolation='nearest')
plt.show()
Output:

Thresholding Data with Binary Colormap
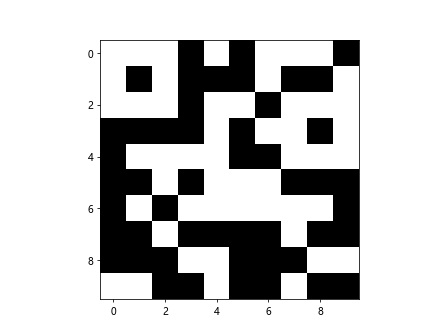
You can also use the binary colormap to threshold data by setting a specific threshold value.
import numpy as np
import matplotlib.pyplot as plt
from matplotlib.colors import ListedColormap

binary_cmap = ListedColormap(['black', 'white'])

data = np.random.rand(10, 10)
threshold = 0.5
binary_data = np.where(data > threshold, 1, 0)

plt.imshow(binary_data, cmap=binary_cmap, interpolation='nearest')
plt.show()
Output:

Using Binary Colormap with Images
Binary colormap can also be applied to images to highlight specific features.
import matplotlib.image as mpimg
import numpy as np
import matplotlib.pyplot as plt
from matplotlib.colors import ListedColormap

binary_cmap = ListedColormap(['black', 'white'])

# Load image
image = mpimg.imread('image.jpg')

# Convert image to grayscale
gray_image = np.mean(image, axis=2)

# Apply binary colormap
plt.imshow(gray_image, cmap=binary_cmap, interpolation='nearest')
plt.show()
Creating Chernoff Faces with Binary Colormap
Chernoff faces are a visualization method that encodes data using human faces. Let’s create Chernoff faces using the binary colormap for features like hair color.
import numpy as np
import matplotlib.pyplot as plt
from matplotlib.colors import ListedColormap

binary_cmap = ListedColormap(['black', 'white'])

features = np.random.randint(0, 2, (10, 5))
plt.figure(figsize=(10, 10))

for i in range(features.shape[0]):
    for j in range(features.shape[1]):
        plt.subplot(features.shape[0], features.shape[1], i*features.shape[1] + j + 1)
        plt.imshow(np.array([[features[i, j]]]), cmap=binary_cmap)
        plt.axis('off')

plt.show()
Output:

Binary Colormap in Matplotlib Conclusion
In conclusion, the binary colormap in Matplotlib is a powerful tool for visualizing binary or thresholded data, emphasizing sharp contrasts, and creating unique visualizations like Chernoff faces. By leveraging the capabilities of Matplotlib, you can effectively use the binary colormap to enhance your data visualizations.