Adjusting Annotation Font Size in Matplotlib
In Matplotlib, annotations are an important tool for adding explanatory text to your plots. However, sometimes the default font size of the annotations may not be suitable for your needs. In this article, we will explore how to adjust the font size of annotations in Matplotlib using the ax.annotate() function.
Basic Annotation with Default Font Size
Let’s start with a basic example of adding an annotation to a plot using the default font size.
import matplotlib.pyplot as plt

fig, ax = plt.subplots()
ax.plot([1, 2, 3], [1, 2, 3])

ax.annotate('Default Font Size', xy=(2, 2))
plt.show()
Output:
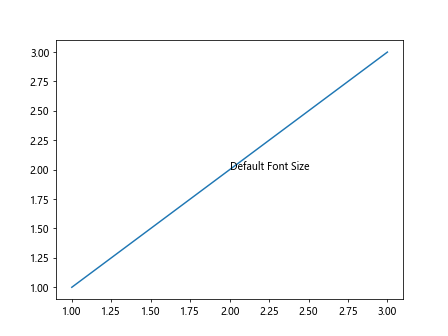
In the above code snippet, we create a simple plot and add an annotation with the text “Default Font Size” at coordinates (2, 2). The font size of this annotation is the default value.
Adjusting Font Size
To adjust the font size of an annotation in Matplotlib, we can use the fontsize parameter of the ax.annotate() function. The fontsize parameter accepts a numeric value that represents the font size in points.
import matplotlib.pyplot as plt

fig, ax = plt.subplots()
ax.plot([1, 2, 3], [1, 2, 3])

ax.annotate('Font Size 12', xy=(2, 2), fontsize=12)
plt.show()
Output:
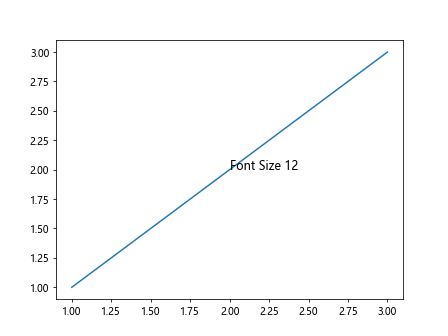
In this example, we set the font size of the annotation to 12 points. You can adjust the fontsize parameter to achieve the desired font size for your annotations.
Customizing Font Properties
In addition to adjusting the font size, you can customize other font properties of annotations in Matplotlib. You can use the fontdict parameter of the ax.annotate() function to specify a dictionary of font properties.
import matplotlib.pyplot as plt

fig, ax = plt.subplots()
ax.plot([1, 2, 3], [1, 2, 3])

font_props = {'family': 'serif', 'color': 'blue', 'weight': 'bold', 'size': 14}
ax.annotate('Custom Font Properties', xy=(2, 2), fontdict=font_props)
plt.show()
In the above code snippet, we define a dictionary font_props that contains custom font properties such as font family, text color, font weight, and size. By passing this dictionary to the fontdict parameter, we can customize the font properties of the annotation.
Annotating with Multiline Text
Sometimes you may want to create annotations with multiline text in Matplotlib. You can achieve this by using the newline character \n within the annotation text.
import matplotlib.pyplot as plt

fig, ax = plt.subplots()
ax.plot([1, 2, 3], [1, 2, 3])

multiline_text = 'Multiline\nText\nAnnotation'
ax.annotate(multiline_text, xy=(2, 2), fontsize=12)
plt.show()
Output:
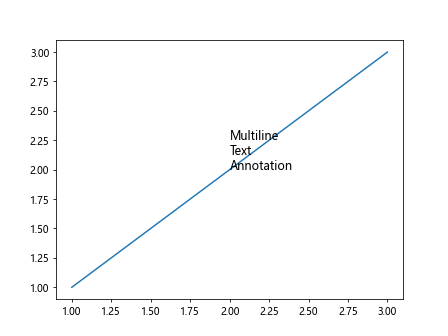
In this example, we create an annotation with multiline text by using the newline character \n to separate the lines of text.
Controlling Annotation Text Alignment
You can control the alignment of the annotation text within the annotation box in Matplotlib by using the ha (horizontal alignment) and va (vertical alignment) parameters of the ax.annotate() function.
import matplotlib.pyplot as plt

fig, ax = plt.subplots()
ax.plot([1, 2, 3], [1, 2, 3])

ax.annotate('Center Aligned', xy=(2, 2), fontsize=12, ha='center', va='center')
plt.show()
Output:
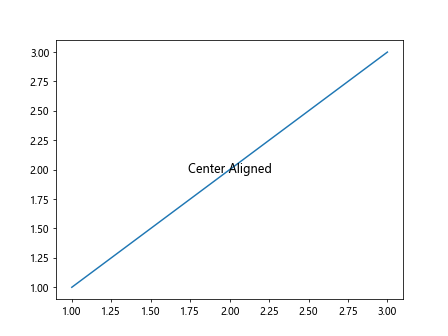
In this code snippet, we set the ha and va parameters to ‘center’ to align the text in the annotation box both horizontally and vertically at the center.
Customizing Annotation Box Properties
You can also customize the properties of the annotation box in Matplotlib, such as the background color, transparency, and border. These properties can be adjusted using the bbox parameter of the ax.annotate() function.
import matplotlib.pyplot as plt

fig, ax = plt.subplots()
ax.plot([1, 2, 3], [1, 2, 3])

bbox_props = dict(boxstyle='round,pad=0.3', fc='lightblue', alpha=0.5)
ax.annotate('Custom Box Properties', xy=(2, 2), fontsize=12, bbox=bbox_props)
plt.show()
Output:
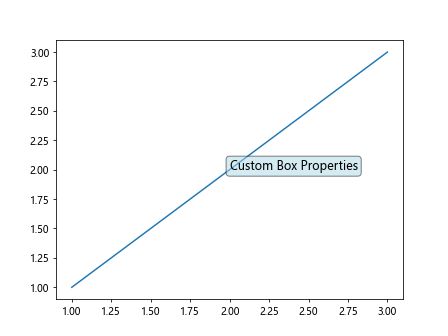
In this example, we define a dictionary bbox_props that contains custom box properties such as box style, background color, and transparency. By passing this dictionary to the bbox parameter, we can customize the properties of the annotation box.
Adding Arrows to Annotations
Matplotlib allows you to add arrows to annotations to indicate the connection between the annotation text and the data point. You can control the appearance and position of the arrow using the arrowprops parameter of the ax.annotate() function.
import matplotlib.pyplot as plt

fig, ax = plt.subplots()
ax.plot([1, 2, 3], [1, 2, 3])

arrow_props = dict(arrowstyle='->', connectionstyle='arc3,rad=0.5', color='red')
ax.annotate('Arrow Annotation', xy=(2, 2), fontsize=12, arrowprops=arrow_props)
plt.show()
Output:
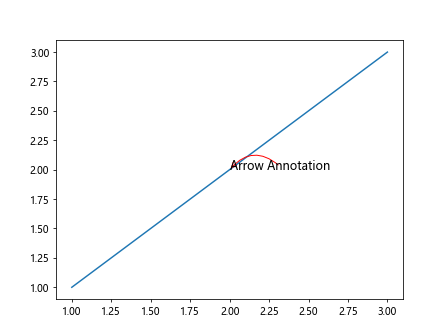
In this code snippet, we define a dictionary arrow_props that specifies the arrow style, connection style, and color of the arrow. By passing this dictionary to the arrowprops parameter, we can add an arrow to the annotation.
Combining Customizations
You can combine various customizations to create visually appealing and informative annotations in Matplotlib. By adjusting font properties, alignment, box properties, and arrows, you can tailor the appearance of annotations to suit your specific requirements.
import matplotlib.pyplot as plt

fig, ax = plt.subplots()
ax.plot([1, 2, 3], [1, 2, 3])

font_props = {'family': 'serif', 'color': 'blue', 'weight': 'bold', 'size': 14}
bbox_props = dict(boxstyle='round,pad=0.3', fc='lightblue', alpha=0.5)
arrow_props = dict(arrowstyle='->', connectionstyle='arc3,rad=0.5', color='red')

ax.annotate('Combined Customizations', xy=(2, 2), fontsize=12,
            fontdict=font_props, bbox=bbox_props, arrowprops=arrow_props)
plt.show()
In this example, we combine custom font properties, box properties, and an arrow in the annotation to demonstrate the versatility of annotation customizations in Matplotlib.
Adjusting Annotation Font Size in Matplotlib Conclusion
Adjusting the font size of annotations in Matplotlib allows you to enhance the readability and visual appeal of your plots. By using the ax.annotate() function and customizing font properties, alignment, box properties, and arrows, you can create informative and visually appealing annotations tailored to your specific needs. Experiment with different customizations to discover the best annotation style for your plots.