Setting Axis Title Font Size in Matplotlib
In Matplotlib, we can customize the font size of the axis titles in our plots to make them more visually appealing and easier to read. In this article, we will explore various methods to set the axis title font size in Matplotlib.
Method 1: Using set_title and set_size to set font size
We can use the set_title method to set the title for the axis and the set_size method to specify the font size. Here is an example:
import matplotlib.pyplot as plt
fig, ax = plt.subplots()
ax.plot([1, 2, 3, 4], [10, 20, 25, 30])
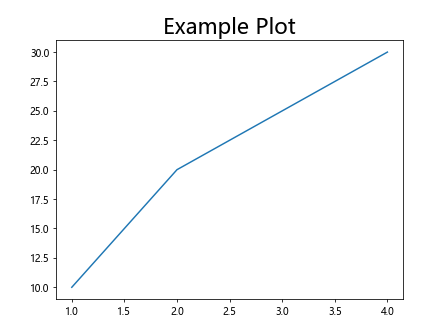
ax.set_title('Example Plot', fontsize=20)
plt.show()
Output:
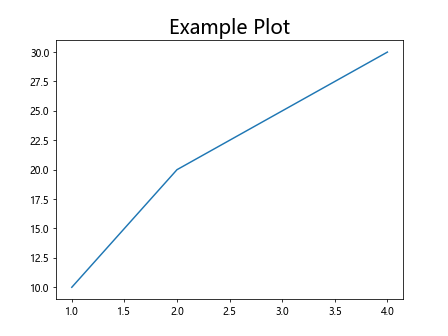
In this example, we create a simple plot and set the title font size to 20 using the fontsize parameter in the set_title method.
Method 2: Using fontdict to set font size
Another way to set the axis title font size is by using the fontdict parameter in the set_title method. Here is an example:
import matplotlib.pyplot as plt

fig, ax = plt.subplots()
ax.plot([1, 2, 3, 4], [10, 20, 25, 30])
ax.set_title('Example Plot', fontdict={'fontsize': 16})
plt.show()
Output:
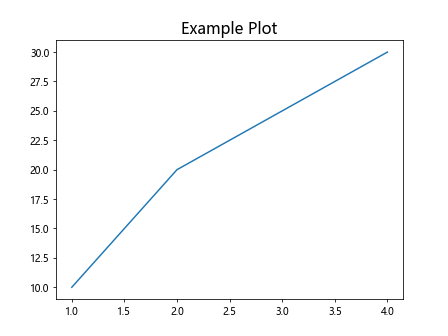
In this example, we set the font size of the axis title to 16 by passing a dictionary with the key 'fontsize' and the desired font size to the fontdict parameter.
Method 3: Using rcParams to set default font size
We can also set the default font size for all axis titles in our plots using the plt.rcParams dictionary. Here is an example:
import matplotlib.pyplot as plt

plt.rcParams['axes.titleweight'] = 'bold'
plt.rcParams['axes.titlepad'] = 12

fig, ax = plt.subplots()
ax.plot([1, 2, 3, 4], [10, 20, 25, 30])
ax.set_title('Example Plot')
plt.show()
Output:
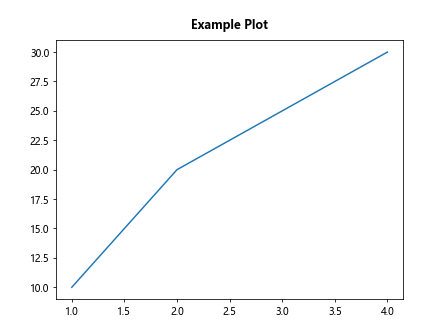
In this example, we set the default font weight for all axis titles to ‘bold’ and increase the title padding to 12 points using the plt.rcParams dictionary.
Method 4: Manually adjusting font properties
If we want more control over the font properties of the axis title, we can manually adjust the font size, weight, and other properties. Here is an example:
import matplotlib.pyplot as plt
from matplotlib.font_manager import FontProperties

fig, ax = plt.subplots()
ax.plot([1, 2, 3, 4], [10, 20, 25, 30])
title_font = FontProperties()
title_font.set_family('serif')
title_font.set_weight('bold')
title_font.set_size(18)
ax.set_title('Example Plot', fontproperties=title_font)
plt.show()
Output:
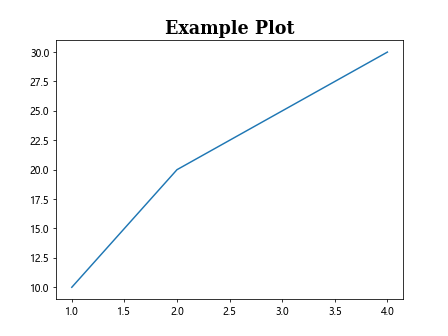
In this example, we create a FontProperties object and manually set the family, weight, and size of the font for the axis title before passing it to the set_title method.
Method 5: Using LaTeX for font styling
Matplotlib also supports LaTeX formatting for font styling, allowing us to create more complex and visually appealing axis titles. Here is an example:
import matplotlib.pyplot as plt

fig, ax = plt.subplots()
ax.plot([1, 2, 3, 4], [10, 20, 25, 30])
ax.set_title(r'$\alpha$ vs. $\beta$', fontsize=20)
plt.show()
Output:
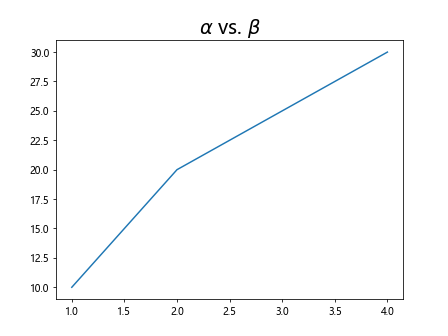
In this example, we use LaTeX syntax to create a mathematical expression for the axis title and set the font size to 20.
Method 6: Changing font size for individual axes
We can also set different font sizes for the x-axis and y-axis titles in a plot. Here is an example:
import matplotlib.pyplot as plt

fig, (ax1, ax2) = plt.subplots(1, 2)
ax1.plot([1, 2, 3, 4], [10, 20, 25, 30])
ax1.set_xlabel('X-axis', fontsize=12)
ax1.set_ylabel('Y-axis', fontsize=12)

ax2.plot([1, 2, 3, 4], [10, 20, 25, 30])
ax2.set_xlabel('X-axis', fontsize=16)
ax2.set_ylabel('Y-axis', fontsize=16)

plt.show()
Output:
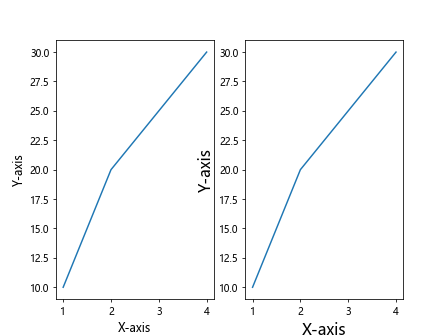
In this example, we create two subplots with different font sizes for the x-axis and y-axis titles using the set_xlabel and set_ylabel methods.
Method 7: Setting font size for multiple axis titles
If we have multiple axis titles in a plot, we can set the font size for each of them individually. Here is an example:
import matplotlib.pyplot as plt

fig, ax = plt.subplots()
ax.plot([1, 2, 3, 4], [10, 20, 25, 30])
ax.set_title('Main Title', fontsize=16)
ax.set_xlabel('X-axis', fontsize=12)
ax.set_ylabel('Y-axis', fontsize=12)
plt.show()
Output:
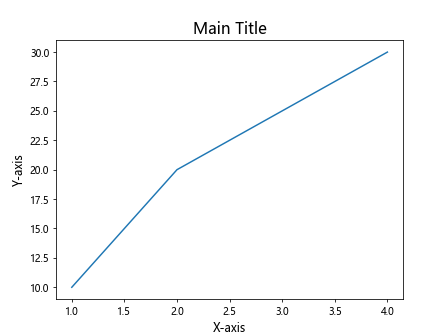
In this example, we set the font size for the main title, x-axis title, and y-axis title using the set_title, set_xlabel, and set_ylabel methods, respectively.
Method 8: Using suptitle for super title
If we want to add a super title to a plot that spans across all axis titles, we can use the suptitle method. Here is an example:
import matplotlib.pyplot as plt

fig, (ax1, ax2) = plt.subplots(1, 2)
ax1.plot([1, 2, 3, 4], [10, 20, 25, 30])
ax1.set_title('Plot 1')
ax2.plot([1, 2, 3, 4], [10, 20, 25, 30])
ax2.set_title('Plot 2')

fig.suptitle('Super Title', fontsize=18)
plt.show()
Output:
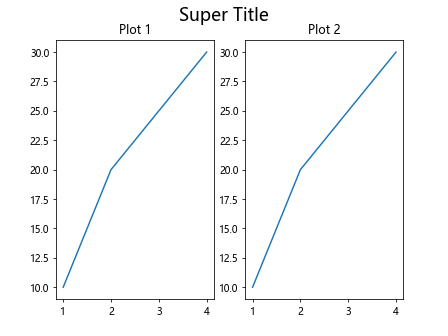
In this example, we create two subplots with individual titles and add a super title to the entire figure using the suptitle method with a font size of 18.
Method 9: Changing font size using get_figure method
We can also change the font size of the axis title by accessing the figure object and setting the font size. Here is an example:
import matplotlib.pyplot as plt

fig, ax = plt.subplots()
ax.plot([1, 2, 3, 4], [10, 20, 25, 30])
fig.get_axes()[0].set_title('Example Plot', fontsize=22)
plt.show()
Output:
In this example, we access the first axis object in the figure using the get_axes method and set the title font size to 22.
Method 10: Creating a custom title with annotations
For more advanced customizations, we can create a custom title using annotations in Matplotlib. Here is an example:
import matplotlib.pyplot as plt

fig, ax = plt.subplots()
ax.plot([1, 2, 3, 4], [10, 20, 25, 30])
ax.text(2, 25, 'Custom Title', fontsize=18, color='red', ha='center')
plt.show()
Output:
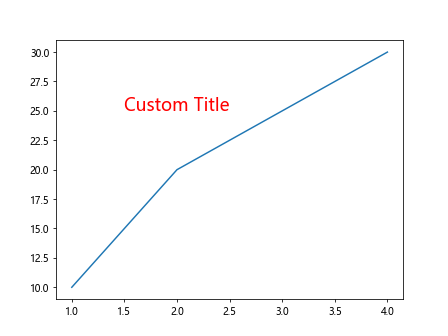
In this example, we use the text method to add a custom title at the specified coordinates with a font size of 18 and red color.
These are some of the methods we can use to set the axis title font size in Matplotlib. By customizing the font size, weight, and style of the axis titles, we can enhance the readability and aesthetics of our plots. Experiment with these methods to create visually appealing and informative plots in Matplotlib.