Ax Scatter Marker Size
In matplotlib, the scatter function is commonly used to create scatter plots. One of the properties that can be customized when creating scatter plots is the size of the markers used to represent the data points. In this article, we will explore how to adjust the marker size in scatter plots using the ax.scatter function in matplotlib.
Setting Marker Size in Scatter Plots
To set the size of markers in a scatter plot created using the ax.scatter function, we can use the s parameter. This parameter allows us to specify the size of the markers. Let’s look at an example:
import matplotlib.pyplot as plt

fig, ax = plt.subplots()
ax.scatter([1, 2, 3, 4, 5], [5, 4, 3, 2, 1], s=100)

plt.show()
Output:
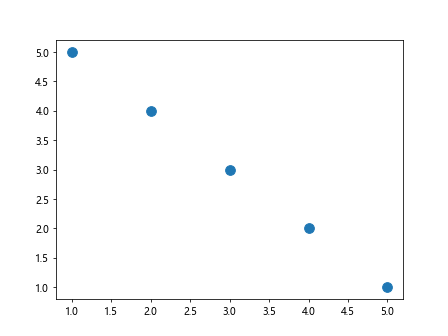
In the example above, we create a simple scatter plot with five data points. We set the size of the markers to 100 using the s parameter in the ax.scatter function.
Customizing Marker Size Based on Data
Sometimes, we may want to customize the size of markers in a scatter plot based on the values of a specific variable. For example, we may want larger markers for data points with higher values and smaller markers for data points with lower values. We can achieve this by passing an array of sizes to the s parameter. Let’s look at an example:
import matplotlib.pyplot as plt
import numpy as np

x = np.array([1, 2, 3, 4, 5])
y = np.array([5, 4, 3, 2, 1])
sizes = np.array([50, 100, 150, 200, 250])

fig, ax = plt.subplots()
ax.scatter(x, y, s=sizes)

plt.show()
Output:
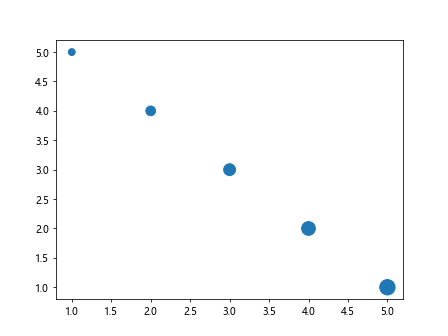
In this example, we create a scatter plot with five data points. We create an array sizes that specifies the size of markers for each data point. The size of the markers varies based on the values in the sizes array.
Using Colormaps to Encode Marker Size
Another way to customize the marker size in a scatter plot is to use colormaps to encode the marker sizes. This allows us to visually represent the sizes using different colors. We can achieve this by specifying the c parameter along with a colormap to map the sizes to colors. Let’s look at an example:
import matplotlib.pyplot as plt
import numpy as np

x = np.array([1, 2, 3, 4, 5])
y = np.array([5, 4, 3, 2, 1])
sizes = np.array([50, 100, 150, 200, 250])

fig, ax = plt.subplots()
scatter = ax.scatter(x, y, s=sizes, c=sizes, cmap='viridis')
cbar = plt.colorbar(scatter)
cbar.set_label('Marker Size')

plt.show()
Output:
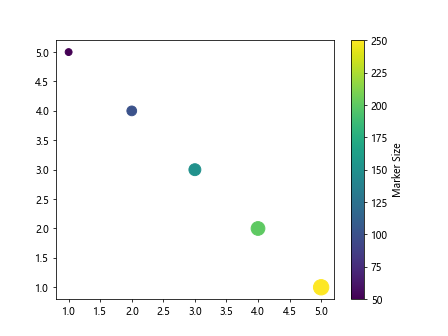
In this example, we use the viridis colormap to encode the marker sizes in the scatter plot. The size of the markers is represented by different shades of color, where lighter colors correspond to larger sizes.
Rescaling Marker Size
Sometimes, we may want to rescale the marker sizes in a scatter plot to better represent the data. We can achieve this by using the s parameter along with a scaling factor. This allows us to scale the marker sizes based on a specific factor. Let’s look at an example:
import matplotlib.pyplot as plt
import numpy as np

x = np.array([1, 2, 3, 4, 5])
y = np.array([5, 4, 3, 2, 1])
sizes = np.array([50, 100, 150, 200, 250])

fig, ax = plt.subplots()
ax.scatter(x, y, s=sizes, alpha=0.5)

plt.show()
Output:
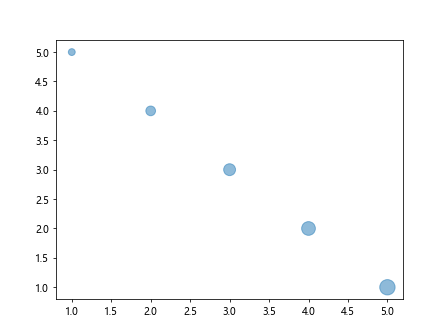
In this example, we use an alpha value of 0.5 to make the markers partially transparent. This allows us to see overlapping markers more clearly in the scatter plot.
Varying Marker Size Along a Line
In some cases, we may want to vary the marker size along a line in a scatter plot. This can be achieved by providing an array of sizes that vary along the line. Let’s look at an example:
import matplotlib.pyplot as plt
import numpy as np

x = np.linspace(0, 10, 100)
y = np.sin(x)
sizes = np.abs(y) * 100

fig, ax = plt.subplots()
ax.scatter(x, y, s=sizes)

plt.show()
Output:
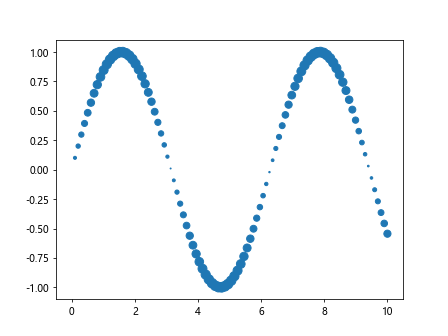
In this example, we create a scatter plot with a line represented by the sine function. We vary the marker size along the line based on the absolute values of the y-coordinates.
Highlighting Specific Data Points
Sometimes, we may want to highlight specific data points in a scatter plot by using larger markers. We can achieve this by providing a different size for the markers of the highlighted data points. Let’s look at an example:
import matplotlib.pyplot as plt

x = [1, 2, 3, 4, 5]
y = [5, 4, 3, 2, 1]
sizes = [50, 100, 150, 200, 250]
highlighted = [1, 3]

fig, ax = plt.subplots()
for i in range(len(x)):
    size = sizes[i] if i not in highlighted else sizes[i] * 2
    ax.scatter(x[i], y[i], s=size)

plt.show()
Output:
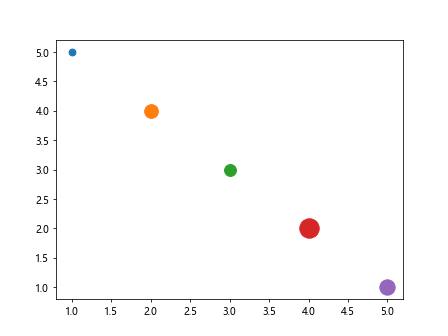
In this example, we highlight data points 1 and 3 in the scatter plot by using larger markers. The size of the markers for the highlighted data points is doubled compared to the other data points.
Adjusting Marker Size in 3D Scatter Plots
In addition to 2D scatter plots, we can also customize the marker size in 3D scatter plots using the ax.scatter function. The process is similar to 2D scatter plots, where we can specify the size of markers using the s parameter. Let’s look at an example:
import matplotlib.pyplot as plt
import numpy as np
from mpl_toolkits.mplot3d import Axes3D

x = np.array([1, 2, 3, 4, 5])
y = np.array([5, 4, 3, 2, 1])
z = np.array([2, 4, 6, 8, 10])
sizes = np.array([50, 100, 150, 200, 250])

fig = plt.figure()
ax = fig.add_subplot(111, projection='3d')
ax.scatter(x, y, z, s=sizes)

plt.show()
Output:
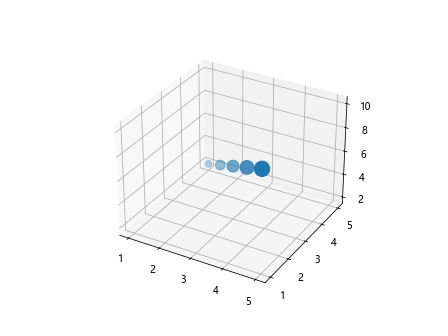
In this example, we create a 3D scatter plot with five data points. We set the size of the markers using the s parameter in the ax.scatter function.
Creating Bubble Charts
Bubble charts are a variation of scatter plots where the size of markers is used to represent a third dimension of the data. We can create bubble charts by customizing the marker size in scatter plots. Let’s look at an example:
import matplotlib.pyplot as plt
import numpy as np

x = np.array([1, 2, 3, 4, 5])
y = np.array([5, 4, 3, 2, 1])
sizes = np.array([50, 100, 150, 200, 250])
colors = np.array([0, 1, 2, 3, 4])

fig, ax = plt.subplots()
for i in range(len(x)):
    ax.scatter(x[i], y[i], s=sizes[i], c=colors[i], cmap='viridis')

plt.show()
Output:
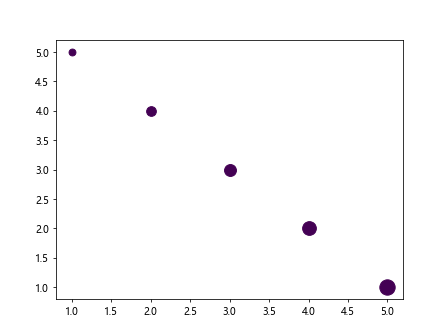
In this example, we create a bubble chart by customizing the marker size and color in the scatter plot. The marker size and color represent two additional dimensions of the data.
Combining Marker Size and Color
We can combine marker size and color to create visually appealing scatter plots that convey multiple dimensions of the data. By customizing both the size and color of markers, we can represent more information in a single plot. Let’s look at an example:
import matplotlib.pyplot as plt
import numpy as np

x = np.array([1, 2, 3, 4, 5])
y = np.array([5, 4, 3, 2, 1])
sizes = np.array([50, 100, 150, 200, 250])
colors = np.array([0, 1, 2, 3, 4])

fig, ax = plt.subplots()
for i in range(len(x)):
    ax.scatter(x[i], y[i], s=sizes[i], c=colors[i], cmap='viridis')

plt.show()
Output:
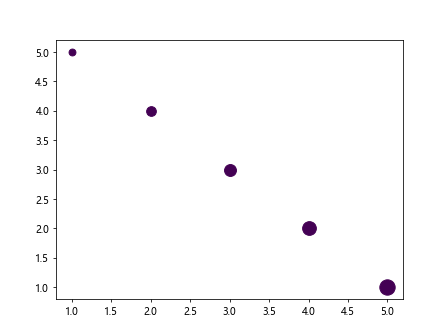
In this example, we combine marker size and color in the scatter plot to represent two additional dimensions of the data. The size and color of the markers vary based on the values in the sizes and colors arrays, respectively.
Adjusting Marker Size in Subplots
When working with multiple subplots, we may want to adjust the marker size independently in each subplot. We can achieve this by customizing the marker size for each subplot separately. Let’s look at an example:
import matplotlib.pyplot as plt
import numpy as np

x = np.array([1, 2, 3, 4, 5])
y = np.array([5, 4, 3, 2, 1])
sizes = np.array([50, 100, 150, 200, 250])

fig, axs = plt.subplots(1, 2, figsize=(10, 5))
axs[0].scatter(x, y, s=sizes)
axs[1].scatter(x, y, s=sizes * 2)

plt.show()
Output:
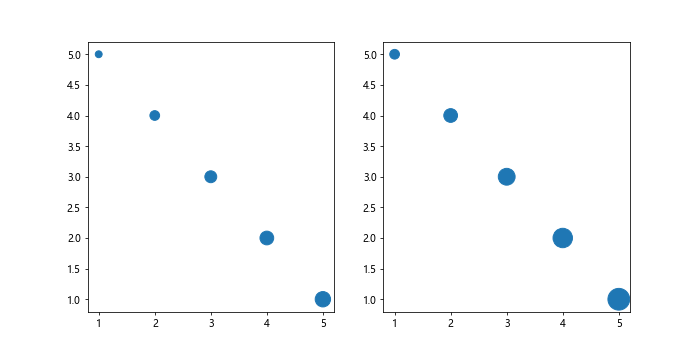
In this example, we create two subplots with different marker sizes. The size of markers in the second subplot is twice as large as in the first subplot.
Ax Scatter Marker Size Conclusion
In this article, we have explored how to adjust the marker size in scatter plots using the ax.scatter function in matplotlib. We discussed setting marker size, customizing marker size based on data, using colormaps to encode marker size, rescaling marker size, varying marker size along a line, highlighting specific data points, adjusting marker size in 3D scatter plots, creating bubble charts, and combining marker size and color. By customizing the marker size, we can create visually appealing scatter plots that effectively represent multiple dimensions of the data.
Remember to experiment with different marker sizes and styles to find the best representation for your data in scatter plots. Feel free to explore additional customization options provided by matplotlib to further enhance your scatter plots.