Ax Scatter Label
In this article, we will discuss how to add labels to scatter plots using the ax.scatter() function in Matplotlib. Scatter plots are used to visualize the relationships between two numerical variables. Adding labels can help provide additional information about the data points on the plot.
Basic Scatter Plot with Labels
Let’s start by creating a basic scatter plot with labels. In this example, we will generate random data points and add labels to the data points.
import matplotlib.pyplot as plt

import numpy as np

# Generate random data
x = np.random.rand(50)
y = np.random.rand(50)
labels = [f'Data point {i}' for i in range(50)]

fig, ax = plt.subplots()
ax.scatter(x, y)

for i, txt in enumerate(labels):
    ax.annotate(txt, (x[i], y[i]))

plt.show()
Output:
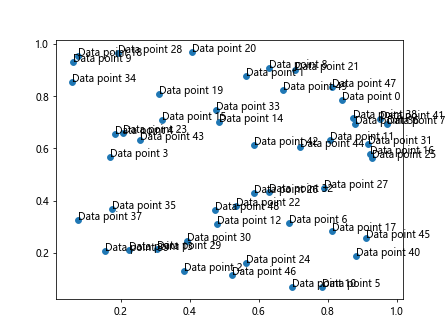
In the code snippet above, we first generate random data points x and y. We also create a list of labels for each data point. We then create a scatter plot using ax.scatter() and add labels to each data point using ax.annotate().
Adding Labels to Specific Data Points
Sometimes, you may want to add labels to specific data points rather than all of them. In the following example, we will demonstrate how to add labels to specific data points on a scatter plot.
import matplotlib.pyplot as plt

x = [1, 2, 3, 4, 5]
y = [5, 4, 3, 2, 1]
labels = ['point A', 'point B', 'point C', 'point D', 'point E']

fig, ax = plt.subplots()
scatter = ax.scatter(x, y)

selected_points = [1, 3, 4]  # indices of data points to label

for i in selected_points:
    ax.annotate(labels[i], (x[i], y[i]))

plt.show()
Output:
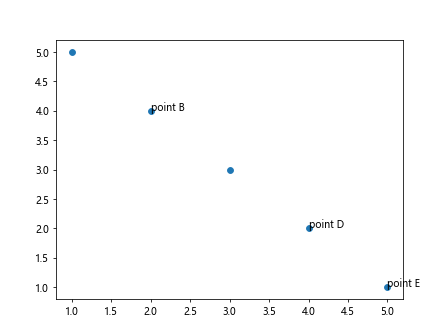
In this example, we create a scatter plot with five data points. We define a list of labels for each data point and specify the indices of the data points to be labeled. The ax.annotate() function is used to add labels to the selected data points.
Customizing Labels
You can also customize the appearance of the labels on the scatter plot. In the following example, we will demonstrate how to change the font size and font style of the labels.
import matplotlib.pyplot as plt

x = [1, 2, 3, 4, 5]
y = [5, 4, 3, 2, 1]
labels = ['A', 'B', 'C', 'D', 'E']

fig, ax = plt.subplots()
scatter = ax.scatter(x, y)

for i, txt in enumerate(labels):
    ax.annotate(txt, (x[i], y[i]), fontsize=12, fontstyle='italic')

plt.show()
Output:
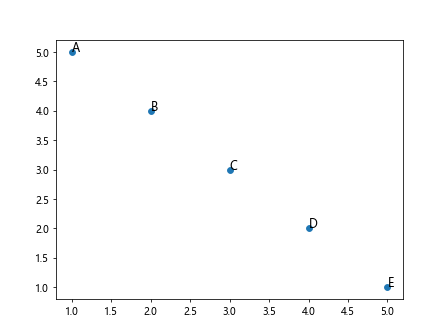
In the code above, we specify the font size and font style of the labels using the fontsize and fontstyle parameters in the ax.annotate() function. This allows you to customize the appearance of the labels on the scatter plot.
Adding Arrow to Labels
You can also add an arrow leading from the data point to its label on the scatter plot. This can help visually connect the label with the corresponding data point. In the following example, we will demonstrate how to add arrows to labels on a scatter plot.
import matplotlib.pyplot as plt

x = [1, 2, 3, 4, 5]
y = [5, 4, 3, 2, 1]
labels = ['A', 'B', 'C', 'D', 'E']

fig, ax = plt.subplots()
scatter = ax.scatter(x, y)

for i, txt in enumerate(labels):
    ax.annotate(txt, (x[i], y[i]), arrowprops=dict(arrowstyle='->'))

plt.show()
Output:
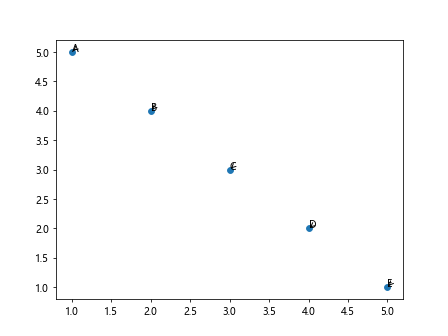
In this example, the arrowprops argument in the ax.annotate() function is used to add an arrow to the label. We specify the arrow style as '->' to create a simple arrow pointing from the data point to the label.
Adding Colors to Labels
You can also customize the colors of the labels on the scatter plot. In the following example, we will demonstrate how to change the color of the labels based on the data points.
import matplotlib.pyplot as plt

x = [1, 2, 3, 4, 5]
y = [5, 4, 3, 2, 1]
labels = ['A', 'B', 'C', 'D', 'E']
colors = ['red', 'blue', 'green', 'purple', 'orange']

fig, ax = plt.subplots()
scatter = ax.scatter(x, y)

for i, txt in enumerate(labels):
    ax.annotate(txt, (x[i], y[i]), color=colors[i])

plt.show()
Output:
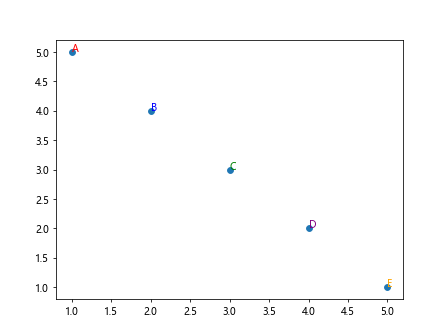
In this code snippet, we define a list of colors corresponding to each data point. We then use the color parameter in the ax.annotate() function to change the color of the labels based on the data points.
Adding Labels to Grouped Data Points
In some cases, you may want to group data points and add labels to each group on the scatter plot. In the following example, we will demonstrate how to add labels to grouped data points.
import matplotlib.pyplot as plt
import numpy as np

x = np.array([1, 2, 3, 4, 5, 1, 2, 3, 4, 5])
y = np.array([5, 4, 3, 2, 1, 1, 2, 3, 4, 5])
labels = ['Group A', 'Group A', 'Group A', 'Group A', 'Group A', 'Group B', 'Group B', 'Group B', 'Group B', 'Group B']

fig, ax = plt.subplots()
scatter = ax.scatter(x, y)

for i, txt in enumerate(labels):
    ax.annotate(txt, (x[i], y[i]))

plt.show()
Output:
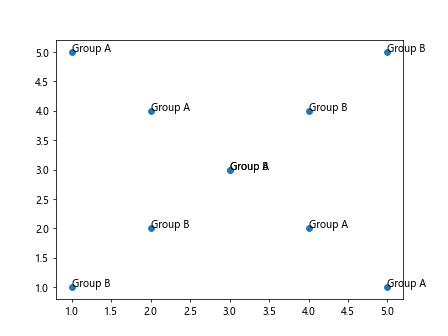
In this example, we create two groups of data points and assign group labels to each data point. We then use the ax.annotate() function to add group labels to the data points on the scatter plot.
Adding Labels with Different Background Color
You can further customize the appearance of the labels by adding a background color. This can help improve the readability of the labels on the scatter plot. In the following example, we will demonstrate how to add labels with a different background color.
import matplotlib.pyplot as plt

x = [1, 2, 3, 4, 5]
y = [5, 4, 3, 2, 1]
labels = ['A', 'B', 'C', 'D', 'E']

fig, ax = plt.subplots()
scatter = ax.scatter(x, y)

for i, txt in enumerate(labels):
    ax.annotate(txt, (x[i], y[i]), bbox=dict(facecolor='white', edgecolor='black'))

plt.show()
Output:
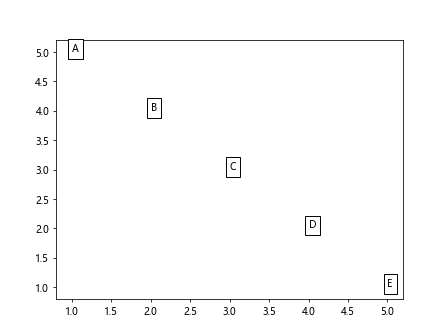
In this code snippet, we use the bbox argument in the ax.annotate() function to add a background color to the labels. We specify the face color as 'white' and the edge color as 'black' to create labels with a different background color.
Adding Labels to a Plot with Multiple Data Series
If you have a scatter plot with multiple data series, you can add labels to each data series to distinguish them on the plot. In the following example, we will demonstrate how to add labels to a plot with multiple data series.
import matplotlib.pyplot as plt
import numpy as np

x1 = np.random.rand(50)
y1 = np.random.rand(50)

x2 = np.random.rand(50)
y2 = np.random.rand(50)

fig, ax = plt.subplots()
scatter1 = ax.scatter(x1, y1, label='Data Series 1')
scatter2 = ax.scatter(x2, y2, label='Data Series 2')

ax.legend()

for i, txt in enumerate(range(50)):
    ax.annotate(txt, (x1[i], y1[i]))

for i, txt in enumerate(range(50)):
    ax.annotate(txt, (x2[i], y2[i]))

plt.show()
Output:
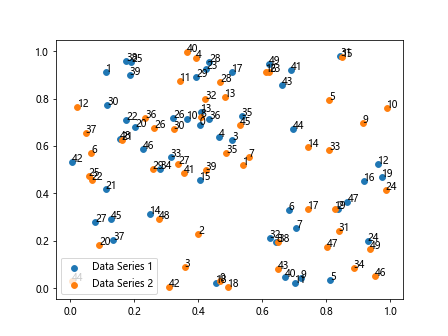
In this example, we create a scatter plot with two data series. We add labels to each data series using the label argumentin the ax.scatter() function to distinguish them on the plot. We then use the ax.legend() function to display a legend on the plot, indicating the labels of each data series. Finally, we add labels to each data point in both data series using the ax.annotate() function.
Adding Numbered Labels
Sometimes, you may want to add numbered labels to the data points on the scatter plot for easier reference. In the following example, we will demonstrate how to add numbered labels to the data points.
import matplotlib.pyplot as plt
import numpy as np

x = np.random.rand(50)
y = np.random.rand(50)

fig, ax = plt.subplots()
scatter = ax.scatter(x, y)

for i in range(len(x)):
    ax.annotate(i, (x[i], y[i]))

plt.show()
Output:
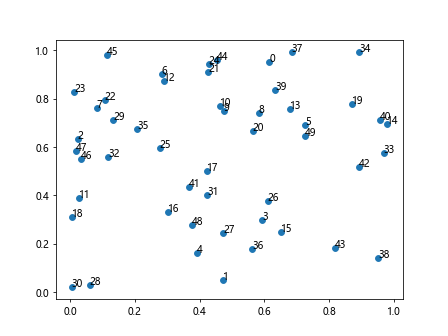
In this code snippet, we generate random data points and add numbered labels to each data point using the index of the data point in the dataset. The ax.annotate() function is used to add numbered labels to the data points on the scatter plot.
Adding Text Rotation to Labels
You can also rotate the text of the labels on the scatter plot to improve their readability, especially when the labels overlap with each other. In the following example, we will demonstrate how to add text rotation to the labels.
import matplotlib.pyplot as plt
import numpy as np

x = np.random.rand(50)
y = np.random.rand(50)

fig, ax = plt.subplots()
scatter = ax.scatter(x, y)

for i in range(len(x)):
    ax.annotate(i, (x[i], y[i]), rotation=45)

plt.show()
Output:
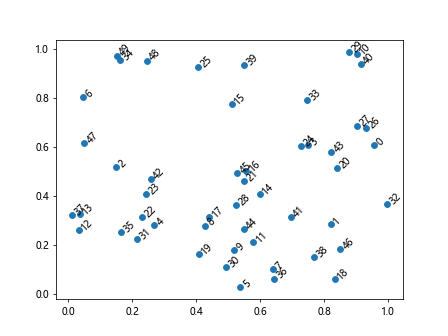
In this example, we use the rotation parameter in the ax.annotate() function to rotate the text of the labels by 45 degrees. This allows you to customize the orientation of the labels on the scatter plot.
Adding Labels with Shadow
You can add a shadow effect to the labels on the scatter plot to make them stand out visually. In the following example, we will demonstrate how to add labels with a shadow effect.
import matplotlib.pyplot as plt
import numpy as np

x = np.random.rand(50)
y = np.random.rand(50)

fig, ax = plt.subplots()
scatter = ax.scatter(x, y)

for i in range(len(x)):
    ax.annotate(i, (x[i], y[i]), shadow=True)

plt.show()
In this code snippet, the shadow parameter in the ax.annotate() function is used to add a shadow effect to the labels. Setting shadow=True creates a shadow effect behind the text of the labels on the scatter plot.
Ax Scatter Label Conclusion
In this article, we have explored various ways to add labels to scatter plots using the ax.scatter() function in Matplotlib. Labels can provide additional information about the data points and improve the interpretability of the plot. By customizing the appearance and positioning of the labels, you can create informative and visually appealing scatter plots for data visualization. Experiment with the examples provided to enhance your scatter plots with labels in your own projects.