Adding Labels to Scatter Plots in Matplotlib
In this tutorial, we will learn how to add labels to scatter plots in Matplotlib. Scatter plots are a great way to visualize the relationship between two variables. However, sometimes it is necessary to add labels to the data points to provide additional context or information.
Basic Scatter Plot with Labels
Let’s start by creating a basic scatter plot with labels. We will randomly generate some data points and plot them using the scatter function in Matplotlib. Then, we will add labels to each data point using the text function.
import matplotlib.pyplot as plt
import numpy as np

# Generate random data
x = np.random.rand(10)
y = np.random.rand(10)

# Create a scatter plot
plt.scatter(x, y)

# Add labels to each data point
for i, txt in enumerate(['A', 'B', 'C', 'D', 'E', 'F', 'G', 'H', 'I', 'J']):
    plt.text(x[i], y[i], txt, color='red')

plt.show()
Output:
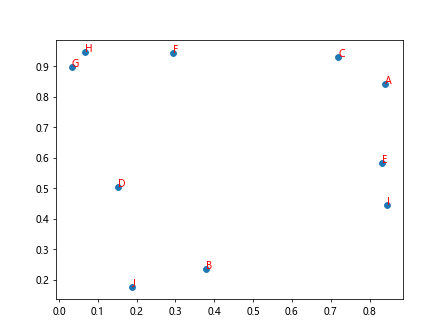
In this example, we generate 10 random data points and assign labels ‘A’ to ‘J’ to each point. We use the text function to add these labels to the plot.
Customizing Labels
You can customize the labels by changing their font size, color, and style. Let’s see an example where we customize the labels on a scatter plot.
import matplotlib.pyplot as plt
import numpy as np

# Generate random data
x = np.random.rand(10)
y = np.random.rand(10)

# Create a scatter plot
plt.scatter(x, y)

# Add formatted labels to each data point
for i, txt in enumerate(['One', 'Two', 'Three', 'Four', 'Five', 'Six', 'Seven', 'Eight', 'Nine', 'Ten']):
    plt.text(x[i], y[i], txt, color='blue', fontsize=12, fontweight='bold', ha='center', va='bottom')

plt.show()
Output:
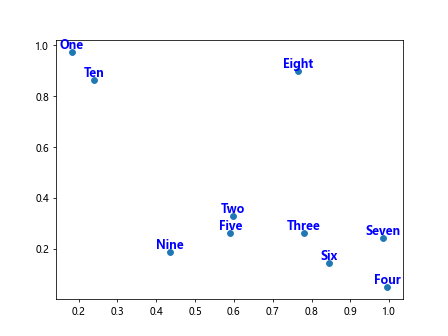
In this example, we changed the color of the labels to blue, increased the font size to 12, made the font weight bold, aligned the text centrally horizontally (ha) and aligned the text at the bottom vertically (va).
Adding Labels to Selected Points
Sometimes, you may want to add labels only to specific data points in your scatter plot. Let’s see an example where we add labels to selected points based on a condition.
import matplotlib.pyplot as plt
import numpy as np

# Generate random data
x = np.random.rand(10)
y = np.random.rand(10)

# Create a scatter plot
plt.scatter(x, y)

# Add labels to selected data points
for i in range(10):
    if y[i] > 0.5:
        plt.text(x[i], y[i], f'Point {i}', color='green')

plt.show()
Output:
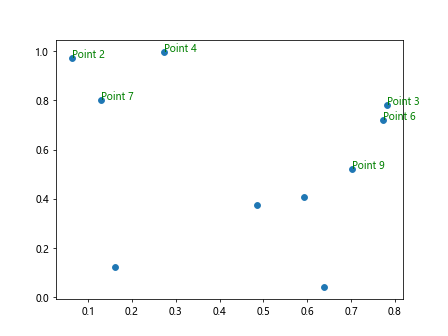
In this example, we add labels only to the data points where the y value is greater than 0.5. This demonstrates how you can selectively add labels to specific points in a scatter plot.
Adding Labels with Annotations
In addition to adding simple text labels, you can also use annotations to add more information to your scatter plots. Annotations can include text, arrows, and other elements.
import matplotlib.pyplot as plt
import numpy as np

# Generate random data
x = np.random.rand(10)
y = np.random.rand(10)

# Create a scatter plot
plt.scatter(x, y)

# Add annotations to specific data points
for i in range(10):
    if x[i] > 0.5:
        plt.annotate(f'Point {i}', (x[i], y[i]), xytext=(x[i]+0.1, y[i]+0.1), arrowprops=dict(facecolor='red'))

plt.show()
Output:
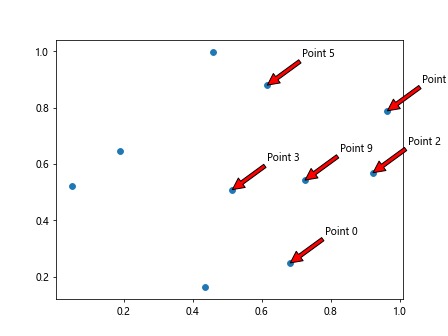
In this example, we use the annotate function to add annotations to data points where the x value is greater than 0.5. We provide the text for the annotation, the position of the data point, the position of the text, and customize the arrow’s appearance.
Adding Labels with Legend
If you have multiple groups of data in your scatter plot, you can use a legend to differentiate between them. Let’s see an example where we add labels with a legend to a scatter plot.
import matplotlib.pyplot as plt
import numpy as np

# Generate random data
x1 = np.random.rand(10)
y1 = np.random.rand(10)

x2 = np.random.rand(10)
y2 = np.random.rand(10)

# Create a scatter plot with legends
plt.scatter(x1, y1, label='Group 1', color='red')
plt.scatter(x2, y2, label='Group 2', color='blue')

plt.legend()

plt.show()
Output:
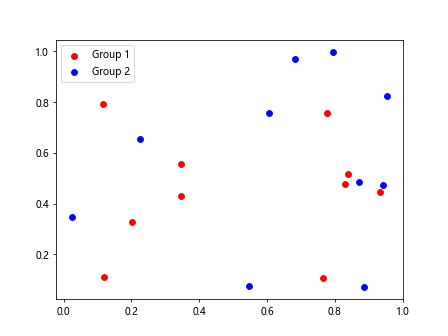
In this example, we have two groups of data points (Group 1 and Group 2) displayed on the scatter plot. We differentiate between them using different colors and provide a legend to explain which group each color represents.
Adding Labels to Scatter Plots in Matplotlib Conclusion
In this tutorial, we learned how to add labels to scatter plots in Matplotlib. Labels provide additional information and context to the data points in the plot. We explored various ways to add labels, customize their appearance, and selectively add labels to specific data points. Play around with these examples to create visually appealing scatter plots with informative labels.