How to Set the Number of Ticks in plt.colorbar in Matplotlib
Setting the Number of Ticks in plt.colorbar in Matplotlib is an essential skill for data visualization enthusiasts and professionals alike. This article will delve deep into the intricacies of manipulating colorbar ticks in Matplotlib, providing you with a thorough understanding of the process and equipping you with practical examples to enhance your plotting capabilities.
Understanding the Basics of Setting the Number of Ticks in plt.colorbar
Before we dive into the specifics of Setting the Number of Ticks in plt.colorbar in Matplotlib, it’s crucial to grasp the fundamental concepts. A colorbar in Matplotlib is a visual representation of the mapping between color-coded values and their corresponding numerical values. By Setting the Number of Ticks in plt.colorbar, you can control the granularity of this mapping, making your visualizations more informative and easier to interpret.
Let’s start with a simple example to illustrate the concept of Setting the Number of Ticks in plt.colorbar:
import matplotlib.pyplot as plt
import numpy as np

# Create sample data
data = np.random.rand(10, 10)

# Create a figure and axis
fig, ax = plt.subplots()

# Create a color-mapped plot
im = ax.imshow(data, cmap='viridis')

# Add a colorbar
cbar = plt.colorbar(im)

# Set the number of ticks in the colorbar
cbar.set_ticks(np.linspace(0, 1, 6))

plt.title('Setting the Number of Ticks in plt.colorbar - how2matplotlib.com')
plt.show()
Output:
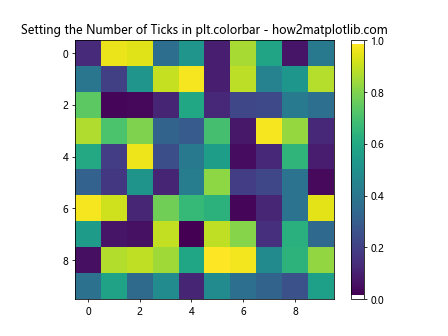
In this example, we’ve created a simple heatmap using imshow() and added a colorbar using plt.colorbar(). The key line for Setting the Number of Ticks in plt.colorbar is cbar.set_ticks(np.linspace(0, 1, 6)), which sets 6 evenly spaced ticks between 0 and 1.
Advanced Techniques for Setting the Number of Ticks in plt.colorbar
Now that we’ve covered the basics, let’s explore some more advanced techniques for Setting the Number of Ticks in plt.colorbar in Matplotlib. These methods will give you greater control over the appearance and functionality of your colorbars.
Using LogLocator for Setting the Number of Ticks in plt.colorbar
When dealing with data that spans multiple orders of magnitude, Setting the Number of Ticks in plt.colorbar using a logarithmic scale can be beneficial. Here’s an example:
import matplotlib.pyplot as plt
import numpy as np
from matplotlib.colors import LogNorm
from matplotlib.ticker import LogLocator

# Create sample data
data = np.random.rand(10, 10) * 1000

# Create a figure and axis
fig, ax = plt.subplots()

# Create a color-mapped plot with logarithmic scale
im = ax.imshow(data, norm=LogNorm(), cmap='viridis')

# Add a colorbar
cbar = plt.colorbar(im)

# Set the number of ticks in the colorbar using LogLocator
cbar.locator = LogLocator(numticks=5)
cbar.update_ticks()

plt.title('LogLocator for Setting the Number of Ticks in plt.colorbar - how2matplotlib.com')
plt.show()
Output:
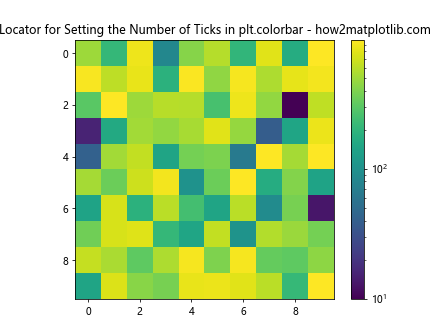
In this example, we use LogLocator to set the number of ticks in the colorbar. This is particularly useful when Setting the Number of Ticks in plt.colorbar for data with a wide range of values.
Custom Tick Locations for Setting the Number of Ticks in plt.colorbar
Sometimes, you may want to have more control over the exact locations of ticks when Setting the Number of Ticks in plt.colorbar. Here’s how you can achieve this:
import matplotlib.pyplot as plt
import numpy as np

# Create sample data
data = np.random.rand(10, 10)

# Create a figure and axis
fig, ax = plt.subplots()

# Create a color-mapped plot
im = ax.imshow(data, cmap='viridis')

# Add a colorbar
cbar = plt.colorbar(im)

# Set custom tick locations
custom_ticks = [0.1, 0.3, 0.5, 0.7, 0.9]
cbar.set_ticks(custom_ticks)

plt.title('Custom Tick Locations for Setting the Number of Ticks in plt.colorbar - how2matplotlib.com')
plt.show()
Output:
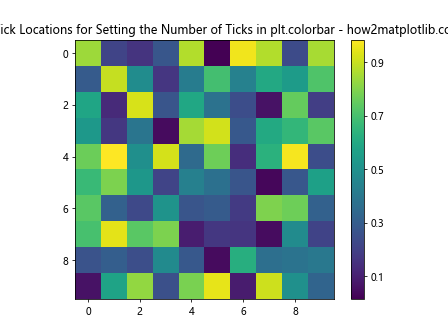
This example demonstrates how to set custom tick locations when Setting the Number of Ticks in plt.colorbar, giving you precise control over where the ticks appear.
Formatting Tick Labels When Setting the Number of Ticks in plt.colorbar
Setting the Number of Ticks in plt.colorbar is not just about positioning; it’s also about presenting the information clearly. Let’s explore how to format tick labels when Setting the Number of Ticks in plt.colorbar.
Using Scientific Notation When Setting the Number of Ticks in plt.colorbar
For large numbers, scientific notation can be a cleaner way of presenting tick labels when Setting the Number of Ticks in plt.colorbar:
import matplotlib.pyplot as plt
import numpy as np
from matplotlib.ticker import ScalarFormatter, FormatStrFormatter

# Create sample data
data = np.random.rand(10, 10) * 1e6

# Create a figure and axis
fig, ax = plt.subplots()

# Create a color-mapped plot
im = ax.imshow(data, cmap='viridis')

# Add a colorbar
cbar = plt.colorbar(im)

# Set the number of ticks and use scientific notation
cbar.set_ticks(np.linspace(data.min(), data.max(), 5))
cbar.formatter = ScalarFormatter(useMathText=True)
cbar.formatter.set_scientific(True)
cbar.formatter.set_powerlimits((0, 0))
cbar.update_ticks()

plt.title('Scientific Notation When Setting the Number of Ticks in plt.colorbar - how2matplotlib.com')
plt.show()
Output:
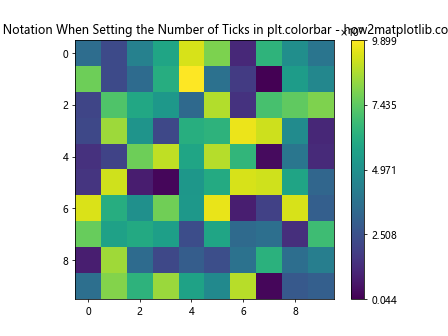
This example shows how to use scientific notation when Setting the Number of Ticks in plt.colorbar, which is particularly useful for large numbers.
Percentage Formatting When Setting the Number of Ticks in plt.colorbar
For data representing percentages, you might want to format your tick labels accordingly when Setting the Number of Ticks in plt.colorbar:
import matplotlib.pyplot as plt
import numpy as np

# Create sample data
data = np.random.rand(10, 10)

# Create a figure and axis
fig, ax = plt.subplots()

# Create a color-mapped plot
im = ax.imshow(data, cmap='viridis')

# Add a colorbar
cbar = plt.colorbar(im)

# Set the number of ticks and format as percentages
cbar.set_ticks(np.linspace(0, 1, 6))
cbar.set_ticklabels([f'{x:.0%}' for x in cbar.get_ticks()])

plt.title('Percentage Formatting When Setting the Number of Ticks in plt.colorbar - how2matplotlib.com')
plt.show()
Output:
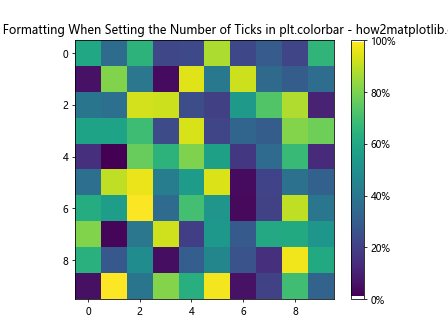
This example demonstrates how to format tick labels as percentages when Setting the Number of Ticks in plt.colorbar, which can be useful for data representing proportions or percentages.
Customizing Colorbar Appearance When Setting the Number of Ticks in plt.colorbar
While Setting the Number of Ticks in plt.colorbar is important, the overall appearance of the colorbar can greatly enhance your visualization. Let’s explore some ways to customize the colorbar appearance in conjunction with Setting the Number of Ticks in plt.colorbar.
Changing Colorbar Orientation When Setting the Number of Ticks in plt.colorbar
By default, colorbars are vertical, but you can change their orientation when Setting the Number of Ticks in plt.colorbar:
import matplotlib.pyplot as plt
import numpy as np

# Create sample data
data = np.random.rand(10, 10)

# Create a figure and axis
fig, ax = plt.subplots()

# Create a color-mapped plot
im = ax.imshow(data, cmap='viridis')

# Add a horizontal colorbar
cbar = plt.colorbar(im, orientation='horizontal')

# Set the number of ticks
cbar.set_ticks(np.linspace(0, 1, 5))

plt.title('Horizontal Colorbar When Setting the Number of Ticks in plt.colorbar - how2matplotlib.com')
plt.show()
Output:
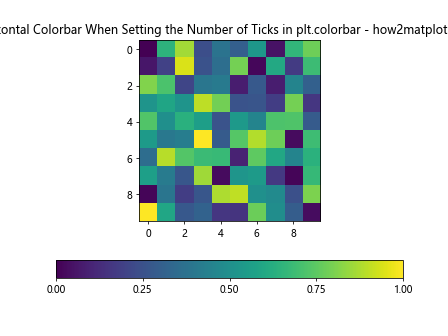
This example shows how to create a horizontal colorbar when Setting the Number of Ticks in plt.colorbar, which can be useful for certain layout configurations.
Adjusting Colorbar Size When Setting the Number of Ticks in plt.colorbar
You can also control the size of your colorbar when Setting the Number of Ticks in plt.colorbar:
import matplotlib.pyplot as plt
import numpy as np
from mpl_toolkits.axes_grid1 import make_axes_locatable

# Create sample data
data = np.random.rand(10, 10)

# Create a figure and axis
fig, ax = plt.subplots()

# Create a color-mapped plot
im = ax.imshow(data, cmap='viridis')

# Create an axes on the right side of ax. The width of cax will be 5%
# of ax and the padding between cax and ax will be fixed at 0.05 inch.
divider = make_axes_locatable(ax)
cax = divider.append_axes("right", size="5%", pad=0.05)

# Add a colorbar to the new axes
cbar = plt.colorbar(im, cax=cax)

# Set the number of ticks
cbar.set_ticks(np.linspace(0, 1, 6))

plt.title('Adjusting Colorbar Size When Setting the Number of Ticks in plt.colorbar - how2matplotlib.com')
plt.show()
Output:
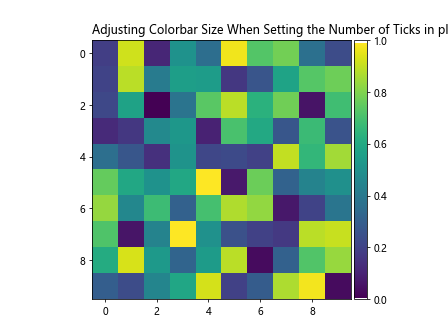
This example demonstrates how to adjust the size of the colorbar when Setting the Number of Ticks in plt.colorbar, allowing you to fine-tune the layout of your visualization.
Advanced Colorbar Customization When Setting the Number of Ticks in plt.colorbar
Let’s explore some more advanced techniques for customizing colorbars when Setting the Number of Ticks in plt.colorbar in Matplotlib.
Using Multiple Colorbars When Setting the Number of Ticks in plt.colorbar
In some cases, you might need to use multiple colorbars in a single plot. Here’s how you can do this while Setting the Number of Ticks in plt.colorbar for each:
import matplotlib.pyplot as plt
import numpy as np

# Create sample data
data1 = np.random.rand(10, 10)
data2 = np.random.rand(10, 10) * 100

# Create a figure and two subplots
fig, (ax1, ax2) = plt.subplots(1, 2, figsize=(12, 5))

# Create color-mapped plots
im1 = ax1.imshow(data1, cmap='viridis')
im2 = ax2.imshow(data2, cmap='plasma')

# Add colorbars to each subplot
cbar1 = plt.colorbar(im1, ax=ax1)
cbar2 = plt.colorbar(im2, ax=ax2)

# Set the number of ticks for each colorbar
cbar1.set_ticks(np.linspace(0, 1, 6))
cbar2.set_ticks(np.linspace(0, 100, 6))

ax1.set_title('Colorbar 1 - how2matplotlib.com')
ax2.set_title('Colorbar 2 - how2matplotlib.com')
plt.suptitle('Multiple Colorbars When Setting the Number of Ticks in plt.colorbar')
plt.show()
Output:
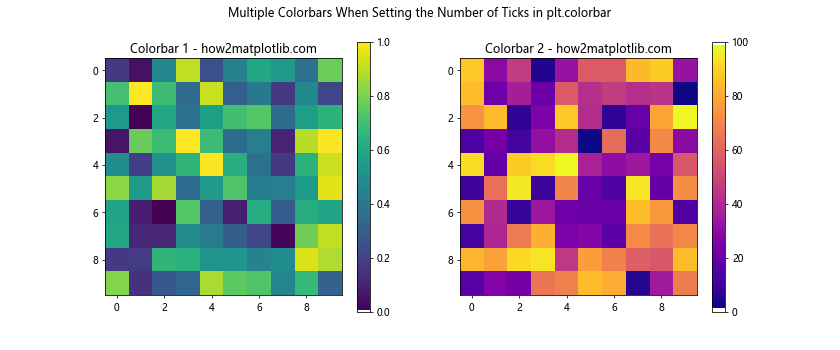
This example shows how to create and customize multiple colorbars when Setting the Number of Ticks in plt.colorbar, which can be useful when comparing different datasets or metrics in a single figure.
Creating a Discrete Colorbar When Setting the Number of Ticks in plt.colorbar
Sometimes, you might want to create a discrete colorbar instead of a continuous one. Here’s how you can do this while Setting the Number of Ticks in plt.colorbar:
import matplotlib.pyplot as plt
import numpy as np
from matplotlib.colors import BoundaryNorm
from matplotlib.cm import ScalarMappable

# Create sample data
data = np.random.randint(0, 5, (10, 10))

# Define the color map
cmap = plt.cm.get_cmap('viridis', 5)

# Create a figure and axis
fig, ax = plt.subplots()

# Create a discrete color-mapped plot
im = ax.imshow(data, cmap=cmap)

# Create a BoundaryNorm instance
bounds = np.arange(6)
norm = BoundaryNorm(bounds, cmap.N)

# Create a ScalarMappable and initialize a colorbar
sm = ScalarMappable(cmap=cmap, norm=norm)
sm.set_array([])

# Add a colorbar
cbar = plt.colorbar(sm)

# Set the number of ticks
cbar.set_ticks(np.arange(5) + 0.5)
cbar.set_ticklabels(['A', 'B', 'C', 'D', 'E'])

plt.title('Discrete Colorbar When Setting the Number of Ticks in plt.colorbar - how2matplotlib.com')
plt.show()
This example demonstrates how to create a discrete colorbar when Setting the Number of Ticks in plt.colorbar, which can be useful for categorical data or when you want to emphasize distinct levels in your data.
Handling Edge Cases When Setting the Number of Ticks in plt.colorbar
When Setting the Number of Ticks in plt.colorbar, you may encounter some edge cases that require special handling. Let’s explore a few of these scenarios.
Dealing with Outliers When Setting the Number of Ticks in plt.colorbar
Sometimes, outliers in your data can make it challenging to set appropriate ticks. Here’s how you can handle this when Setting the Number of Ticks in plt.colorbar:
import matplotlib.pyplot as plt
import numpy as np

# Create sample data with outliers
data = np.random.rand(10, 10)
data[0, 0] = 10  # Add an outlier

# Create a figure and axis
fig, ax = plt.subplots()

# Create a color-mapped plot
im = ax.imshow(data, cmap='viridis')

# Add a colorbar
cbar = plt.colorbar(im)

# Set the number of ticks, excluding the outlier
vmin, vmax = np.percentile(data, [5, 95])
cbar.set_ticks(np.linspace(vmin, vmax, 5))

# Extend the colorbar
cbar.extend = 'both'

plt.title('Handling Outliers When Setting the Number of Ticks in plt.colorbar - how2matplotlib.com')
plt.show()
Output:
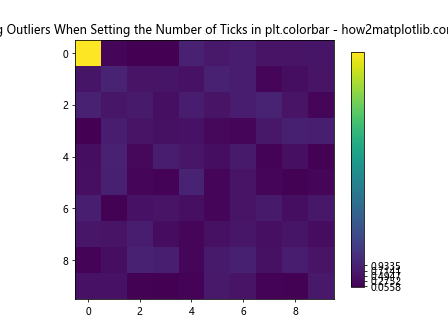
This example shows how to handle outliers when Setting the Number of Ticks in plt.colorbar by using percentiles to set the tick range and extending the colorbar to indicate values outside this range.
Setting the Number of Ticks in plt.colorbar for Diverging Color Maps
When using diverging color maps, you might want to ensure that your colorbar is centered at zero. Here’s how you can achieve this while Setting the Number of Ticks in plt.colorbar:
import matplotlib.pyplot as plt
import numpy as np

# Create sample data with positive and negative values
data = np.random.randn(10, 10)

# Create a figure and axis
fig, ax = plt.subplots()

# Create a color-mapped plot with a diverging colormap
im = ax.imshow(data, cmap='RdBu_r')

# Add a colorbar
cbar = plt.colorbar(im)

# Set the number of ticksvmax = max(abs(data.min()), abs(data.max()))
ticks = np.linspace(-vmax, vmax, 7)
cbar.set_ticks(ticks)

plt.title('Diverging Colormap When Setting the Number of Ticks in plt.colorbar - how2matplotlib.com')
plt.show()
This example demonstrates how to set symmetric ticks around zero when Setting the Number of Ticks in plt.colorbar for a diverging color map, ensuring that positive and negative values are represented equally.
Best Practices for Setting the Number of Ticks in plt.colorbar
When Setting the Number of Ticks in plt.colorbar, there are several best practices to keep in mind to ensure your visualizations are clear and informative.
Choosing the Right Number of Ticks When Setting the Number of Ticks in plt.colorbar
The optimal number of ticks depends on various factors, including the size of your plot and the range of your data. Here’s an example that demonstrates how to choose an appropriate number of ticks:
import matplotlib.pyplot as plt
import numpy as np

# Create sample data
data = np.random.rand(10, 10)

# Create a figure and axis
fig, ax = plt.subplots(figsize=(8, 6))

# Create a color-mapped plot
im = ax.imshow(data, cmap='viridis')

# Add a colorbar
cbar = plt.colorbar(im)

# Set the number of ticks based on the figure size
num_ticks = int(fig.get_figheight() * 2)  # 2 ticks per inch
cbar.set_ticks(np.linspace(0, 1, num_ticks))

plt.title('Choosing the Right Number of Ticks - how2matplotlib.com')
plt.show()
Output:
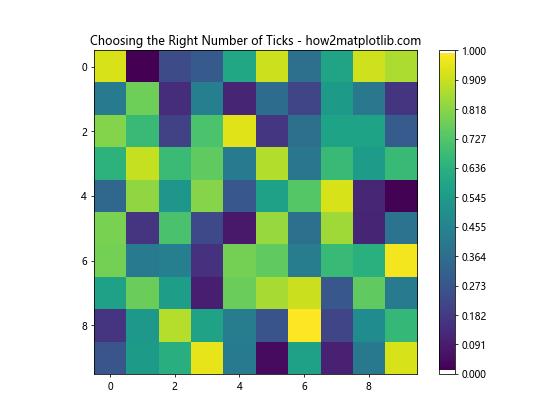
This example shows how to choose the number of ticks based on the figure size when Setting the Number of Ticks in plt.colorbar, ensuring that the ticks are neither too sparse nor too crowded.
Aligning Ticks with Data Range When Setting the Number of Ticks in plt.colorbar
It’s important to ensure that your ticks align well with your data range when Setting the Number of Ticks in plt.colorbar. Here’s an example:
import matplotlib.pyplot as plt
import numpy as np

# Create sample data
data = np.random.uniform(10, 50, (10, 10))

# Create a figure and axis
fig, ax = plt.subplots()

# Create a color-mapped plot
im = ax.imshow(data, cmap='viridis')

# Add a colorbar
cbar = plt.colorbar(im)

# Set the number of ticks aligned with data range
vmin, vmax = data.min(), data.max()
ticks = np.linspace(np.floor(vmin), np.ceil(vmax), 5)
cbar.set_ticks(ticks)

plt.title('Aligning Ticks with Data Range - how2matplotlib.com')
plt.show()
Output:
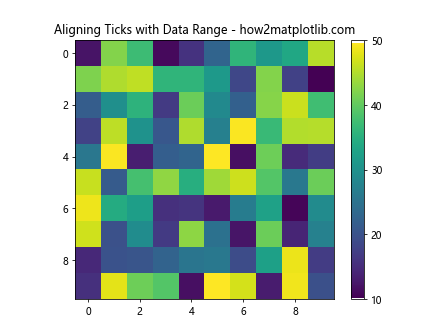
This example demonstrates how to align ticks with the data range when Setting the Number of Ticks in plt.colorbar, making it easier for viewers to interpret the values in your visualization.
Troubleshooting Common Issues When Setting the Number of Ticks in plt.colorbar
Even experienced users can encounter issues when Setting the Number of Ticks in plt.colorbar. Let’s explore some common problems and their solutions.
Dealing with Overlapping Ticks When Setting the Number of Ticks in plt.colorbar
If you set too many ticks, they might overlap and become unreadable. Here’s how to address this issue:
import matplotlib.pyplot as plt
import numpy as np

# Create sample data
data = np.random.rand(10, 10)

# Create a figure and axis
fig, ax = plt.subplots()

# Create a color-mapped plot
im = ax.imshow(data, cmap='viridis')

# Add a colorbar
cbar = plt.colorbar(im)

# Set a large number of ticks
cbar.set_ticks(np.linspace(0, 1, 20))

# Rotate and align the tick labels so they don't overlap
plt.setp(cbar.ax.get_yticklabels(), rotation=-45, ha='left', rotation_mode='anchor')

plt.title('Dealing with Overlapping Ticks - how2matplotlib.com')
plt.tight_layout()
plt.show()
Output:
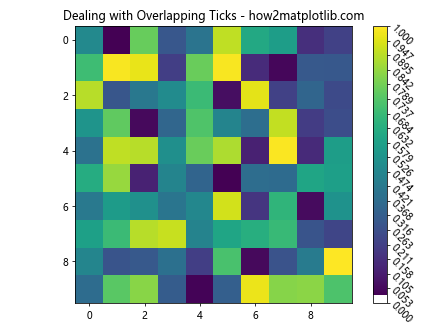
This example shows how to handle overlapping ticks when Setting the Number of Ticks in plt.colorbar by rotating the tick labels.
Fixing Misaligned Ticks When Setting the Number of Ticks in plt.colorbar
Sometimes, ticks might not align perfectly with your data. Here’s how to fix this issue:
import matplotlib.pyplot as plt
import numpy as np

# Create sample data
data = np.random.uniform(10, 50, (10, 10))

# Create a figure and axis
fig, ax = plt.subplots()

# Create a color-mapped plot
im = ax.imshow(data, cmap='viridis')

# Add a colorbar
cbar = plt.colorbar(im)

# Set ticks and ensure they align with data
vmin, vmax = data.min(), data.max()
ticks = np.linspace(vmin, vmax, 6)
cbar.set_ticks(ticks)
cbar.set_ticklabels([f'{tick:.1f}' for tick in ticks])

plt.title('Fixing Misaligned Ticks - how2matplotlib.com')
plt.show()
Output:
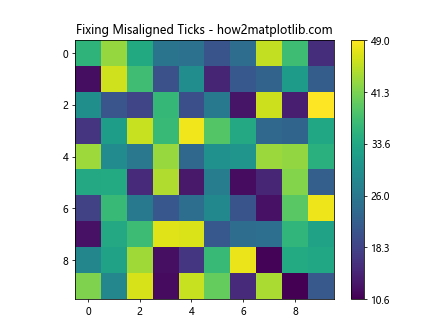
This example demonstrates how to ensure ticks align perfectly with your data when Setting the Number of Ticks in plt.colorbar.
Advanced Topics in Setting the Number of Ticks in plt.colorbar
For those looking to further enhance their skills in Setting the Number of Ticks in plt.colorbar, let’s explore some advanced topics.
Using Callbacks for Dynamic Tick Setting in plt.colorbar
You can use callbacks to dynamically update the number of ticks in your colorbar based on user interactions:
import matplotlib.pyplot as plt
import numpy as np

# Create sample data
data = np.random.rand(10, 10)

# Create a figure and axis
fig, ax = plt.subplots()

# Create a color-mapped plot
im = ax.imshow(data, cmap='viridis')

# Add a colorbar
cbar = plt.colorbar(im)

# Function to update ticks
def update_ticks(val):
    num_ticks = int(val)
    cbar.set_ticks(np.linspace(0, 1, num_ticks))
    plt.draw()

# Add a slider for controlling the number of ticks
ax_slider = plt.axes([0.2, 0.02, 0.6, 0.03])
slider = plt.Slider(ax_slider, 'Num Ticks', 2, 10, valinit=5, valstep=1)
slider.on_changed(update_ticks)

plt.suptitle('Dynamic Tick Setting with Callbacks - how2matplotlib.com')
plt.show()
Output:
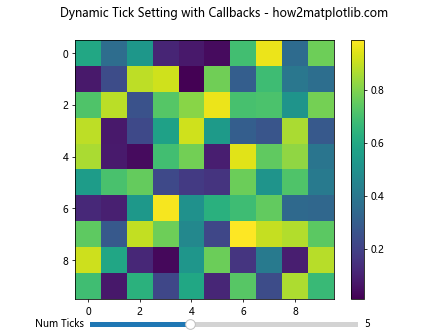
This advanced example shows how to use callbacks to dynamically update the number of ticks when Setting the Number of Ticks in plt.colorbar based on user input via a slider.
Creating Custom Tick Locators for plt.colorbar
For complex data distributions, you might need to create custom tick locators when Setting the Number of Ticks in plt.colorbar:
import matplotlib.pyplot as plt
import numpy as np
from matplotlib.ticker import Locator

class CustomLocator(Locator):
    def __init__(self, num_ticks=5):
        self.num_ticks = num_ticks

    def __call__(self):
        vmin, vmax = self.axis.get_view_interval()
        return np.linspace(vmin, vmax, self.num_ticks)

# Create sample data
data = np.random.exponential(1, (10, 10))

# Create a figure and axis
fig, ax = plt.subplots()

# Create a color-mapped plot
im = ax.imshow(data, cmap='viridis')

# Add a colorbar with custom locator
cbar = plt.colorbar(im)
cbar.locator = CustomLocator(7)
cbar.update_ticks()

plt.title('Custom Tick Locator - how2matplotlib.com')
plt.show()
Output:
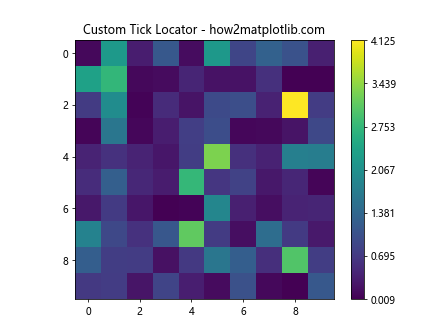
This example demonstrates how to create and use a custom tick locator when Setting the Number of Ticks in plt.colorbar, allowing for more complex tick placement strategies.
Conclusion
Setting the Number of Ticks in plt.colorbar is a crucial skill for creating informative and visually appealing data visualizations with Matplotlib. Throughout this comprehensive guide, we’ve explored various aspects of Setting the Number of Ticks in plt.colorbar, from basic techniques to advanced customization options.
We’ve covered topics such as using different types of locators, formatting tick labels, handling edge cases, and even creating custom solutions for Setting the Number of Ticks in plt.colorbar. By mastering these techniques, you’ll be able to create colorbars that perfectly complement your data visualizations, making them more informative and easier to interpret.
Remember, the key to effective visualization lies in finding the right balance when Setting the Number of Ticks in plt.colorbar. Too few ticks might not provide enough information, while too many can clutter your plot. Always consider your data, your audience, and the overall purpose of your visualization when Setting the Number of Ticks in plt.colorbar.