How to Create a Scatter Plot on Polar Axis using Matplotlib
Scatter Plot on Polar Axis using Matplotlib is a powerful visualization technique that allows you to represent data points in a circular coordinate system. This article will explore the various aspects of creating and customizing scatter plots on polar axes using Matplotlib, a popular plotting library in Python. We’ll cover everything from basic concepts to advanced techniques, providing you with a thorough understanding of how to leverage this visualization method effectively.
Understanding Scatter Plots on Polar Axes
Before diving into the specifics of creating a Scatter Plot on Polar Axis using Matplotlib, it’s essential to understand the concept and its applications. A scatter plot on a polar axis is a type of graph that displays data points in a circular coordinate system, where the position of each point is determined by its angle (theta) and distance from the center (radius).
This type of visualization is particularly useful for displaying data with cyclic patterns, such as seasonal variations, directional data, or periodic phenomena. By using a Scatter Plot on Polar Axis using Matplotlib, you can effectively represent relationships between angular and radial variables, making it easier to identify patterns and trends that might not be apparent in traditional Cartesian scatter plots.
Let’s start with a basic example of creating a Scatter Plot on Polar Axis using Matplotlib:
import matplotlib.pyplot as plt
import numpy as np

# Generate sample data
theta = np.linspace(0, 2*np.pi, 100)
r = np.random.rand(100)

# Create a polar axes
fig, ax = plt.subplots(subplot_kw=dict(projection='polar'))

# Create the scatter plot
ax.scatter(theta, r)

# Set the title
ax.set_title("Basic Scatter Plot on Polar Axis - how2matplotlib.com")

# Display the plot
plt.show()
Output:
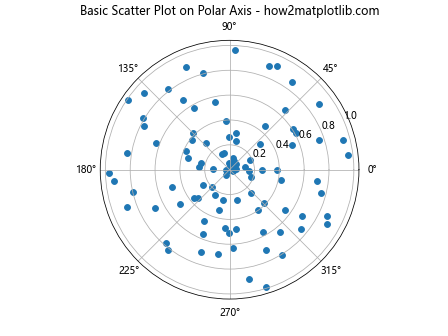
In this example, we create a basic Scatter Plot on Polar Axis using Matplotlib. We generate random data for the angular (theta) and radial (r) components, create a polar axes using subplot_kw=dict(projection='polar'), and then use the scatter() function to plot the data points.
Customizing the Appearance of Scatter Plots on Polar Axes
One of the key advantages of using Matplotlib for creating Scatter Plot on Polar Axis is the extensive customization options available. You can modify various aspects of the plot to enhance its visual appeal and clarity. Let’s explore some of these customization techniques:
Changing Marker Styles and Colors
You can customize the appearance of the data points in your Scatter Plot on Polar Axis using Matplotlib by changing the marker style, size, and color. Here’s an example:
import matplotlib.pyplot as plt
import numpy as np

# Generate sample data
theta = np.linspace(0, 2*np.pi, 50)
r = np.random.rand(50)

# Create a polar axes
fig, ax = plt.subplots(subplot_kw=dict(projection='polar'))

# Create the scatter plot with custom markers
ax.scatter(theta, r, c='red', s=50, marker='*', alpha=0.7)

# Set the title
ax.set_title("Customized Scatter Plot on Polar Axis - how2matplotlib.com")

# Display the plot
plt.show()
Output:
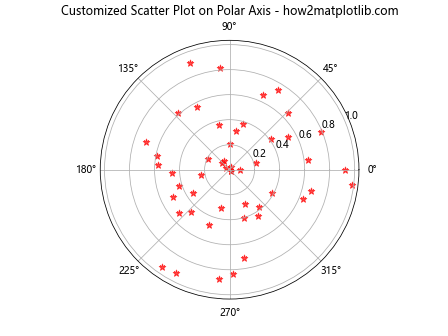
In this example, we’ve customized the scatter plot by setting the color to red (c='red'), increasing the marker size (s=50), changing the marker shape to a star (marker='*'), and adding transparency (alpha=0.7).
Adding a Colormap
You can enhance your Scatter Plot on Polar Axis using Matplotlib by adding a colormap to represent an additional dimension of data. Here’s how you can do it:
import matplotlib.pyplot as plt
import numpy as np

# Generate sample data
theta = np.linspace(0, 2*np.pi, 100)
r = np.random.rand(100)
colors = np.random.rand(100)

# Create a polar axes
fig, ax = plt.subplots(subplot_kw=dict(projection='polar'))

# Create the scatter plot with a colormap
scatter = ax.scatter(theta, r, c=colors, cmap='viridis')

# Add a colorbar
plt.colorbar(scatter)

# Set the title
ax.set_title("Scatter Plot on Polar Axis with Colormap - how2matplotlib.com")

# Display the plot
plt.show()
Output:
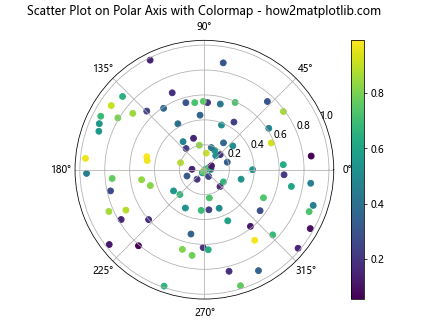
In this example, we’ve added a colormap to the scatter plot by passing an array of color values to the c parameter and specifying a colormap using cmap='viridis'. We’ve also added a colorbar to provide a reference for the color values.
Adjusting Axis Properties
When creating a Scatter Plot on Polar Axis using Matplotlib, you can customize various axis properties to improve the readability and appearance of your plot. Let’s explore some of these options:
Setting Axis Limits
You can control the range of both the angular and radial axes in your Scatter Plot on Polar Axis using Matplotlib. Here’s an example:
import matplotlib.pyplot as plt
import numpy as np

# Generate sample data
theta = np.linspace(0, 2*np.pi, 100)
r = np.random.rand(100)

# Create a polar axes
fig, ax = plt.subplots(subplot_kw=dict(projection='polar'))

# Create the scatter plot
ax.scatter(theta, r)

# Set axis limits
ax.set_thetamin(0)
ax.set_thetamax(180)
ax.set_rmin(0)
ax.set_rmax(1.5)

# Set the title
ax.set_title("Scatter Plot on Polar Axis with Custom Limits - how2matplotlib.com")

# Display the plot
plt.show()
Output:
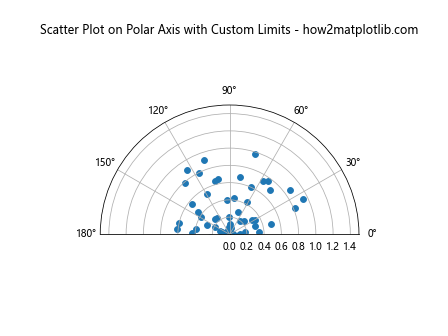
In this example, we’ve set the angular limits to display only the upper half of the circle (set_thetamin(0) and set_thetamax(180)), and adjusted the radial limits to extend beyond the data range (set_rmin(0) and set_rmax(1.5)).
Customizing Tick Labels
You can modify the tick labels on both the angular and radial axes of your Scatter Plot on Polar Axis using Matplotlib to improve readability or to display custom units. Here’s an example:
import matplotlib.pyplot as plt
import numpy as np

# Generate sample data
theta = np.linspace(0, 2*np.pi, 100)
r = np.random.rand(100)

# Create a polar axes
fig, ax = plt.subplots(subplot_kw=dict(projection='polar'))

# Create the scatter plot
ax.scatter(theta, r)

# Customize angular tick labels
ax.set_thetagrids(np.arange(0, 360, 45), ['N', 'NE', 'E', 'SE', 'S', 'SW', 'W', 'NW'])

# Customize radial tick labels
ax.set_rgrids(np.arange(0.2, 1.2, 0.2), ['0.2', '0.4', '0.6', '0.8', '1.0'])

# Set the title
ax.set_title("Scatter Plot on Polar Axis with Custom Ticks - how2matplotlib.com")

# Display the plot
plt.show()
Output:
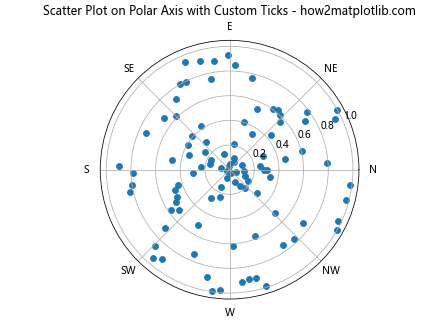
In this example, we’ve customized the angular tick labels to display compass directions and adjusted the radial tick labels to show specific values.
Adding Multiple Datasets
You can create more complex visualizations by adding multiple datasets to your Scatter Plot on Polar Axis using Matplotlib. This can be useful for comparing different groups or categories of data. Here’s an example:
import matplotlib.pyplot as plt
import numpy as np

# Generate sample data for two datasets
theta1 = np.linspace(0, 2*np.pi, 50)
r1 = np.random.rand(50)
theta2 = np.linspace(0, 2*np.pi, 50)
r2 = np.random.rand(50) + 0.5

# Create a polar axes
fig, ax = plt.subplots(subplot_kw=dict(projection='polar'))

# Create scatter plots for both datasets
ax.scatter(theta1, r1, c='blue', label='Dataset 1')
ax.scatter(theta2, r2, c='red', label='Dataset 2')

# Add a legend
ax.legend()

# Set the title
ax.set_title("Multiple Datasets on Polar Scatter Plot - how2matplotlib.com")

# Display the plot
plt.show()
Output:
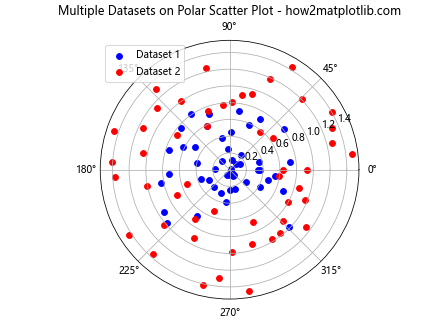
In this example, we’ve created two separate datasets and plotted them on the same polar axes using different colors. We’ve also added a legend to distinguish between the datasets.
Combining Scatter Plots with Other Plot Types
You can enhance your Scatter Plot on Polar Axis using Matplotlib by combining it with other plot types, such as line plots or area plots. This can provide additional context or highlight specific patterns in your data. Here’s an example that combines a scatter plot with a line plot:
import matplotlib.pyplot as plt
import numpy as np

# Generate sample data
theta = np.linspace(0, 2*np.pi, 100)
r_scatter = np.random.rand(100)
r_line = 0.5 + 0.3 * np.sin(3 * theta)

# Create a polar axes
fig, ax = plt.subplots(subplot_kw=dict(projection='polar'))

# Create the scatter plot
ax.scatter(theta, r_scatter, c='blue', alpha=0.7, label='Scatter Data')

# Add a line plot
ax.plot(theta, r_line, color='red', linewidth=2, label='Trend Line')

# Add a legend
ax.legend()

# Set the title
ax.set_title("Combined Scatter and Line Plot on Polar Axis - how2matplotlib.com")

# Display the plot
plt.show()
Output:
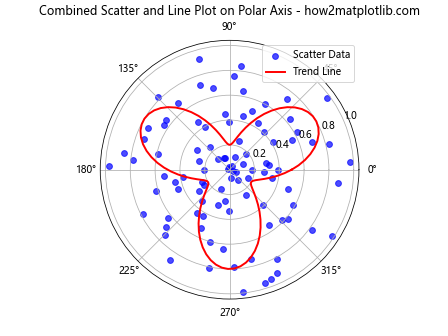
In this example, we’ve combined a scatter plot of random data points with a sinusoidal line plot to illustrate how you can overlay different plot types on a polar axis.
Handling Large Datasets
When working with large datasets in your Scatter Plot on Polar Axis using Matplotlib, you may need to consider techniques to improve performance and readability. One approach is to use alpha blending to handle overlapping points. Here’s an example:
import matplotlib.pyplot as plt
import numpy as np

# Generate a large sample dataset
theta = np.random.uniform(0, 2*np.pi, 10000)
r = np.random.uniform(0, 1, 10000)

# Create a polar axes
fig, ax = plt.subplots(subplot_kw=dict(projection='polar'))

# Create the scatter plot with alpha blending
ax.scatter(theta, r, alpha=0.1, s=1)

# Set the title
ax.set_title("Large Dataset Scatter Plot on Polar Axis - how2matplotlib.com")

# Display the plot
plt.show()
Output:
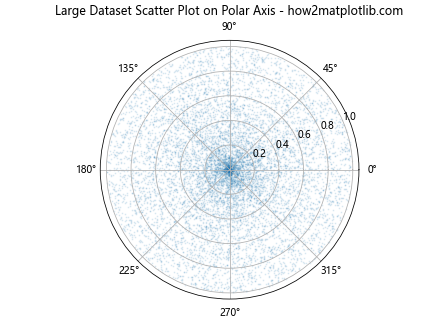
In this example, we’ve generated a large dataset with 10,000 points and used alpha blending (alpha=0.1) to make overlapping points more visible. We’ve also reduced the marker size (s=1) to prevent overcrowding.
Adding Annotations and Text
You can enhance your Scatter Plot on Polar Axis using Matplotlib by adding annotations and text to highlight specific data points or provide additional information. Here’s an example:
import matplotlib.pyplot as plt
import numpy as np

# Generate sample data
theta = np.linspace(0, 2*np.pi, 20)
r = np.random.rand(20)

# Create a polar axes
fig, ax = plt.subplots(subplot_kw=dict(projection='polar'))

# Create the scatter plot
scatter = ax.scatter(theta, r)

# Add annotations to specific points
ax.annotate('Max', xy=(theta[np.argmax(r)], r.max()), xytext=(0.5, 0.5),
            textcoords='figure fraction', arrowprops=dict(arrowstyle="->"))
ax.annotate('Min', xy=(theta[np.argmin(r)], r.min()), xytext=(0.8, 0.8),
            textcoords='figure fraction', arrowprops=dict(arrowstyle="->"))

# Add text to the plot
ax.text(0, 0.5, 'Center Text', ha='center', va='center')

# Set the title
ax.set_title("Annotated Scatter Plot on Polar Axis - how2matplotlib.com")

# Display the plot
plt.show()
Output:
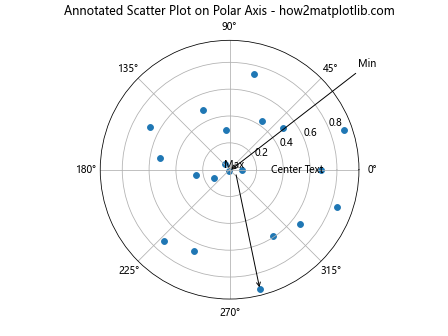
In this example, we’ve added annotations to the maximum and minimum data points using ax.annotate(), and added text to the center of the plot using ax.text().
Creating Subplots with Polar Axes
You can create multiple Scatter Plot on Polar Axis using Matplotlib in a single figure by using subplots. This can be useful for comparing different datasets or visualizing different aspects of your data. Here’s an example:
import matplotlib.pyplot as plt
import numpy as np

# Generate sample data for two subplots
theta1 = np.linspace(0, 2*np.pi, 100)
r1 = np.random.rand(100)
theta2 = np.linspace(0, 2*np.pi, 100)
r2 = np.random.rand(100)

# Create a figure with two polar subplots
fig, (ax1, ax2) = plt.subplots(1, 2, subplot_kw=dict(projection='polar'))

# Create scatter plot in the first subplot
ax1.scatter(theta1, r1)
ax1.set_title("Subplot 1 - how2matplotlib.com")

# Create scatter plot in the second subplot
ax2.scatter(theta2, r2)
ax2.set_title("Subplot 2 - how2matplotlib.com")

# Adjust the layout
plt.tight_layout()

# Display the plot
plt.show()
Output:
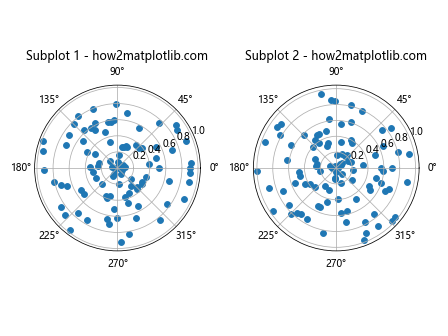
In this example, we’ve created two polar subplots side by side, each containing a separate scatter plot.
Customizing the Grid
You can customize the grid lines in your Scatter Plot on Polar Axis using Matplotlib to improve readability or to match your desired aesthetic. Here’s an example:
import matplotlib.pyplot as plt
import numpy as np

# Generate sample data
theta = np.linspace(0, 2*np.pi, 100)
r = np.random.rand(100)

# Create a polar axes
fig, ax = plt.subplots(subplot_kw=dict(projection='polar'))

# Create the scatter plot
ax.scatter(theta, r)

# Customize the grid
ax.grid(color='gray', linestyle='--', linewidth=0.5)

# Customize the radial grid lines
ax.set_rticks([0.2, 0.4, 0.6, 0.8])

# Customize the angular grid lines
ax.set_thetagrids(np.arange(0, 360, 45))

# Set the title
ax.set_title("Scatter Plot on Polar Axis with Custom Grid - how2matplotlib.com")

# Display the plot
plt.show()
Output:
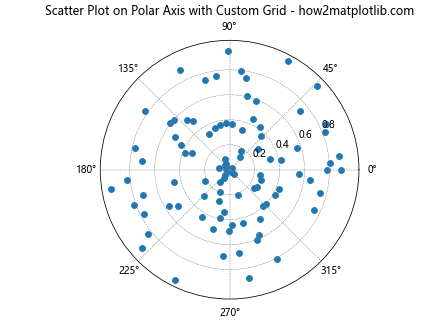
In this example, we’ve customized the grid color, line style, and line width. We’ve also adjusted the radial and angular grid lines to display at specific intervals.
Adding a Polar Bar Plot
You can combine a Scatter Plot on Polar Axis using Matplotlib with other polar plot types, such as a polar bar plot, to create more complex visualizations. Here’s an example:
import matplotlib.pyplot as plt
import numpy as np

# Generate sample data
theta = np.linspace(0, 2*np.pi, 8, endpoint=False)
r_scatter = np.random.rand(50)
theta_scatter = np.random.uniform(0, 2*np.pi, 50)
r_bar = np.random.rand(8)

# Create a polar axes
fig, ax = plt.subplots(subplot_kw=dict(projection='polar'))

# Create the scatter plot
ax.scatter(theta_scatter, r_scatter, c='blue', alpha=0.7, label='Scatter Data')

# Add a polar bar plot
ax.bar(theta, r_bar, width=0.5,alpha=0.5, color='red', label='Bar Data')

# Add a legend
ax.legend()

# Set the title
ax.set_title("Combined Scatter and Bar Plot on Polar Axis - how2matplotlib.com")

# Display the plot
plt.show()
Output:
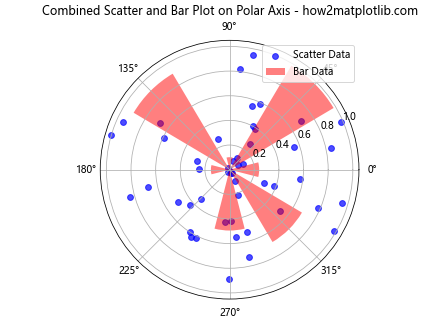
In this example, we’ve combined a scatter plot with a polar bar plot to show how different types of data can be represented on the same polar axis.
Creating Animated Scatter Plots on Polar Axes
You can create animated Scatter Plot on Polar Axis using Matplotlib to visualize dynamic data or to show changes over time. Here’s an example of how to create a simple animation:
import matplotlib.pyplot as plt
import numpy as np
from matplotlib.animation import FuncAnimation

# Generate initial data
theta = np.linspace(0, 2*np.pi, 100)
r = np.random.rand(100)

# Create a polar axes
fig, ax = plt.subplots(subplot_kw=dict(projection='polar'))
scatter = ax.scatter(theta, r)

# Animation update function
def update(frame):
    r = np.random.rand(100)
    scatter.set_offsets(np.column_stack((theta, r)))
    ax.set_title(f"Animated Scatter Plot - Frame {frame} - how2matplotlib.com")
    return scatter,

# Create the animation
ani = FuncAnimation(fig, update, frames=100, interval=100, blit=True)

# Display the animation
plt.show()
Output:
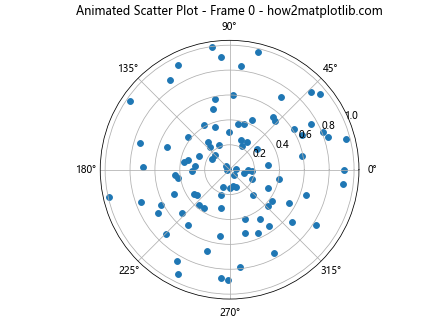
In this example, we’ve created an animated scatter plot where the radial values change randomly in each frame. The FuncAnimation class is used to create the animation, with the update function defining how the plot changes in each frame.
Handling Categorical Data on Polar Axes
While Scatter Plot on Polar Axis using Matplotlib typically works with continuous data, you can also represent categorical data on polar axes. Here’s an example of how to create a scatter plot with categorical angular values:
import matplotlib.pyplot as plt
import numpy as np

# Generate sample data
categories = ['A', 'B', 'C', 'D', 'E', 'F', 'G', 'H']
values = np.random.rand(40)
cat_indices = np.random.randint(0, len(categories), 40)

# Map categories to angles
theta = np.linspace(0, 2*np.pi, len(categories), endpoint=False)
theta_data = theta[cat_indices]

# Create a polar axes
fig, ax = plt.subplots(subplot_kw=dict(projection='polar'))

# Create the scatter plot
ax.scatter(theta_data, values)

# Set the angular tick labels
ax.set_thetagrids(np.degrees(theta), categories)

# Set the title
ax.set_title("Categorical Scatter Plot on Polar Axis - how2matplotlib.com")

# Display the plot
plt.show()
Output:
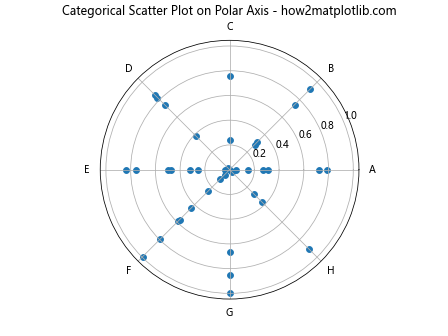
In this example, we’ve created a scatter plot where the angular positions represent different categories, and the radial values are continuous data points associated with those categories.
Adding Error Bars to Polar Scatter Plots
You can add error bars to your Scatter Plot on Polar Axis using Matplotlib to represent uncertainty or variability in your data. Here’s an example of how to add radial error bars:
import matplotlib.pyplot as plt
import numpy as np

# Generate sample data
theta = np.linspace(0, 2*np.pi, 20)
r = np.random.rand(20)
r_err = np.random.rand(20) * 0.1

# Create a polar axes
fig, ax = plt.subplots(subplot_kw=dict(projection='polar'))

# Create the scatter plot with error bars
ax.errorbar(theta, r, yerr=r_err, fmt='o')

# Set the title
ax.set_title("Scatter Plot with Error Bars on Polar Axis - how2matplotlib.com")

# Display the plot
plt.show()
Output:
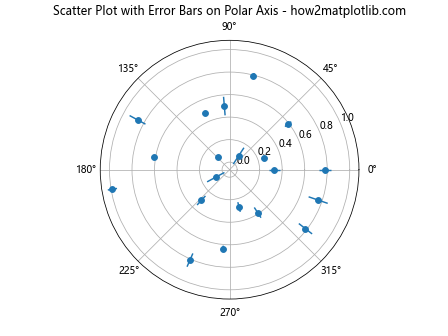
In this example, we’ve added radial error bars to each data point using the errorbar function. The yerr parameter specifies the length of the error bars.
Creating Density-Based Scatter Plots on Polar Axes
When dealing with large datasets or overlapping points in your Scatter Plot on Polar Axis using Matplotlib, you can create a density-based scatter plot to better visualize the distribution of your data. Here’s an example using a 2D histogram:
import matplotlib.pyplot as plt
import numpy as np

# Generate sample data
theta = np.random.uniform(0, 2*np.pi, 1000)
r = np.random.normal(loc=0.5, scale=0.1, size=1000)

# Create a polar axes
fig, ax = plt.subplots(subplot_kw=dict(projection='polar'))

# Create the 2D histogram
hist, theta_edges, r_edges = np.histogram2d(theta, r, bins=(36, 20))

# Plot the 2D histogram
pcm = ax.pcolormesh(theta_edges, r_edges, hist.T, cmap='viridis')

# Add a colorbar
plt.colorbar(pcm)

# Set the title
ax.set_title("Density-Based Scatter Plot on Polar Axis - how2matplotlib.com")

# Display the plot
plt.show()
Output:
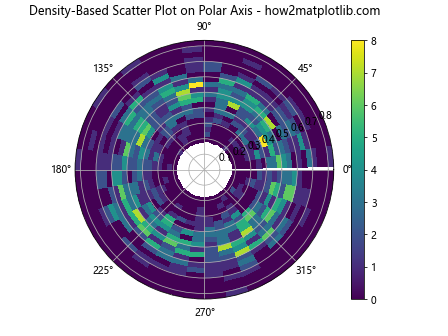
In this example, we’ve used np.histogram2d to create a 2D histogram of the data, and then used pcolormesh to visualize the density of points on the polar axis.
Conclusion
In this comprehensive guide, we’ve explored various aspects of creating and customizing Scatter Plot on Polar Axis using Matplotlib. We’ve covered basic concepts, advanced techniques, and provided numerous examples to help you understand how to effectively use this powerful visualization method.
Scatter Plot on Polar Axis using Matplotlib offers a unique way to represent data with angular and radial components, making it particularly useful for visualizing cyclic or directional data. By leveraging the customization options available in Matplotlib, you can create informative and visually appealing polar scatter plots that effectively communicate your data insights.
Remember that the key to creating effective Scatter Plot on Polar Axis using Matplotlib is to experiment with different techniques and customize your plots to best suit your specific data and visualization needs. Whether you’re working with small datasets or large-scale data analysis projects, the flexibility and power of Matplotlib’s polar scatter plots can help you uncover and communicate valuable insights in your data.