How to Master Rendering 3D Surfaces Using Parametric Equations in Python with Matplotlib
Rendering 3D surfaces using parametric equations in Python is a powerful technique for visualizing complex mathematical functions and creating stunning three-dimensional graphics. This article will dive deep into the world of parametric equations and their application in rendering 3D surfaces using Python and Matplotlib. We’ll explore various aspects of this topic, from the basics of parametric equations to advanced rendering techniques, providing you with a comprehensive guide to mastering this skill.
Understanding Parametric Equations for Rendering 3D Surfaces
Parametric equations are a fundamental concept in mathematics and computer graphics, especially when it comes to rendering 3D surfaces. In the context of rendering 3D surfaces, parametric equations allow us to define points in three-dimensional space using two parameters, typically denoted as ‘u’ and ‘v’. These parameters are independent variables that, when varied, generate a set of points that form a surface in 3D space.
When rendering 3D surfaces using parametric equations in Python, we typically define three functions: x(u, v), y(u, v), and z(u, v). These functions determine the x, y, and z coordinates of points on the surface based on the parameters u and v.
Let’s start with a simple example to illustrate how we can use parametric equations to render a 3D surface in Python using Matplotlib:
import numpy as np
import matplotlib.pyplot as plt
from mpl_toolkits.mplot3d import Axes3D

def x(u, v):
    return u * np.cos(v)

def y(u, v):
    return u * np.sin(v)

def z(u, v):
    return u

u = np.linspace(0, 5, 100)
v = np.linspace(0, 2 * np.pi, 100)
U, V = np.meshgrid(u, v)

X = x(U, V)
Y = y(U, V)
Z = z(U, V)

fig = plt.figure(figsize=(10, 8))
ax = fig.add_subplot(111, projection='3d')
surf = ax.plot_surface(X, Y, Z, cmap='viridis')
ax.set_xlabel('X - how2matplotlib.com')
ax.set_ylabel('Y - how2matplotlib.com')
ax.set_zlabel('Z - how2matplotlib.com')
plt.title('Rendering 3D Surface Using Parametric Equations')
plt.colorbar(surf)
plt.show()
Output:
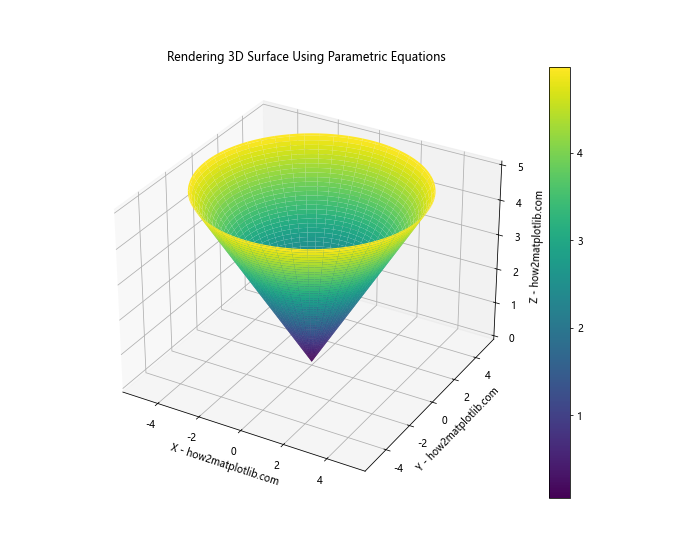
In this example, we’ve defined parametric equations for a cone. The functions x(u, v), y(u, v), and z(u, v) determine the coordinates of points on the cone’s surface. We use numpy’s linspace function to create arrays of u and v values, and then use meshgrid to create 2D arrays of these values. Finally, we use Matplotlib’s plot_surface function to render the 3D surface.
Exploring Different Types of 3D Surfaces Using Parametric Equations
Rendering 3D surfaces using parametric equations in Python allows us to create a wide variety of shapes and forms. Let’s explore some common types of surfaces and how to render them using parametric equations.
Spheres
A sphere is one of the most basic 3D surfaces we can render using parametric equations. Here’s how we can do it:
import numpy as np
import matplotlib.pyplot as plt
from mpl_toolkits.mplot3d import Axes3D

def x(u, v):
    return np.cos(u) * np.sin(v)

def y(u, v):
    return np.sin(u) * np.sin(v)

def z(u, v):
    return np.cos(v)

u = np.linspace(0, 2 * np.pi, 100)
v = np.linspace(0, np.pi, 100)
U, V = np.meshgrid(u, v)

X = x(U, V)
Y = y(U, V)
Z = z(U, V)

fig = plt.figure(figsize=(10, 8))
ax = fig.add_subplot(111, projection='3d')
surf = ax.plot_surface(X, Y, Z, cmap='plasma')
ax.set_xlabel('X - how2matplotlib.com')
ax.set_ylabel('Y - how2matplotlib.com')
ax.set_zlabel('Z - how2matplotlib.com')
plt.title('Rendering 3D Sphere Using Parametric Equations')
plt.colorbar(surf)
plt.show()
Output:
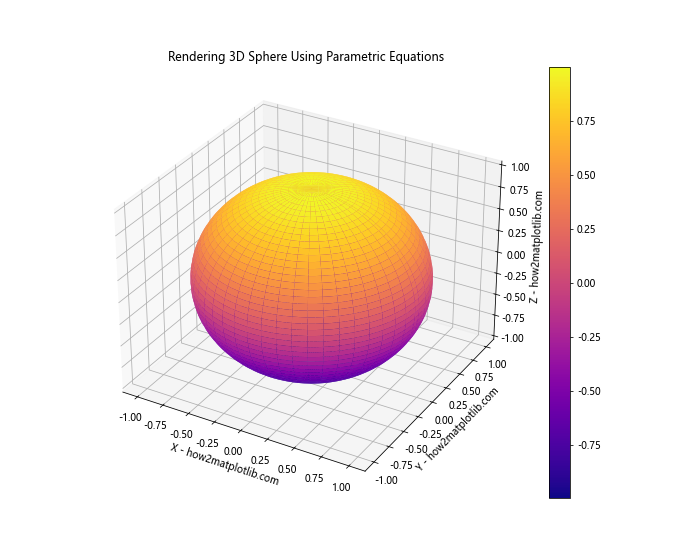
In this example, we’ve used the standard parametric equations for a sphere. The parameters u and v represent the azimuthal and polar angles, respectively.
Torus
A torus is another interesting 3D surface that we can render using parametric equations. Here’s how:
import numpy as np
import matplotlib.pyplot as plt
from mpl_toolkits.mplot3d import Axes3D

def x(u, v, R, r):
    return (R + r * np.cos(v)) * np.cos(u)

def y(u, v, R, r):
    return (R + r * np.cos(v)) * np.sin(u)

def z(u, v, R, r):
    return r * np.sin(v)

u = np.linspace(0, 2 * np.pi, 100)
v = np.linspace(0, 2 * np.pi, 100)
U, V = np.meshgrid(u, v)

R = 3  # major radius
r = 1  # minor radius

X = x(U, V, R, r)
Y = y(U, V, R, r)
Z = z(U, V, R, r)

fig = plt.figure(figsize=(10, 8))
ax = fig.add_subplot(111, projection='3d')
surf = ax.plot_surface(X, Y, Z, cmap='coolwarm')
ax.set_xlabel('X - how2matplotlib.com')
ax.set_ylabel('Y - how2matplotlib.com')
ax.set_zlabel('Z - how2matplotlib.com')
plt.title('Rendering 3D Torus Using Parametric Equations')
plt.colorbar(surf)
plt.show()
Output:
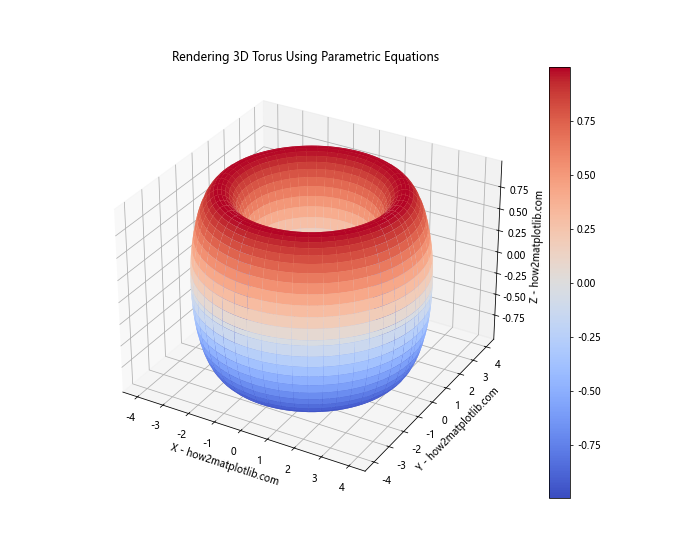
In this example, we’ve introduced two additional parameters: R (major radius) and r (minor radius). These allow us to control the overall size and shape of the torus.
Advanced Techniques for Rendering 3D Surfaces Using Parametric Equations
Now that we’ve covered the basics of rendering 3D surfaces using parametric equations in Python, let’s explore some more advanced techniques that can enhance our visualizations.
Adding Color and Texture
One way to make our 3D surface renderings more interesting is by adding color and texture. We can do this by modifying the color map and surface properties in Matplotlib. Here’s an example:
import numpy as np
import matplotlib.pyplot as plt
from mpl_toolkits.mplot3d import Axes3D

def x(u, v):
    return (1 + 0.5 * np.cos(v)) * np.cos(u)

def y(u, v):
    return (1 + 0.5 * np.cos(v)) * np.sin(u)

def z(u, v):
    return 0.5 * np.sin(v) + 0.2 * np.sin(5*u)

u = np.linspace(0, 2 * np.pi, 100)
v = np.linspace(0, 2 * np.pi, 100)
U, V = np.meshgrid(u, v)

X = x(U, V)
Y = y(U, V)
Z = z(U, V)

fig = plt.figure(figsize=(10, 8))
ax = fig.add_subplot(111, projection='3d')
surf = ax.plot_surface(X, Y, Z, cmap='terrain', alpha=0.8, linewidth=0, antialiased=False)
ax.set_xlabel('X - how2matplotlib.com')
ax.set_ylabel('Y - how2matplotlib.com')
ax.set_zlabel('Z - how2matplotlib.com')
plt.title('Advanced 3D Surface Rendering with Color and Texture')
plt.colorbar(surf)
plt.show()
Output:
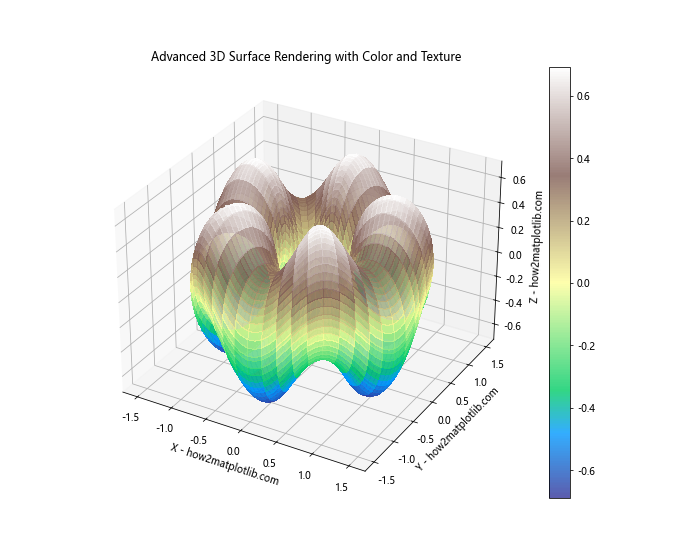
In this example, we’ve used a more complex set of parametric equations to create an interesting surface. We’ve also used the ‘terrain’ colormap and adjusted the alpha value for transparency. The linewidth and antialiased parameters are set to create a smoother surface appearance.
Animating 3D Surfaces
Another advanced technique for rendering 3D surfaces using parametric equations is animation. We can create dynamic visualizations by updating the surface parameters over time. Here’s an example of how to create a simple animation:
import numpy as np
import matplotlib.pyplot as plt
from mpl_toolkits.mplot3d import Axes3D
from matplotlib.animation import FuncAnimation

def x(u, v, t):
    return (1 + 0.5 * np.cos(v)) * np.cos(u + t)

def y(u, v, t):
    return (1 + 0.5 * np.cos(v)) * np.sin(u + t)

def z(u, v, t):
    return 0.5 * np.sin(v) + 0.2 * np.sin(5*u + t)

u = np.linspace(0, 2 * np.pi, 50)
v = np.linspace(0, 2 * np.pi, 50)
U, V = np.meshgrid(u, v)

fig = plt.figure(figsize=(10, 8))
ax = fig.add_subplot(111, projection='3d')

surf = ax.plot_surface(x(U, V, 0), y(U, V, 0), z(U, V, 0), cmap='viridis')

ax.set_xlabel('X - how2matplotlib.com')
ax.set_ylabel('Y - how2matplotlib.com')
ax.set_zlabel('Z - how2matplotlib.com')
plt.title('Animated 3D Surface Using Parametric Equations')

def update(frame):
    ax.clear()
    surf = ax.plot_surface(x(U, V, frame/10), y(U, V, frame/10), z(U, V, frame/10), cmap='viridis')
    ax.set_xlabel('X - how2matplotlib.com')
    ax.set_ylabel('Y - how2matplotlib.com')
    ax.set_zlabel('Z - how2matplotlib.com')
    return surf,

ani = FuncAnimation(fig, update, frames=100, interval=50, blit=True)
plt.show()
Output:
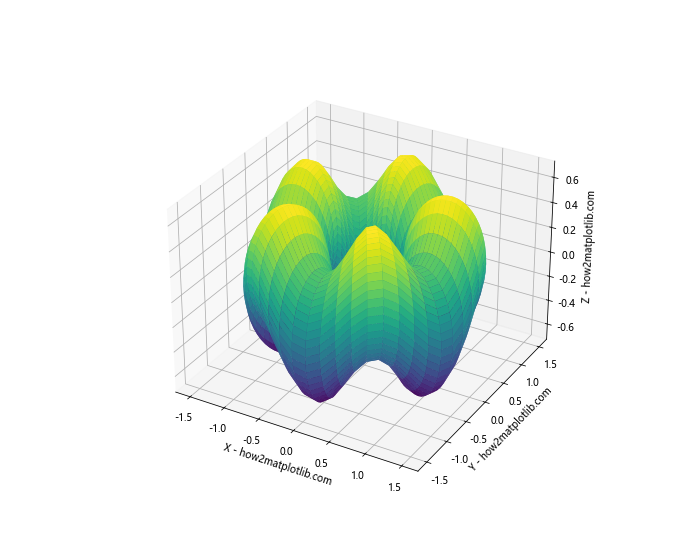
In this example, we’ve added a time parameter ‘t’ to our parametric equations. The FuncAnimation function from Matplotlib is used to create the animation by updating the surface at each frame.
Optimizing Performance When Rendering 3D Surfaces
When rendering 3D surfaces using parametric equations in Python, performance can become an issue, especially for complex surfaces or when working with large datasets. Here are some techniques to optimize performance:
Vectorization
One of the most effective ways to improve performance when rendering 3D surfaces using parametric equations is to use vectorized operations. Numpy provides efficient ways to perform operations on entire arrays at once, which can significantly speed up our calculations. Here’s an example:
import numpy as np
import matplotlib.pyplot as plt
from mpl_toolkits.mplot3d import Axes3D

def surface_func(u, v):
    x = u * np.cos(v)
    y = u * np.sin(v)
    z = np.exp(-0.1 * u) * np.cos(5 * v)
    return x, y, z

u = np.linspace(0, 5, 100)
v = np.linspace(0, 2 * np.pi, 100)
U, V = np.meshgrid(u, v)

X, Y, Z = surface_func(U, V)

fig = plt.figure(figsize=(10, 8))
ax = fig.add_subplot(111, projection='3d')
surf = ax.plot_surface(X, Y, Z, cmap='viridis')
ax.set_xlabel('X - how2matplotlib.com')
ax.set_ylabel('Y - how2matplotlib.com')
ax.set_zlabel('Z - how2matplotlib.com')
plt.title('Optimized 3D Surface Rendering Using Vectorization')
plt.colorbar(surf)
plt.show()
Output:
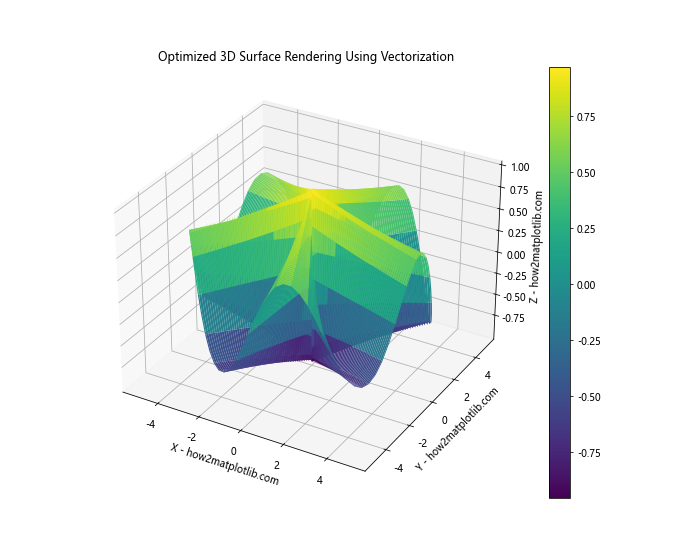
In this example, we’ve defined a single function surface_func that returns all three coordinates at once, using vectorized operations. This approach is generally faster than calculating each coordinate separately.
Reducing Resolution
Another way to improve performance when rendering 3D surfaces is to reduce the resolution of the surface. This means using fewer points to represent the surface, which can significantly speed up rendering times. Here’s an example:
import numpy as np
import matplotlib.pyplot as plt
from mpl_toolkits.mplot3d import Axes3D

def x(u, v):
    return u * np.cos(v)

def y(u, v):
    return u * np.sin(v)

def z(u, v):
    return np.sin(np.sqrt(u**2 + v**2))

u = np.linspace(-5, 5, 50)  # Reduced from 100 to 50 points
v = np.linspace(-5, 5, 50)  # Reduced from 100 to 50 points
U, V = np.meshgrid(u, v)

X = x(U, V)
Y = y(U, V)
Z = z(U, V)

fig = plt.figure(figsize=(10, 8))
ax = fig.add_subplot(111, projection='3d')
surf = ax.plot_surface(X, Y, Z, cmap='viridis', linewidth=0, antialiased=False)
ax.set_xlabel('X - how2matplotlib.com')
ax.set_ylabel('Y - how2matplotlib.com')
ax.set_zlabel('Z - how2matplotlib.com')
plt.title('Optimized 3D Surface Rendering with Reduced Resolution')
plt.colorbar(surf)
plt.show()
Output:
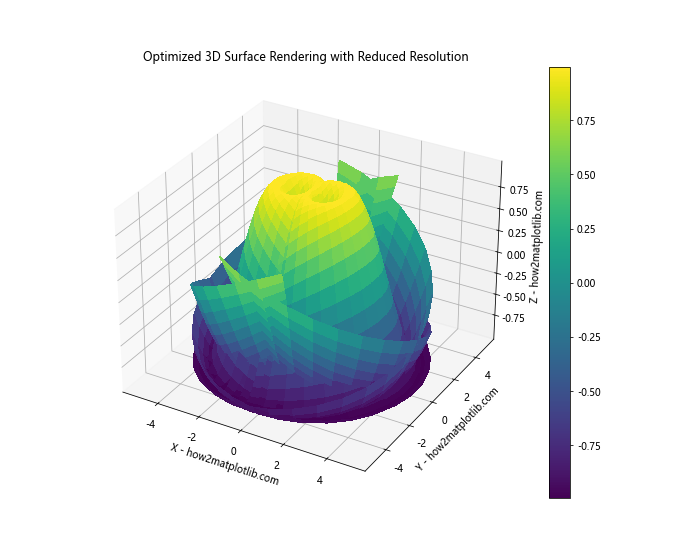
In this example, we’ve reduced the number of points used to represent the surface from 100×100 to 50×50. This can significantly improve rendering performance, especially for complex surfaces.
Advanced Mathematical Concepts in Rendering 3D Surfaces
When rendering 3D surfaces using parametric equations in Python, it’s often helpful to understand some advanced mathematical concepts. Let’s explore a few of these concepts and see how they can be applied to create more complex and interesting surfaces.
Möbius Strip
A Möbius strip is a fascinating mathematical object that can be rendered using parametric equations. It’s a surface with only one side and one boundary component. Here’s how we can render it:
import numpy as np
import matplotlib.pyplot as plt
from mpl_toolkits.mplot3d import Axes3D

def mobius_strip(u, v, R, w):
    x = (R + w * np.cos(v/2) * np.cos(u)) * np.cos(u)
    y = (R + w * np.cos(v/2) * np.cos(u)) * np.sin(u)
    z = w * np.sin(v/2) * np.cos(u)
    return x, y, z

u = np.linspace(0, 2*np.pi, 100)
v = np.linspace(-np.pi, np.pi, 100)
U, V = np.meshgrid(u, v)

R = 2  # radius of the central circle
w = 0.5  # width of the strip

X, Y, Z = mobius_strip(U, V, R, w)

fig = plt.figure(figsize=(10, 8))
ax = fig.add_subplot(111, projection='3d')
surf = ax.plot_surface(X, Y,Z, cmap='viridis', linewidth=0, antialiased=False)
ax.set_xlabel('X - how2matplotlib.com')
ax.set_ylabel('Y - how2matplotlib.com')
ax.set_zlabel('Z - how2matplotlib.com')
plt.title('Rendering Möbius Strip Using Parametric Equations')
plt.colorbar(surf)
plt.show()
Output:
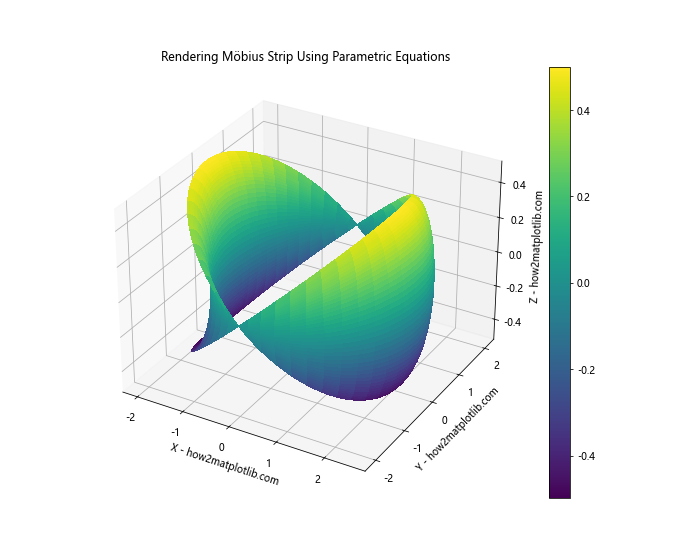
In this example, we’ve used parametric equations to render a Möbius strip. The parameters R and w control the size and width of the strip, respectively.
Klein Bottle
Another interesting mathematical surface is the Klein bottle, which is a non-orientable surface that has no inside or outside. While it’s impossible to create a true Klein bottle in three-dimensional space without self-intersection, we can create a 3D representation of it. Here’s how:
import numpy as np
import matplotlib.pyplot as plt
from mpl_toolkits.mplot3d import Axes3D

def klein_bottle(u, v):
    r = 4 * (1 - np.cos(u) / 2)
    x = 6 * np.cos(u) * (1 + np.sin(u)) + r * np.cos(v + np.pi)
    y = 16 * np.sin(u)
    z = r * np.sin(v)
    return x, y, z

u = np.linspace(0, 2*np.pi, 100)
v = np.linspace(0, 2*np.pi, 100)
U, V = np.meshgrid(u, v)

X, Y, Z = klein_bottle(U, V)

fig = plt.figure(figsize=(10, 8))
ax = fig.add_subplot(111, projection='3d')
surf = ax.plot_surface(X, Y, Z, cmap='plasma', linewidth=0, antialiased=False)
ax.set_xlabel('X - how2matplotlib.com')
ax.set_ylabel('Y - how2matplotlib.com')
ax.set_zlabel('Z - how2matplotlib.com')
plt.title('Rendering Klein Bottle Using Parametric Equations')
plt.colorbar(surf)
plt.show()
Output:
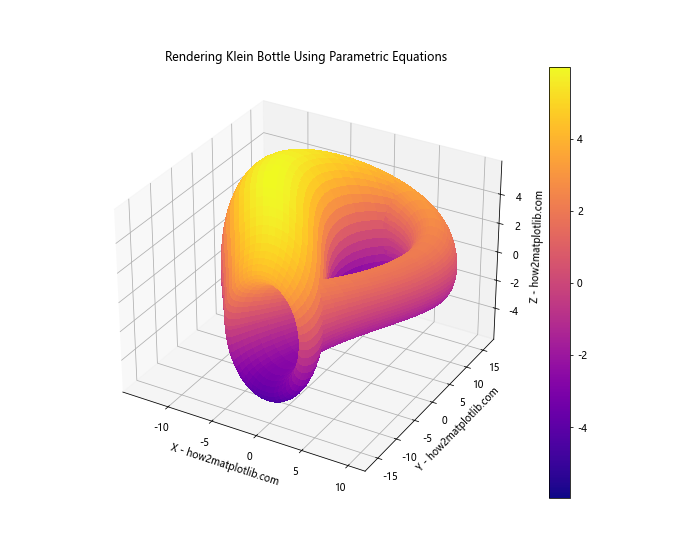
This example demonstrates how we can use parametric equations to create a 3D representation of a Klein bottle.
Combining Multiple Surfaces in a Single Rendering
When rendering 3D surfaces using parametric equations in Python, we’re not limited to just one surface per plot. We can combine multiple surfaces to create more complex and interesting visualizations. Let’s explore how to do this.
Rendering Multiple Surfaces
Here’s an example of how we can render multiple surfaces in the same plot:
import numpy as np
import matplotlib.pyplot as plt
from mpl_toolkits.mplot3d import Axes3D

def sphere(u, v, r):
    x = r * np.cos(u) * np.sin(v)
    y = r * np.sin(u) * np.sin(v)
    z = r * np.cos(v)
    return x, y, z

def torus(u, v, R, r):
    x = (R + r * np.cos(v)) * np.cos(u)
    y = (R + r * np.cos(v)) * np.sin(u)
    z = r * np.sin(v)
    return x, y, z

u = np.linspace(0, 2*np.pi, 50)
v = np.linspace(0, np.pi, 50)
U, V = np.meshgrid(u, v)

X_sphere, Y_sphere, Z_sphere = sphere(U, V, 1.5)
X_torus, Y_torus, Z_torus = torus(U, V, 3, 0.5)

fig = plt.figure(figsize=(12, 10))
ax = fig.add_subplot(111, projection='3d')

surf_sphere = ax.plot_surface(X_sphere, Y_sphere, Z_sphere, cmap='viridis', alpha=0.7)
surf_torus = ax.plot_surface(X_torus, Y_torus, Z_torus, cmap='plasma', alpha=0.7)

ax.set_xlabel('X - how2matplotlib.com')
ax.set_ylabel('Y - how2matplotlib.com')
ax.set_zlabel('Z - how2matplotlib.com')
plt.title('Rendering Multiple 3D Surfaces Using Parametric Equations')
plt.show()
Output:
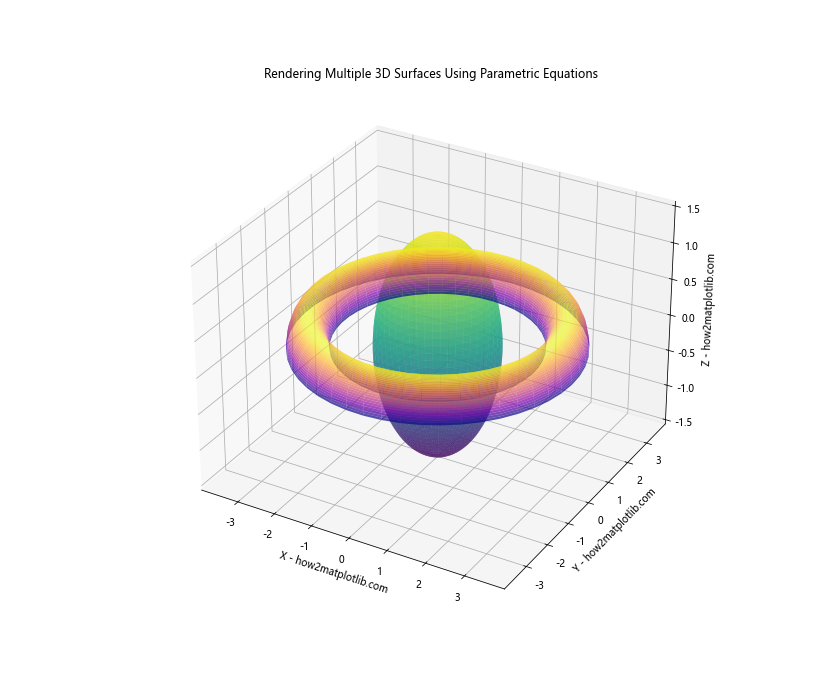
In this example, we’ve rendered both a sphere and a torus in the same plot. We’ve used different color maps and alpha values to distinguish between the two surfaces.
Incorporating Physical Models in 3D Surface Rendering
Rendering 3D surfaces using parametric equations in Python isn’t just for abstract mathematical concepts. We can also use this technique to visualize physical models and phenomena. Let’s explore a few examples.
Rendering a Wave Function
Quantum mechanics often deals with wave functions that can be visualized as 3D surfaces. Here’s an example of how we might render a simple wave function:
import numpy as np
import matplotlib.pyplot as plt
from mpl_toolkits.mplot3d import Axes3D

def wave_function(x, y, n, m):
    L = 1  # size of the box
    return np.sin(n * np.pi * x / L) * np.sin(m * np.pi * y / L)

x = np.linspace(0, 1, 100)
y = np.linspace(0, 1, 100)
X, Y = np.meshgrid(x, y)

Z = wave_function(X, Y, 2, 3)  # 2 and 3 are quantum numbers

fig = plt.figure(figsize=(10, 8))
ax = fig.add_subplot(111, projection='3d')
surf = ax.plot_surface(X, Y, Z, cmap='coolwarm', linewidth=0, antialiased=False)
ax.set_xlabel('X - how2matplotlib.com')
ax.set_ylabel('Y - how2matplotlib.com')
ax.set_zlabel('Z - how2matplotlib.com')
plt.title('Rendering Wave Function Using Parametric Equations')
plt.colorbar(surf)
plt.show()
Output:
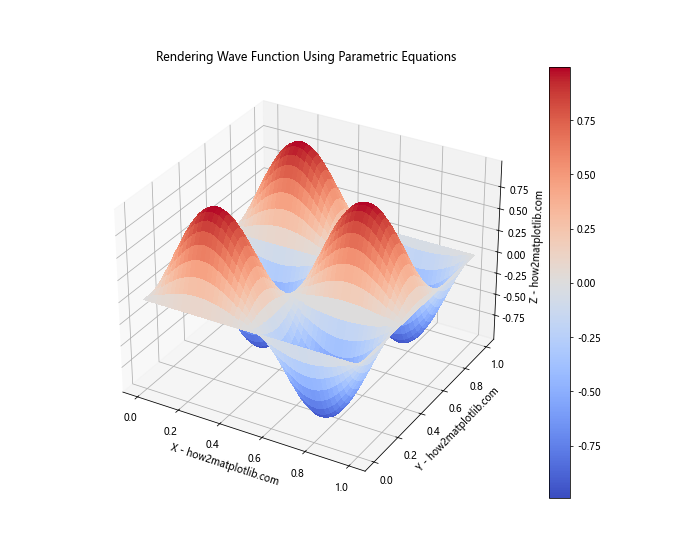
This example shows how we can use parametric equations to visualize a 2D quantum wave function in a box.
Rendering a Gravitational Field
We can also use 3D surface rendering to visualize gravitational fields. Here’s a simple example:
import numpy as np
import matplotlib.pyplot as plt
from mpl_toolkits.mplot3d import Axes3D

def gravitational_potential(x, y, M):
    G = 6.67430e-11  # gravitational constant
    R = np.sqrt(x**2 + y**2)
    return -G * M / R

x = np.linspace(-10, 10, 100)
y = np.linspace(-10, 10, 100)
X, Y = np.meshgrid(x, y)

M = 1e10  # mass of the object
Z = gravitational_potential(X, Y, M)

fig = plt.figure(figsize=(10, 8))
ax = fig.add_subplot(111, projection='3d')
surf = ax.plot_surface(X, Y, Z, cmap='viridis', linewidth=0, antialiased=False)
ax.set_xlabel('X - how2matplotlib.com')
ax.set_ylabel('Y - how2matplotlib.com')
ax.set_zlabel('Z - how2matplotlib.com')
plt.title('Rendering Gravitational Potential Using Parametric Equations')
plt.colorbar(surf)
plt.show()
Output:
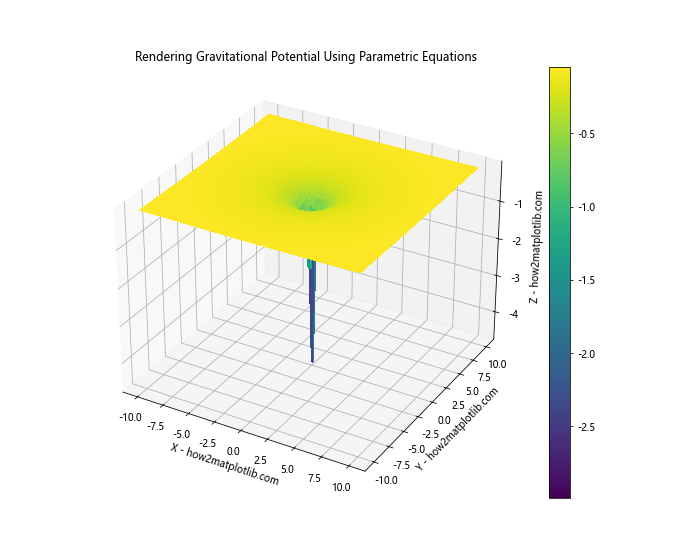
This example demonstrates how we can visualize the gravitational potential around a massive object.
Advanced Customization Techniques
When rendering 3D surfaces using parametric equations in Python, there are many ways to customize the appearance of our plots. Let’s explore some advanced customization techniques.
Custom Colormaps
While Matplotlib provides many built-in colormaps, we can also create our own custom colormaps. Here’s an example:
import numpy as np
import matplotlib.pyplot as plt
from mpl_toolkits.mplot3d import Axes3D
from matplotlib.colors import LinearSegmentedColormap

def custom_surface(u, v):
    x = u
    y = v
    z = np.sin(np.sqrt(u**2 + v**2))
    return x, y, z

u = np.linspace(-5, 5, 100)
v = np.linspace(-5, 5, 100)
U, V = np.meshgrid(u, v)

X, Y, Z = custom_surface(U, V)

# Create custom colormap
colors = ['darkblue', 'blue', 'lightblue', 'green', 'yellow', 'red', 'darkred']
n_bins = 100
cmap = LinearSegmentedColormap.from_list('custom_cmap', colors, N=n_bins)

fig = plt.figure(figsize=(10, 8))
ax = fig.add_subplot(111, projection='3d')
surf = ax.plot_surface(X, Y, Z, cmap=cmap, linewidth=0, antialiased=False)
ax.set_xlabel('X - how2matplotlib.com')
ax.set_ylabel('Y - how2matplotlib.com')
ax.set_zlabel('Z - how2matplotlib.com')
plt.title('3D Surface with Custom Colormap')
plt.colorbar(surf)
plt.show()
Output:
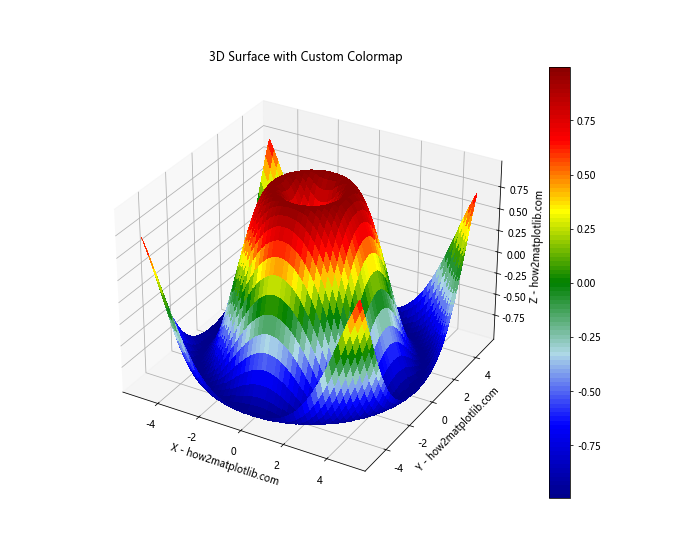
In this example, we’ve created a custom colormap that transitions through a series of colors. This allows for more control over the visual appearance of our 3D surface.
Adding Contour Lines
We can enhance our 3D surface plots by adding contour lines. These can help highlight the shape and features of the surface. Here’s how to do it:
import numpy as np
import matplotlib.pyplot as plt
from mpl_toolkits.mplot3d import Axes3D

def surface_func(x, y):
    return np.sin(np.sqrt(x**2 + y**2))

x = np.linspace(-5, 5, 100)
y = np.linspace(-5, 5, 100)
X, Y = np.meshgrid(x, y)
Z = surface_func(X, Y)

fig = plt.figure(figsize=(12, 8))
ax = fig.add_subplot(111, projection='3d')

# Plot the surface
surf = ax.plot_surface(X, Y, Z, cmap='viridis', alpha=0.8)

# Add contour lines
contours = ax.contour(X, Y, Z, zdir='z', offset=-2, cmap='coolwarm')
ax.clabel(contours, fontsize=8, colors='k')

ax.set_xlabel('X - how2matplotlib.com')
ax.set_ylabel('Y - how2matplotlib.com')
ax.set_zlabel('Z - how2matplotlib.com')
ax.set_zlim(-2, 1)
plt.title('3D Surface with Contour Lines')
plt.colorbar(surf)
plt.show()
Output:
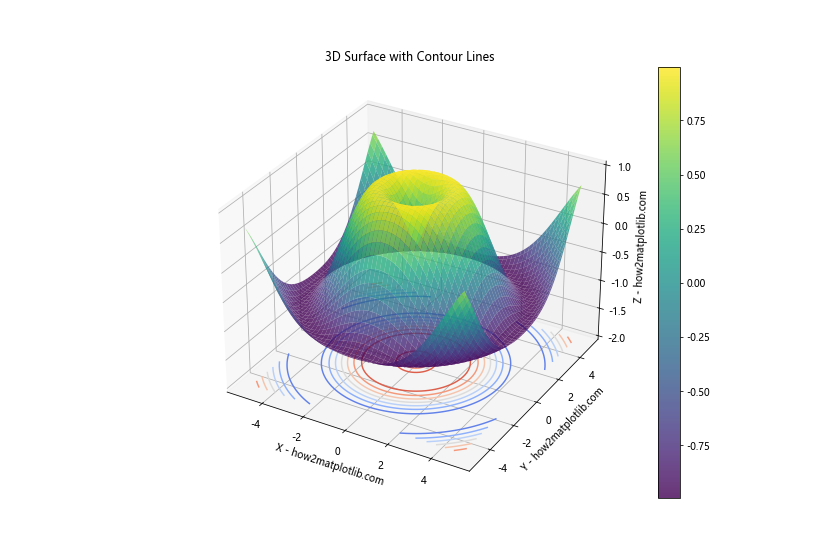
In this example, we’ve added contour lines to the base of our 3D plot. These lines provide additional information about the shape of the surface.
Handling Complex Parametric Equations
When rendering 3D surfaces using parametric equations in Python, we sometimes encounter complex equations that require special handling. Let’s look at some techniques for dealing with these situations.
Using Complex Numbers
Some parametric equations involve complex numbers. Python’s numpy library provides excellent support for complex number calculations. Here’s an example:
import numpy as np
import matplotlib.pyplot as plt
from mpl_toolkits.mplot3d import Axes3D

def complex_surface(u, v):
    z = u + 1j*v
    w = z**2 + 1/z
    return np.real(w), np.imag(w), np.abs(w)

u = np.linspace(-2, 2, 100)
v = np.linspace(-2, 2, 100)
U, V = np.meshgrid(u, v)

X, Y, Z = complex_surface(U, V)

fig = plt.figure(figsize=(10, 8))
ax = fig.add_subplot(111, projection='3d')
surf = ax.plot_surface(X, Y, Z, cmap='viridis', linewidth=0, antialiased=False)
ax.set_xlabel('Real - how2matplotlib.com')
ax.set_ylabel('Imaginary - how2matplotlib.com')
ax.set_zlabel('Magnitude - how2matplotlib.com')
plt.title('Rendering Complex Function as 3D Surface')
plt.colorbar(surf)
plt.show()
Output:
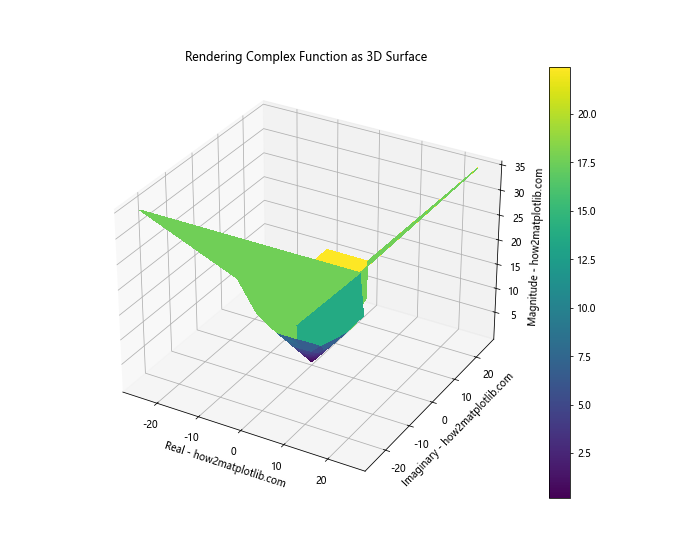
In this example, we’ve used complex numbers to create a 3D surface. The real and imaginary parts of the complex function are used for the X and Y coordinates, while the magnitude is used for the Z coordinate.
Handling Discontinuities
Some parametric equations may have discontinuities or undefined regions. We need to handle these carefully to avoid errors or misleading visualizations. Here’s an example:
import numpy as np
import matplotlib.pyplot as plt
from mpl_toolkits.mplot3d import Axes3D

def discontinuous_surface(x, y):
    z = np.sin(1/x) * np.cos(1/y)
    z[np.abs(x) < 0.1] = np.nan  # Set values near x=0 to NaN
    z[np.abs(y) < 0.1] = np.nan  # Set values near y=0 to NaN
    return z

x = np.linspace(-1, 1, 500)
y = np.linspace(-1, 1, 500)
X, Y = np.meshgrid(x, y)

Z = discontinuous_surface(X, Y)

fig = plt.figure(figsize=(10, 8))
ax = fig.add_subplot(111, projection='3d')
surf = ax.plot_surface(X, Y, Z, cmap='viridis', linewidth=0, antialiased=False)
ax.set_xlabel('X - how2matplotlib.com')
ax.set_ylabel('Y - how2matplotlib.com')
ax.set_zlabel('Z - how2matplotlib.com')
plt.title('Rendering Discontinuous Surface')
plt.colorbar(surf)
plt.show()
Output:
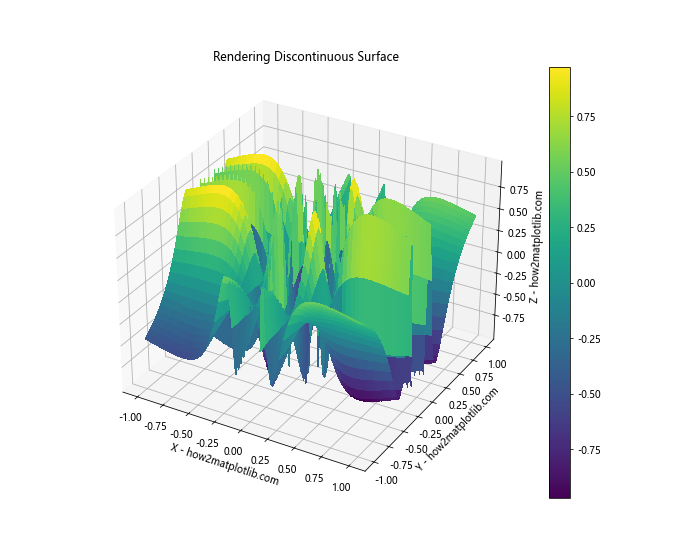
In this example, we've created a surface with discontinuities near x=0 and y=0. We've handled these by setting the z values in these regions to NaN (Not a Number), which Matplotlib will not plot.
Optimizing for Large Datasets
When rendering 3D surfaces using parametric equations in Python, we may sometimes need to work with large datasets. This can lead to performance issues and memory constraints. Let's explore some techniques for optimizing our code for large datasets.
Downsampling
One simple technique for handling large datasets is downsampling. This involves reducing the resolution of our data to make it more manageable. Here's an example:
import numpy as np
import matplotlib.pyplot as plt
from mpl_toolkits.mplot3d import Axes3D

def large_surface(x, y):
    return np.sin(0.1 * x) * np.cos(0.1 * y)

x = np.linspace(-50, 50, 1000)
y = np.linspace(-50, 50, 1000)
X, Y = np.meshgrid(x, y)

Z = large_surface(X, Y)

# Downsample the data
downsample_factor = 5
X_downsampled = X[::downsample_factor, ::downsample_factor]
Y_downsampled = Y[::downsample_factor, ::downsample_factor]
Z_downsampled = Z[::downsample_factor, ::downsample_factor]

fig = plt.figure(figsize=(10, 8))
ax = fig.add_subplot(111, projection='3d')
surf = ax.plot_surface(X_downsampled, Y_downsampled, Z_downsampled, cmap='viridis', linewidth=0, antialiased=False)
ax.set_xlabel('X - how2matplotlib.com')
ax.set_ylabel('Y - how2matplotlib.com')
ax.set_zlabel('Z - how2matplotlib.com')
plt.title('Rendering Large Surface with Downsampling')
plt.colorbar(surf)
plt.show()
Output:
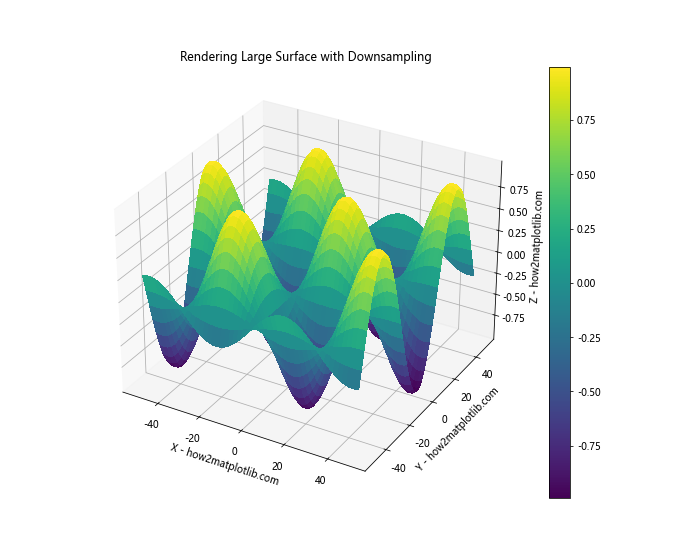
In this example, we've created a large dataset and then downsampled it by taking every 5th point in each dimension. This significantly reduces the amount of data we need to render, improving performance.
Using Sparse Matrices
For very large datasets, we can use sparse matrices to save memory. Sparse matrices only store non-zero elements, which can be very efficient for datasets with many zero or NaN values. Here's an example:
import numpy as np
import matplotlib.pyplot as plt
from mpl_toolkits.mplot3d import Axes3D
from scipy.sparse import csr_matrix

def sparse_surface(x, y):
    z = np.sin(x) * np.cos(y)
    z[np.abs(z) < 0.1] = 0  # Set small values to zero
    return csr_matrix(z)

x = np.linspace(-10, 10, 1000)
y = np.linspace(-10, 10, 1000)
X, Y = np.meshgrid(x, y)

Z = sparse_surface(X, Y)

fig = plt.figure(figsize=(10, 8))
ax = fig.add_subplot(111, projection='3d')
surf = ax.plot_surface(X, Y, Z.toarray(), cmap='viridis', linewidth=0, antialiased=False)
ax.set_xlabel('X - how2matplotlib.com')
ax.set_ylabel('Y - how2matplotlib.com')
ax.set_zlabel('Z - how2matplotlib.com')
plt.title('Rendering Surface with Sparse Matrix')
plt.colorbar(surf)
plt.show()
Output:
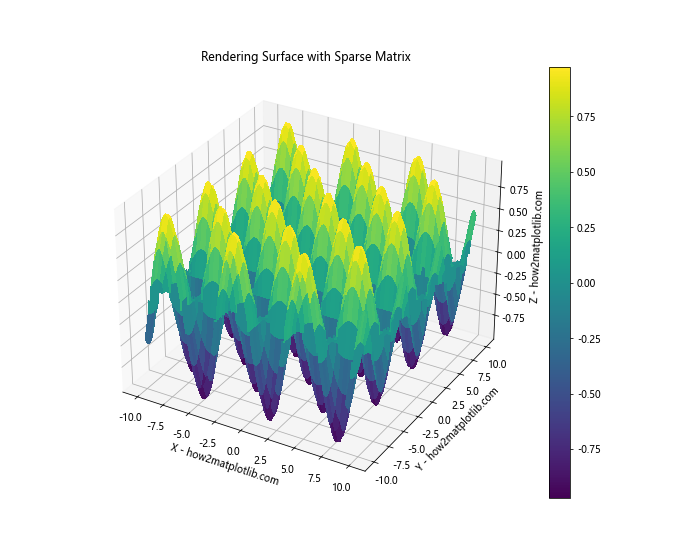
In this example, we've used a sparse matrix to store our surface data. This can be particularly useful for surfaces with many flat or zero-valued regions.
Interactive 3D Surface Rendering
One of the most powerful features when rendering 3D surfaces using parametric equations in Python is the ability to create interactive visualizations. This allows users to rotate, zoom, and explore the surface in real-time. Let's look at how we can create interactive 3D surface plots.
Using Matplotlib's Interactive Backend
Matplotlib has built-in support for interactive plots. Here's how we can create an interactive 3D surface plot:
import numpy as np
import matplotlib.pyplot as plt
from mpl_toolkits.mplot3d import Axes3D

def interactive_surface(u, v):
    x = u * np.cos(v)
    y = u * np.sin(v)
    z = np.sin(np.sqrt(u**2 + v**2))
    return x, y, z

u = np.linspace(0, 5, 100)
v = np.linspace(0, 2 * np.pi, 100)
U, V = np.meshgrid(u, v)

X, Y, Z = interactive_surface(U, V)

plt.ion()  # Turn on interactive mode
fig = plt.figure(figsize=(10, 8))
ax = fig.add_subplot(111, projection='3d')
surf = ax.plot_surface(X, Y, Z, cmap='viridis', linewidth=0, antialiased=False)
ax.set_xlabel('X - how2matplotlib.com')
ax.set_ylabel('Y - how2matplotlib.com')
ax.set_zlabel('Z - how2matplotlib.com')
plt.title('Interactive 3D Surface Rendering')
plt.colorbar(surf)
plt.show()

input("Press Enter to exit...")
Output:
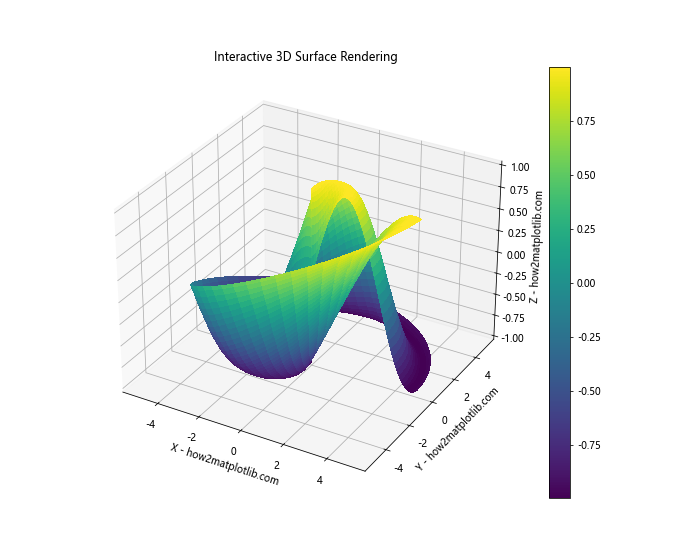
In this example, we've turned on Matplotlib's interactive mode with plt.ion(). This allows users to interact with the plot, rotating and zooming the surface.
Using Plotly for Interactive 3D Surfaces
For more advanced interactive visualizations, we can use libraries like Plotly. Plotly provides a wide range of interactive features and can create web-based visualizations. Here's an example:
import numpy as np
import plotly.graph_objects as go

def plotly_surface(u, v):
    x = u * np.cos(v)
    y = u * np.sin(v)
    z = np.sin(np.sqrt(u**2 + v**2))
    return x, y, z

u = np.linspace(0, 5, 100)
v = np.linspace(0, 2 * np.pi, 100)
U, V = np.meshgrid(u, v)

X, Y, Z = plotly_surface(U, V)

fig = go.Figure(data=[go.Surface(x=X, y=Y, z=Z)])
fig.update_layout(title='Interactive 3D Surface with Plotly',
                  scene = dict(
                      xaxis_title='X - how2matplotlib.com',
                      yaxis_title='Y - how2matplotlib.com',
                      zaxis_title='Z - how2matplotlib.com'))
fig.show()
This example creates an interactive 3D surface plot using Plotly. Users can rotate, zoom, and pan the surface, as well as hover over points to see their exact values.
Combining 3D Surface Rendering with Other Visualization Techniques
Rendering 3D surfaces using parametric equations in Python can be even more powerful when combined with other visualization techniques. Let's explore some ways to enhance our 3D surface plots with additional visual elements.
Adding Scatter Points
We can add scatter points to our 3D surface to highlight specific features or data points. Here's an example:
import numpy as np
import matplotlib.pyplot as plt
from mpl_toolkits.mplot3d import Axes3D

def surface_with_points(x, y):
    return np.sin(np.sqrt(x**2 + y**2))

x = np.linspace(-5, 5, 100)
y = np.linspace(-5, 5, 100)
X, Y = np.meshgrid(x, y)
Z = surface_with_points(X, Y)

fig = plt.figure(figsize=(12, 8))
ax = fig.add_subplot(111, projection='3d')

# Plot the surface
surf = ax.plot_surface(X, Y, Z, cmap='viridis', alpha=0.8)

# Add scatter points
n_points = 20
random_x = np.random.uniform(-5, 5, n_points)
random_y = np.random.uniform(-5, 5, n_points)
random_z = surface_with_points(random_x, random_y)
ax.scatter(random_x, random_y, random_z, c='red', s=50)

ax.set_xlabel('X - how2matplotlib.com')
ax.set_ylabel('Y - how2matplotlib.com')
ax.set_zlabel('Z - how2matplotlib.com')
plt.title('3D Surface with Scatter Points')
plt.colorbar(surf)
plt.show()
Output:
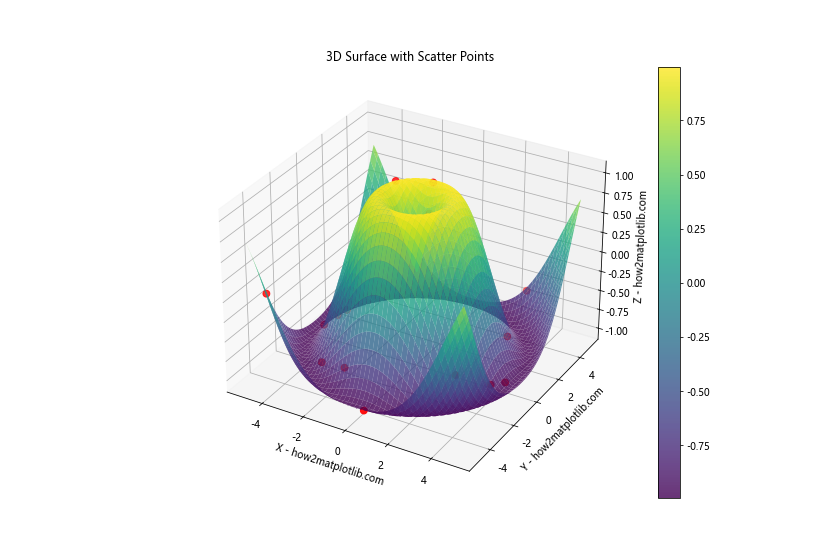
In this example, we've added random scatter points on top of our 3D surface. This can be useful for highlighting specific data points or features of interest.
Adding Vector Fields
We can also combine 3D surface rendering with vector fields to visualize additional information. Here's an example:
import numpy as np
import matplotlib.pyplot as plt
from mpl_toolkits.mplot3d import Axes3D

def surface_func(x, y):
    return np.sin(np.sqrt(x**2 + y**2))

def vector_field(x, y):
    u = -y / (x**2 + y**2)
    v = x / (x**2 + y**2)
    return u, v

x = np.linspace(-5, 5, 20)
y = np.linspace(-5, 5, 20)
X, Y = np.meshgrid(x, y)
Z = surface_func(X, Y)

U, V = vector_field(X, Y)
W = np.zeros_like(U)

fig = plt.figure(figsize=(12, 8))
ax = fig.add_subplot(111, projection='3d')

# Plot the surface
surf = ax.plot_surface(X, Y, Z, cmap='viridis', alpha=0.8)

# Add vector field
ax.quiver(X, Y, Z, U, V, W, length=0.5, normalize=True, color='red')

ax.set_xlabel('X - how2matplotlib.com')
ax.set_ylabel('Y - how2matplotlib.com')
ax.set_zlabel('Z - how2matplotlib.com')
plt.title('3D Surface with Vector Field')
plt.colorbar(surf)
plt.show()
Output:
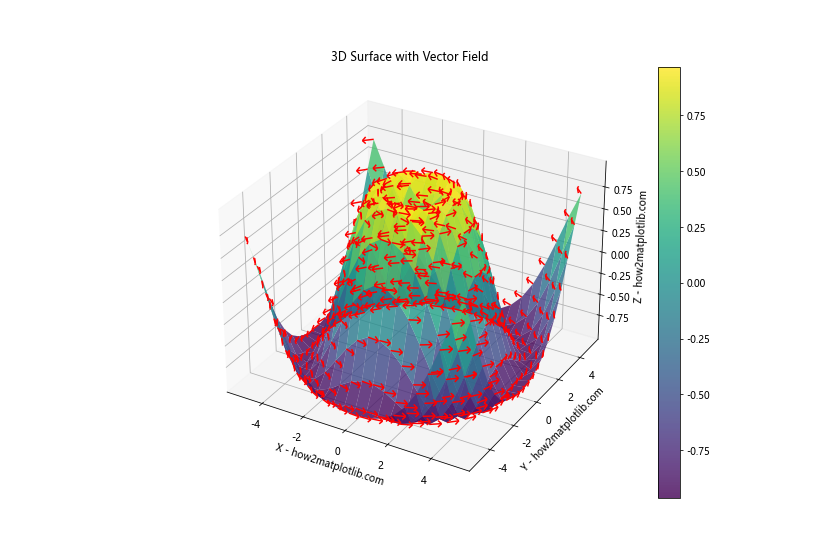
In this example, we've added a vector field on top of our 3D surface. This can be useful for visualizing gradients, flows, or other directional information related to the surface.
Conclusion
Rendering 3D surfaces using parametric equations in Python is a powerful technique that allows us to visualize complex mathematical functions and create stunning three-dimensional graphics. Throughout this article, we've explored various aspects of this topic, from the basics of parametric equations to advanced rendering techniques.
We've covered a wide range of topics, including:
- Understanding parametric equations and their application in 3D surface rendering
- Exploring different types of 3D surfaces, such as spheres, tori, and more complex mathematical objects
- Advanced techniques for enhancing our visualizations, including adding color, texture, and animations
- Optimizing performance when working with large datasets
- Incorporating physical models and complex mathematical concepts into our renderings
- Creating interactive 3D surface plots for more engaging visualizations
- Combining 3D surface rendering with other visualization techniques like scatter plots and vector fields
By mastering these techniques, you'll be well-equipped to create sophisticated 3D visualizations using parametric equations in Python. Whether you're working in mathematics, physics, engineering, or any other field that requires 3D visualization, the skills you've learned here will be invaluable.
Remember, the key to becoming proficient in rendering 3D surfaces using parametric equations is practice. Experiment with different equations, try out various customization techniques, and don't be afraid to push the boundaries of what's possible with Python and Matplotlib.