How to Plot Only the Upper/Lower Triangle of a Heatmap in Matplotlib
Plotting only the upper/lower triangle of a heatmap in Matplotlib is a powerful technique for visualizing symmetric matrices or correlation data. This article will explore various methods and techniques to achieve this effect, providing detailed explanations and code examples along the way.
Introduction to Heatmap Triangles in Matplotlib
When working with symmetric matrices or correlation data, plotting only the upper or lower triangle of a heatmap can be an effective way to present information without redundancy. Matplotlib, a popular plotting library in Python, offers several approaches to achieve this visualization technique.
Let’s start with a basic example of plotting only the upper triangle of a heatmap:
import numpy as np
import matplotlib.pyplot as plt

# Generate sample data
data = np.random.rand(5, 5)

# Create a mask for the upper triangle
mask = np.triu(np.ones_like(data, dtype=bool))

# Create the heatmap
plt.figure(figsize=(8, 6))
plt.imshow(np.ma.masked_array(data, mask), cmap='viridis')
plt.colorbar()
plt.title('Upper Triangle Heatmap - how2matplotlib.com')
plt.show()
Output:
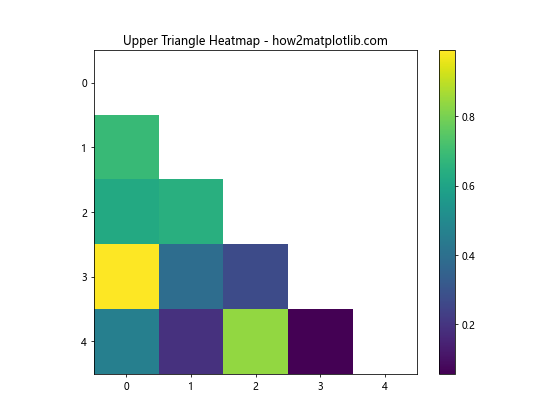
In this example, we use NumPy to create a mask for the upper triangle and apply it to our data using np.ma.masked_array(). This effectively hides the lower triangle of the heatmap.
Understanding the Masking Technique
The key to plotting only the upper or lower triangle of a heatmap in Matplotlib lies in creating an appropriate mask. Let’s delve deeper into this technique:
import numpy as np
import matplotlib.pyplot as plt

# Generate sample data
data = np.random.rand(6, 6)

# Create masks for upper and lower triangles
upper_mask = np.triu(np.ones_like(data, dtype=bool), k=1)
lower_mask = np.tril(np.ones_like(data, dtype=bool), k=-1)

# Plot upper triangle
plt.figure(figsize=(10, 5))
plt.subplot(121)
plt.imshow(np.ma.masked_array(data, upper_mask), cmap='coolwarm')
plt.title('Upper Triangle - how2matplotlib.com')
plt.colorbar()

# Plot lower triangle
plt.subplot(122)
plt.imshow(np.ma.masked_array(data, lower_mask), cmap='coolwarm')
plt.title('Lower Triangle - how2matplotlib.com')
plt.colorbar()

plt.tight_layout()
plt.show()
Output:
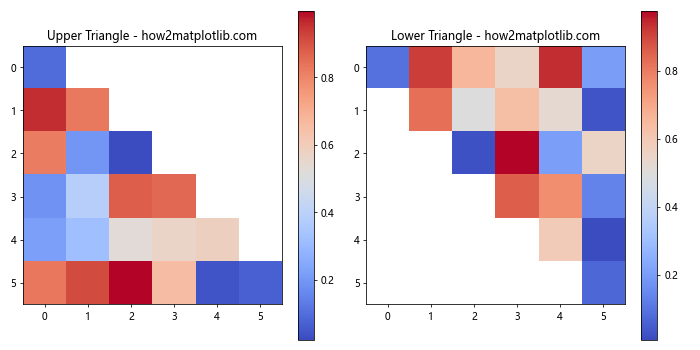
In this example, we create separate masks for the upper and lower triangles using np.triu() and np.tril() respectively. The k parameter in these functions allows us to adjust the diagonal along which the masking occurs.
Customizing the Heatmap Appearance
When plotting only the upper/lower triangle of a heatmap in Matplotlib, you can customize various aspects of the plot to enhance its appearance and readability. Let’s explore some customization options:
import numpy as np
import matplotlib.pyplot as plt

# Generate sample data
data = np.random.rand(8, 8)

# Create a mask for the lower triangle
mask = np.tril(np.ones_like(data, dtype=bool))

# Create the heatmap with customizations
plt.figure(figsize=(10, 8))
plt.imshow(np.ma.masked_array(data, mask), cmap='YlOrRd', aspect='auto')
plt.colorbar(label='Value')
plt.title('Customized Upper Triangle Heatmap - how2matplotlib.com', fontsize=16)
plt.xticks(range(8), ['A', 'B', 'C', 'D', 'E', 'F', 'G', 'H'])
plt.yticks(range(8), ['A', 'B', 'C', 'D', 'E', 'F', 'G', 'H'])
plt.tick_params(axis='both', which='major', labelsize=12)
plt.grid(False)
plt.show()
Output:
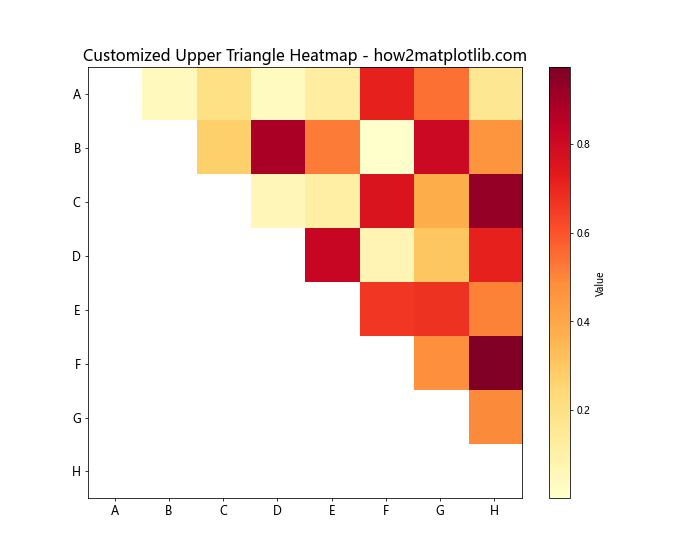
In this example, we’ve customized the colormap, added labels to the axes, adjusted the font sizes, and removed the grid. These customizations help to create a more polished and informative heatmap.
Adding Annotations to the Heatmap
When plotting only the upper/lower triangle of a heatmap in Matplotlib, you may want to add annotations to provide additional information. Here’s an example of how to add text annotations to the visible cells:
import numpy as np
import matplotlib.pyplot as plt

# Generate sample data
data = np.random.rand(5, 5)

# Create a mask for the lower triangle
mask = np.tril(np.ones_like(data, dtype=bool))

# Create the heatmap
fig, ax = plt.subplots(figsize=(8, 6))
im = ax.imshow(np.ma.masked_array(data, mask), cmap='viridis')

# Add colorbar
cbar = ax.figure.colorbar(im, ax=ax)
cbar.ax.set_ylabel('Value', rotation=-90, va="bottom")

# Add annotations
for i in range(5):
    for j in range(i+1, 5):
        text = ax.text(j, i, f'{data[i, j]:.2f}',
                       ha="center", va="center", color="w")

ax.set_title('Annotated Upper Triangle Heatmap - how2matplotlib.com')
plt.show()
Output:
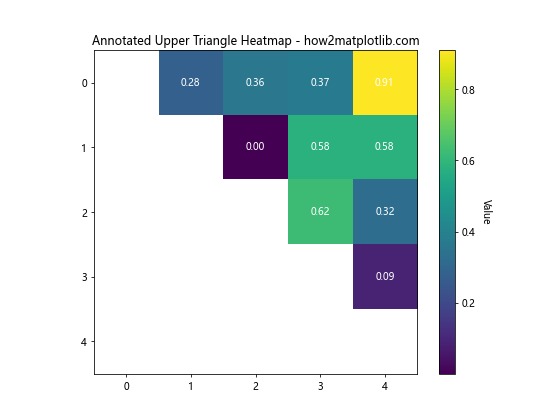
This example demonstrates how to add text annotations to each visible cell in the upper triangle of the heatmap. The annotations display the actual values from the data matrix.
Handling Symmetric Matrices
When plotting only the upper/lower triangle of a heatmap in Matplotlib, it’s common to work with symmetric matrices, such as correlation matrices. Here’s an example of how to handle a symmetric matrix:
import numpy as np
import matplotlib.pyplot as plt

# Generate a symmetric matrix (correlation matrix)
np.random.seed(42)
data = np.random.rand(6, 6)
corr_matrix = np.corrcoef(data)

# Create a mask for the upper triangle
mask = np.triu(np.ones_like(corr_matrix, dtype=bool))

# Create the heatmap
plt.figure(figsize=(10, 8))
plt.imshow(np.ma.masked_array(corr_matrix, mask), cmap='RdYlBu_r', vmin=-1, vmax=1)
plt.colorbar(label='Correlation')
plt.title('Correlation Matrix (Lower Triangle) - how2matplotlib.com', fontsize=16)
plt.xticks(range(6), ['Var1', 'Var2', 'Var3', 'Var4', 'Var5', 'Var6'])
plt.yticks(range(6), ['Var1', 'Var2', 'Var3', 'Var4', 'Var5', 'Var6'])
plt.tight_layout()
plt.show()
Output:
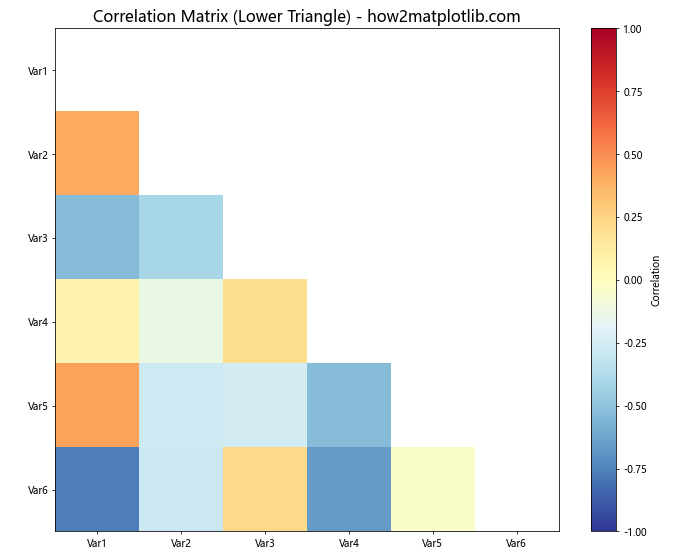
In this example, we generate a correlation matrix and plot only the lower triangle. The colormap is set to diverge around zero, which is typical for correlation matrices.
Using Seaborn for Enhanced Heatmaps
While Matplotlib provides great flexibility, the Seaborn library, built on top of Matplotlib, offers some convenient functions for plotting heatmaps, including the ability to mask certain areas. Here’s an example of using Seaborn to plot only the upper triangle of a heatmap:
import numpy as np
import matplotlib.pyplot as plt
import seaborn as sns

# Generate sample data
np.random.seed(0)
data = np.random.rand(10, 10)

# Create a mask for the lower triangle
mask = np.tril(np.ones_like(data, dtype=bool))

# Create the heatmap using Seaborn
plt.figure(figsize=(10, 8))
sns.heatmap(data, mask=mask, cmap='viridis', annot=True, fmt='.2f', square=True)
plt.title('Upper Triangle Heatmap with Seaborn - how2matplotlib.com', fontsize=16)
plt.tight_layout()
plt.show()
Output:
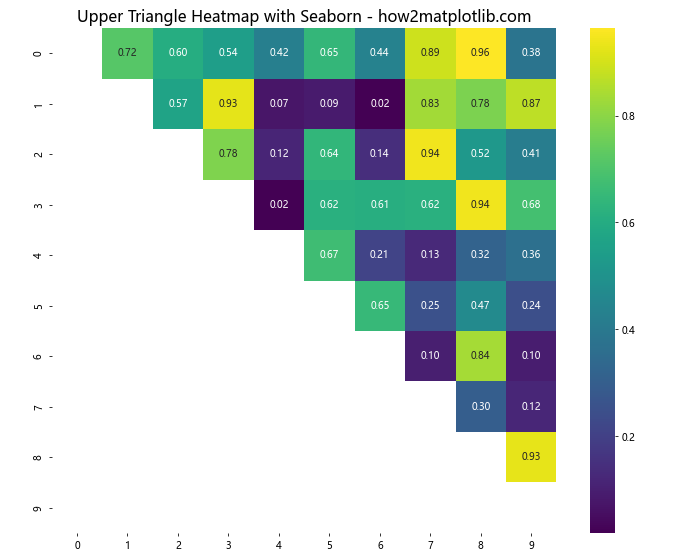
Seaborn’s heatmap function provides a convenient way to create heatmaps with built-in support for masking and annotations.
Combining Upper and Lower Triangles
Sometimes, you might want to display different information in the upper and lower triangles of a heatmap. Here’s an example of how to achieve this effect:
import numpy as np
import matplotlib.pyplot as plt

# Generate two sets of sample data
data1 = np.random.rand(6, 6)
data2 = np.random.rand(6, 6)

# Create masks for upper and lower triangles
upper_mask = np.tril(np.ones_like(data1, dtype=bool))
lower_mask = np.triu(np.ones_like(data2, dtype=bool))

# Combine the data
combined_data = np.ma.masked_array(data1, mask=upper_mask) + np.ma.masked_array(data2, mask=lower_mask)

# Create the heatmap
plt.figure(figsize=(10, 8))
plt.imshow(combined_data, cmap='coolwarm')
plt.colorbar(label='Value')
plt.title('Combined Upper and Lower Triangle Heatmap - how2matplotlib.com', fontsize=16)
plt.xticks(range(6), ['A', 'B', 'C', 'D', 'E', 'F'])
plt.yticks(range(6), ['A', 'B', 'C', 'D', 'E', 'F'])
plt.tight_layout()
plt.show()
Output:
This example demonstrates how to combine two different datasets into a single heatmap, with one dataset displayed in the upper triangle and the other in the lower triangle.
Handling Large Datasets
When plotting only the upper/lower triangle of a heatmap in Matplotlib for large datasets, performance and readability can become issues. Here’s an approach to handle larger datasets:
import numpy as np
import matplotlib.pyplot as plt

# Generate a large sample dataset
np.random.seed(42)
data = np.random.rand(50, 50)

# Create a mask for the upper triangle
mask = np.triu(np.ones_like(data, dtype=bool))

# Create the heatmap
plt.figure(figsize=(12, 10))
plt.imshow(np.ma.masked_array(data, mask), cmap='viridis', aspect='auto')
plt.colorbar(label='Value')
plt.title('Large Dataset Lower Triangle Heatmap - how2matplotlib.com', fontsize=16)

# Adjust tick labels for readability
plt.xticks(range(0, 50, 5), range(0, 50, 5))
plt.yticks(range(0, 50, 5), range(0, 50, 5))

plt.tight_layout()
plt.show()
Output:
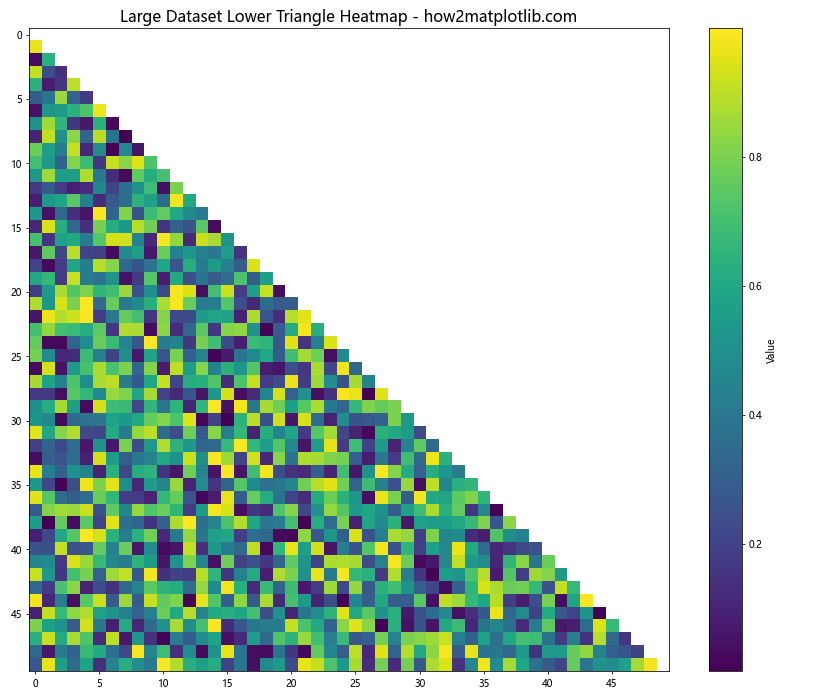
In this example, we’ve used a larger dataset and adjusted the tick labels to improve readability. The aspect='auto' parameter in imshow() helps to fit the heatmap to the figure size.
Creating Interactive Heatmaps
While static heatmaps are useful, interactive heatmaps can provide even more insights. Here’s an example using Matplotlib’s interactive features to create a zoomable heatmap:
import numpy as np
import matplotlib.pyplot as plt
from matplotlib.widgets import RectangleSelector

def onselect(eclick, erelease):
    x1, y1 = eclick.xdata, eclick.ydata
    x2, y2 = erelease.xdata, erelease.ydata
    ax.set_xlim(min(x1, x2), max(x1, x2))
    ax.set_ylim(min(y1, y2), max(y1, y2))
    fig.canvas.draw_idle()

# Generate sample data
data = np.random.rand(20, 20)

# Create a mask for the lower triangle
mask = np.tril(np.ones_like(data, dtype=bool))

# Create the heatmap
fig, ax = plt.subplots(figsize=(10, 8))
im = ax.imshow(np.ma.masked_array(data, mask), cmap='viridis')
plt.colorbar(im, label='Value')
ax.set_title('Interactive Upper Triangle Heatmap - how2matplotlib.com', fontsize=16)

# Add the RectangleSelector
rs = RectangleSelector(ax, onselect, drawtype='box', useblit=True,
                       button=[1], minspanx=5, minspany=5, spancoords='pixels',
                       interactive=True)

plt.show()
This example creates an interactive heatmap where users can click and drag to zoom into specific areas of the upper triangle.
Applying Custom Color Normalization
When plotting only the upper/lower triangle of a heatmap in Matplotlib, you might want to apply custom color normalization to highlight specific ranges of values. Here’s an example using logarithmic normalization:
import numpy as np
import matplotlib.pyplot as plt
from matplotlib.colors import LogNorm

# Generate sample data with a wide range of values
data = np.random.lognormal(mean=0, sigma=2, size=(10, 10))

# Create a mask for the upper triangle
mask = np.triu(np.ones_like(data, dtype=bool))

# Create the heatmap with logarithmic normalization
plt.figure(figsize=(10, 8))
plt.imshow(np.ma.masked_array(data, mask), norm=LogNorm(), cmap='viridis')
plt.colorbar(label='Value (log scale)')
plt.title('Lower Triangle Heatmap with Log Normalization - how2matplotlib.com', fontsize=16)
plt.xticks(range(10))
plt.yticks(range(10))
plt.tight_layout()
plt.show()
Output:
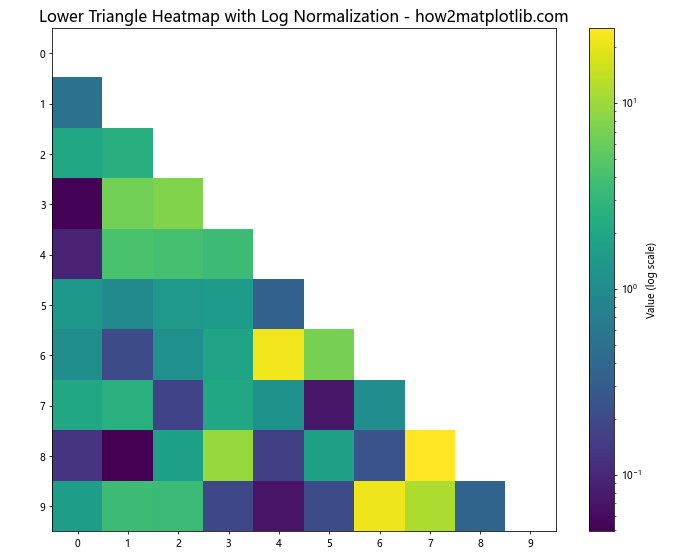
This example uses LogNorm() to apply logarithmic scaling to the color mapping, which can be useful for data with a wide range of values.
Adding a Diagonal Line
When plotting only the upper/lower triangle of a heatmap in Matplotlib, you might want to add a diagonal line to clearly separate the two triangles. Here’s how to achieve this effect:
import numpy as np
import matplotlib.pyplot as plt

# Generate sample data
data = np.random.rand(8, 8)

# Create a mask for the lower triangle
mask = np.tril(np.ones_like(data, dtype=bool))

# Create the heatmap
fig, ax = plt.subplots(figsize=(10, 8))
im = ax.imshow(np.ma.masked_array(data, mask), cmap='YlOrRd')
plt.colorbar(im, label='Value')

# Add diagonal line
ax.plot([0, 7], [0, 7], color='black', linewidth=2)

ax.set_title('Upper Triangle Heatmap with Diagonal - how2matplotlib.com', fontsize=16)
ax.set_xticks(range(8))
ax.set_yticks(range(8))
plt.tight_layout()
plt.show()
Output:
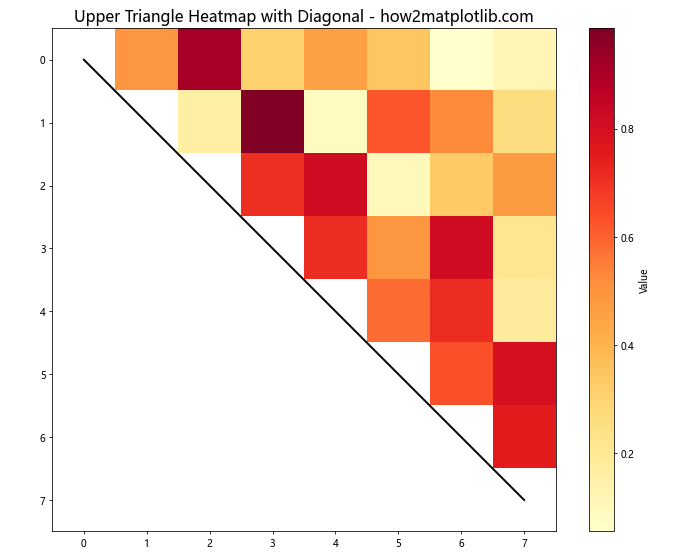
This example adds a black diagonal line to the heatmap, providing a clear visual separation between the upper and lower triangles.
Advanced Techniques for Triangular Heatmaps
Let’s explore some more advanced techniques for plotting only the upper/lower triangle of a heatmap in Matplotlib.
Using MultiIndex for Complex Labeling
When dealing with hierarchical data, you might want to use MultiIndex labels for your heatmap. Here’s an example:
import numpy as np
import matplotlib.pyplot as plt
import pandas as pd

# Create a MultiIndex
index = pd.MultiIndex.from_product([['A', 'B'], ['X', 'Y', 'Z']], names=['Group', 'Subgroup'])
columns = pd.MultiIndex.from_product([['1', '2'], ['a', 'b', 'c']], names=['Category', 'Subcategory'])

# Generate sample data
data = np.random.rand(6, 6)
df = pd.DataFrame(data, index=index, columns=columns)

# Create a mask for the upper triangle
mask = np.triu(np.ones_like(df, dtype=bool))

# Create the heatmap
fig, ax = plt.subplots(figsize=(12, 10))
im = ax.imshow(np.ma.masked_array(df, mask), cmap='coolwarm')

# Set tick labels
ax.set_xticks(np.arange(len(columns)))
ax.set_yticks(np.arange(len(index)))
ax.set_xticklabels([f'{c[0]}-{c[1]}' for c in columns])
ax.set_yticklabels([f'{i[0]}-{i[1]}' for i in index])

# Rotate the tick labels and set their alignment
plt.setp(ax.get_xticklabels(), rotation=45, ha="right", rotation_mode="anchor")

# Add colorbar
cbar = ax.figure.colorbar(im, ax=ax)
cbar.ax.set_ylabel('Value', rotation=-90, va="bottom")

# Add title
ax.set_title('Lower Triangle Heatmap with MultiIndex - how2matplotlib.com', fontsize=16)

plt.tight_layout()
plt.show()
Output:
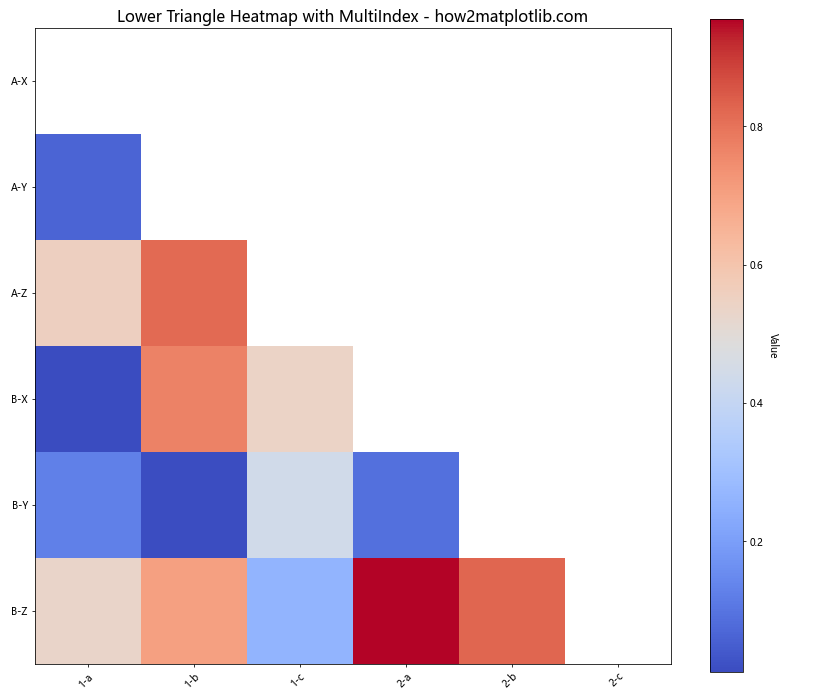
This example demonstrates how to create a heatmap with MultiIndex labels, which can be useful for representing complex, hierarchical data structures.
Combining Heatmap with Other Plot Types
Sometimes, you might want to combine a triangular heatmap with other types of plots for a more comprehensive data visualization. Here’s an example that combines a triangular heatmap with a line plot:
import numpy as np
import matplotlib.pyplot as plt

# Generate sample data
np.random.seed(42)
data = np.random.rand(10, 10)
line_data = np.random.rand(10)

# Create a mask for the upper triangle
mask = np.triu(np.ones_like(data, dtype=bool))

# Create the figure with two subplots
fig, (ax1, ax2) = plt.subplots(1, 2, figsize=(15, 6), gridspec_kw={'width_ratios': [2, 1]})

# Plot the heatmap
im = ax1.imshow(np.ma.masked_array(data, mask), cmap='viridis')
ax1.set_title('Lower Triangle Heatmap - how2matplotlib.com', fontsize=14)
fig.colorbar(im, ax=ax1, label='Value')

# Plot the line plot
ax2.plot(range(10), line_data, marker='o')
ax2.set_title('Complementary Line Plot - how2matplotlib.com', fontsize=14)
ax2.set_xlabel('Index')
ax2.set_ylabel('Value')

plt.tight_layout()
plt.show()
Output:
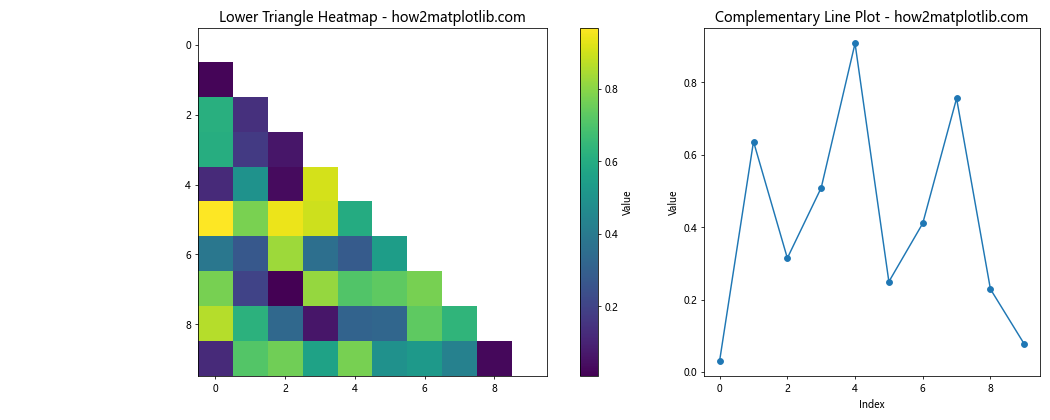
This example shows how to create a figure with two subplots: one for the triangular heatmap and another for a line plot. This combination can be useful for showing different aspects of your data side by side.
Creating a Triangular Heatmap with Unequal Axes
In some cases, you might need to create a triangular heatmap where the x and y axes have different scales or lengths. Here’s an example of how to achieve this:
import numpy as np
import matplotlib.pyplot as plt
from matplotlib.colors import LinearSegmentedColormap

# Generate sample data with unequal dimensions
data = np.random.rand(8, 12)

# Create a custom triangular mask
mask = np.zeros_like(data, dtype=bool)
for i in range(data.shape[0]):
    mask[i, int(i * data.shape[1] / data.shape[0]):] = True

# Create a custom colormap
colors = ['#FFA07A', '#98FB98', '#87CEFA']
n_bins = 100
cmap = LinearSegmentedColormap.from_list('custom', colors, N=n_bins)

# Create the heatmap
fig, ax = plt.subplots(figsize=(12, 8))
im = ax.imshow(np.ma.masked_array(data, mask), cmap=cmap, aspect='auto')

# Add colorbar
cbar = ax.figure.colorbar(im, ax=ax)
cbar.ax.set_ylabel('Value', rotation=-90, va="bottom")

# Set tick labels
ax.set_xticks(np.arange(data.shape[1]))
ax.set_yticks(np.arange(data.shape[0]))
ax.set_xticklabels(range(1, data.shape[1] + 1))
ax.set_yticklabels(range(1, data.shape[0] + 1))

# Add title
ax.set_title('Triangular Heatmap with Unequal Axes - how2matplotlib.com', fontsize=16)

plt.tight_layout()
plt.show()
Output:
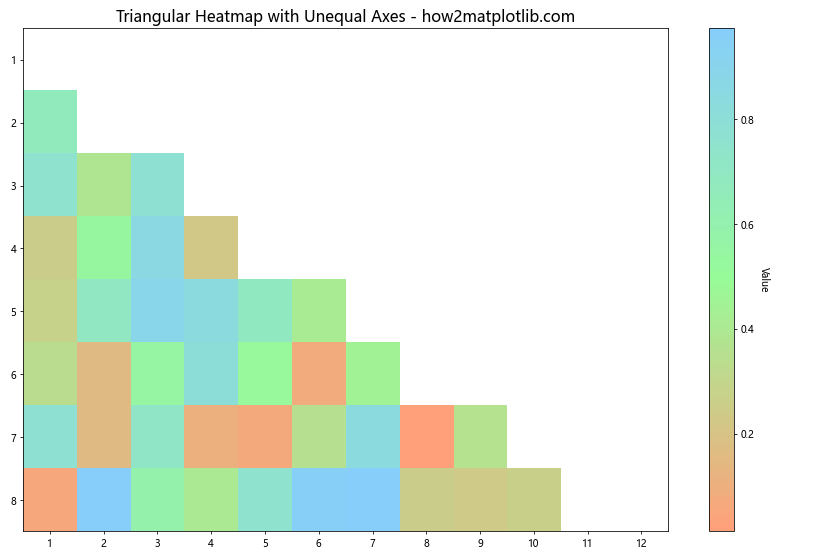
This example demonstrates how to create a triangular heatmap with unequal axes, using a custom mask and a custom colormap. This can be useful when dealing with datasets where the x and y dimensions represent different scales or categories.
Best Practices for Triangular Heatmaps
When plotting only the upper/lower triangle of a heatmap in Matplotlib, consider the following best practices:
- Choose appropriate color schemes: Use color schemes that are colorblind-friendly and perceptually uniform. The ‘viridis’, ‘plasma’, and ‘cividis’ colormaps are good choices.
Add clear labels and titles: Always include informative axis labels, a title, and a colorbar label to make your heatmap easily interpretable.
Consider data normalization: Depending on your data distribution, you might want to apply normalization techniques (e.g., log scale, percentile scale) to better represent the data range.
Use appropriate masking: Ensure that your mask correctly covers the part of the heatmap you want to hide, whether it’s the upper or lower triangle.
Adjust for readability: For large datasets, consider reducing the number of tick labels or using a different labeling strategy to maintain readability.
Add annotations when appropriate: For smaller datasets or key values, consider adding text annotations to provide exact values.
Combine with other visualizations: When relevant, consider combining your triangular heatmap with other plot types to provide a more comprehensive view of your data.
Troubleshooting Common Issues
When plotting only the upper/lower triangle of a heatmap in Matplotlib, you might encounter some common issues. Here are some troubleshooting tips: