How to Master Plotting In A Non-Blocking Way With Matplotlib
Plotting in a non-blocking way with Matplotlib is an essential skill for data visualization enthusiasts and professionals alike. This article will delve deep into the intricacies of non-blocking plotting using Matplotlib, providing you with a comprehensive understanding of the topic. We’ll explore various techniques, best practices, and real-world examples to help you master the art of plotting in a non-blocking way with Matplotlib.
Understanding Non-Blocking Plotting in Matplotlib
Before we dive into the specifics of plotting in a non-blocking way with Matplotlib, it’s crucial to understand what non-blocking plotting means and why it’s important. Non-blocking plotting refers to the ability to create and display plots without halting the execution of your Python script. This approach is particularly useful when you want to create interactive visualizations or when you need to update plots in real-time.
Matplotlib, being one of the most popular data visualization libraries in Python, offers several methods to achieve non-blocking plotting. By leveraging these techniques, you can create dynamic and responsive visualizations that enhance the user experience and provide real-time insights into your data.
Let’s start with a simple example to illustrate the concept of plotting in a non-blocking way with Matplotlib:
import matplotlib.pyplot as plt
import numpy as np

plt.ion()  # Turn on interactive mode

fig, ax = plt.subplots()
x = np.linspace(0, 10, 100)
line, = ax.plot(x, np.sin(x))

for i in range(100):
    line.set_ydata(np.sin(x + i/10.0))
    ax.set_title(f"Sine Wave - how2matplotlib.com (Frame {i+1})")
    fig.canvas.draw()
    fig.canvas.flush_events()

plt.ioff()  # Turn off interactive mode
plt.show()
Output:
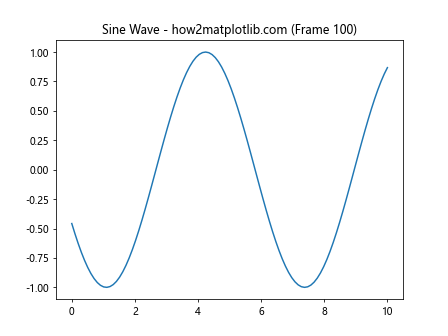
In this example, we use plt.ion() to enable interactive mode, which allows us to update the plot without blocking the script execution. We create a simple sine wave plot and update it in real-time using a loop. The fig.canvas.draw() and fig.canvas.flush_events() calls ensure that the plot is updated and displayed properly.
Techniques for Plotting In A Non-Blocking Way With Matplotlib
Now that we have a basic understanding of non-blocking plotting, let’s explore various techniques to achieve this in Matplotlib:
1. Using plt.ion() and plt.ioff()
The plt.ion() and plt.ioff() functions are fundamental to plotting in a non-blocking way with Matplotlib. They enable and disable interactive mode, respectively. When interactive mode is on, plots are updated immediately after each plotting command, allowing for real-time updates.
Here’s an example demonstrating the use of plt.ion() and plt.ioff():
import matplotlib.pyplot as plt
import numpy as np
import time

plt.ion()  # Turn on interactive mode

fig, ax = plt.subplots()
x = np.linspace(0, 10, 100)
line, = ax.plot(x, np.sin(x))

for i in range(50):
    line.set_ydata(np.sin(x + i/5.0))
    ax.set_title(f"Dynamic Sine Wave - how2matplotlib.com (Frame {i+1})")
    fig.canvas.draw()
    fig.canvas.flush_events()
    time.sleep(0.1)  # Add a small delay to simulate real-time updates

plt.ioff()  # Turn off interactive mode
plt.show()
Output:
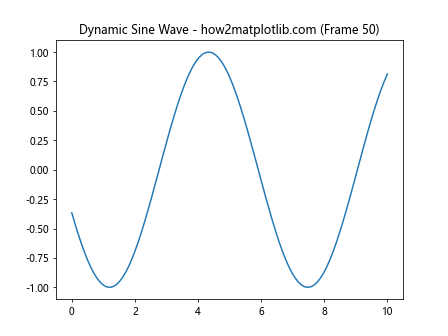
In this example, we create a dynamic sine wave plot that updates 50 times. The time.sleep(0.1) call adds a small delay between updates to simulate real-time data processing.
2. Using FuncAnimation
Matplotlib’s FuncAnimation class provides a powerful way to create animated plots in a non-blocking manner. It allows you to define an update function that is called at regular intervals to modify the plot.
Here’s an example of plotting in a non-blocking way with Matplotlib using FuncAnimation:
import matplotlib.pyplot as plt
import numpy as np
from matplotlib.animation import FuncAnimation

fig, ax = plt.subplots()
x = np.linspace(0, 2 * np.pi, 100)
line, = ax.plot(x, np.sin(x))

def update(frame):
    line.set_ydata(np.sin(x + frame / 10))
    ax.set_title(f"Animated Sine Wave - how2matplotlib.com (Frame {frame+1})")
    return line,

ani = FuncAnimation(fig, update, frames=100, interval=50, blit=True)
plt.show()
Output:
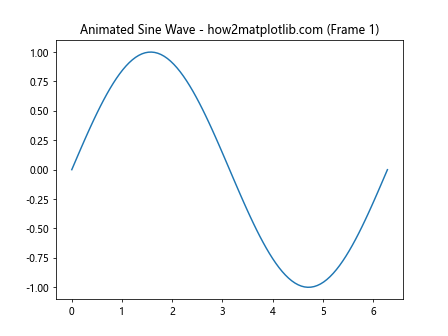
In this example, we define an update function that modifies the y-data of the plot. The FuncAnimation class takes care of calling this function repeatedly, creating a smooth animation of a sine wave.
3. Using the Animation API
Matplotlib’s Animation API provides more fine-grained control over animations, allowing you to create complex, non-blocking visualizations. This approach is particularly useful when you need to animate multiple elements or create custom animation behaviors.
Here’s an example of plotting in a non-blocking way with Matplotlib using the Animation API:
import matplotlib.pyplot as plt
import numpy as np
from matplotlib.animation import Animation

class CustomAnimation(Animation):
    def __init__(self, fig, ax):
        self.fig = fig
        self.ax = ax
        self.x = np.linspace(0, 2 * np.pi, 100)
        self.line, = ax.plot(self.x, np.sin(self.x))
        self.frame = 0
        Animation.__init__(self, fig, interval=50, blit=True)

    def _draw_frame(self, _):
        self.line.set_ydata(np.sin(self.x + self.frame / 10))
        self.ax.set_title(f"Custom Animation - how2matplotlib.com (Frame {self.frame+1})")
        self.frame += 1
        return self.line,

fig, ax = plt.subplots()
anim = CustomAnimation(fig, ax)
plt.show()
In this example, we create a custom CustomAnimation class that inherits from Matplotlib’s Animation class. This approach gives us more control over the animation process and allows for more complex animations.
4. Using plt.pause()
The plt.pause() function is another way to achieve non-blocking plotting with Matplotlib. It allows you to update the plot and pause for a short duration without blocking the script execution.
Here’s an example of plotting in a non-blocking way with Matplotlib using plt.pause():
import matplotlib.pyplot as plt
import numpy as np

fig, ax = plt.subplots()
x = np.linspace(0, 10, 100)
line, = ax.plot(x, np.sin(x))

for i in range(100):
    line.set_ydata(np.sin(x + i/10.0))
    ax.set_title(f"Updating Plot - how2matplotlib.com (Frame {i+1})")
    plt.pause(0.05)

plt.show()
Output:
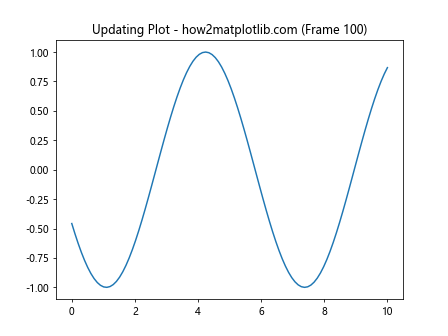
In this example, we use plt.pause(0.05) to update the plot and pause for 50 milliseconds between each update. This creates a smooth animation effect without blocking the script execution.
Advanced Techniques for Non-Blocking Plotting
Now that we’ve covered the basics of plotting in a non-blocking way with Matplotlib, let’s explore some advanced techniques that can enhance your visualizations:
1. Multi-threaded Plotting
When dealing with complex visualizations or real-time data processing, multi-threaded plotting can be a powerful technique. By running the plotting process in a separate thread, you can ensure that your main program remains responsive while updating the plot.
Here’s an example of multi-threaded plotting in a non-blocking way with Matplotlib:
import matplotlib.pyplot as plt
import numpy as np
import threading
import time

class PlotThread(threading.Thread):
    def __init__(self):
        threading.Thread.__init__(self)
        self.daemon = True
        self.fig, self.ax = plt.subplots()
        self.x = np.linspace(0, 10, 100)
        self.line, = self.ax.plot(self.x, np.sin(self.x))

    def run(self):
        plt.ion()
        for i in range(100):
            self.line.set_ydata(np.sin(self.x + i/10.0))
            self.ax.set_title(f"Threaded Plot - how2matplotlib.com (Frame {i+1})")
            self.fig.canvas.draw()
            self.fig.canvas.flush_events()
            time.sleep(0.05)
        plt.ioff()
        plt.show()

plot_thread = PlotThread()
plot_thread.start()

# Simulate main program execution
for i in range(10):
    print(f"Main program running... (Step {i+1})")
    time.sleep(0.5)

plot_thread.join()
In this example, we create a PlotThread class that runs the plotting process in a separate thread. This allows the main program to continue executing while the plot is being updated.
2. Event-driven Plotting
Event-driven plotting is a powerful technique for creating interactive visualizations that respond to user input or external events. Matplotlib provides event handling capabilities that allow you to update plots based on various triggers.
Here’s an example of event-driven plotting in a non-blocking way with Matplotlib:
import matplotlib.pyplot as plt
import numpy as np

fig, ax = plt.subplots()
x = np.linspace(0, 10, 100)
line, = ax.plot(x, np.sin(x))

def on_click(event):
    if event.inaxes == ax:
        phase = event.xdata
        line.set_ydata(np.sin(x + phase))
        ax.set_title(f"Click-driven Plot - how2matplotlib.com (Phase: {phase:.2f})")
        fig.canvas.draw()

fig.canvas.mpl_connect('button_press_event', on_click)
plt.show()
Output:
In this example, we use the mpl_connect method to attach a click event handler to the plot. When the user clicks on the plot, the sine wave is updated based on the x-coordinate of the click.
Best Practices for Non-Blocking Plotting with Matplotlib
When plotting in a non-blocking way with Matplotlib, it’s important to follow some best practices to ensure optimal performance and maintainability:
- Use
plt.ion()andplt.ioff()judiciously: Enable interactive mode only when necessary, and disable it when you’re done with real-time updates. Optimize update frequency: Balance between smooth animations and performance by adjusting the update interval based on your specific use case.
Leverage blitting: Use the
blitparameter in animations to redraw only the parts of the plot that have changed, improving performance.Clear unused plots: Use
plt.close()to close figures that are no longer needed to free up memory.Use appropriate backends: Choose a backend that supports non-blocking plotting, such as Qt or TkAgg.
Handle exceptions gracefully: Implement proper error handling to prevent crashes during non-blocking plotting operations.
Profile your code: Use profiling tools to identify performance bottlenecks in your non-blocking plotting code.
Advanced Applications of Non-Blocking Plotting
Now that we’ve covered the fundamentals and best practices, let’s explore some advanced applications of plotting in a non-blocking way with Matplotlib: