How to Plot a Pie Chart in Python using Matplotlib
Plot a Pie Chart in Python using Matplotlib is an essential skill for data visualization enthusiasts and professionals alike. Matplotlib is a powerful library that allows you to create various types of charts, including pie charts, with ease. In this comprehensive guide, we’ll explore everything you need to know about plotting pie charts using Matplotlib in Python.
Understanding Pie Charts and Their Importance
Before we dive into the specifics of how to plot a pie chart in Python using Matplotlib, let’s first understand what pie charts are and why they’re important. A pie chart is a circular statistical graphic that is divided into slices to illustrate numerical proportions. Each slice represents a category, and the size of the slice corresponds to that category’s proportion of the whole.
Pie charts are particularly useful when you want to show the composition of something or compare parts of a whole. They’re widely used in business presentations, scientific reports, and data journalism to visually represent data in an easily digestible format.
Setting Up Your Environment to Plot a Pie Chart in Python using Matplotlib
To get started with plotting pie charts in Python using Matplotlib, you’ll need to ensure you have the necessary libraries installed. If you haven’t already, you can install Matplotlib using pip:
pip install matplotlib
Once installed, you can import Matplotlib in your Python script:
import matplotlib.pyplot as plt
Now that we have our environment set up, let’s explore how to plot a pie chart in Python using Matplotlib.
Basic Pie Chart Creation
Let’s start with a simple example of how to plot a pie chart in Python using Matplotlib:
import matplotlib.pyplot as plt

# Data for the pie chart
sizes = [30, 20, 25, 15, 10]
labels = ['A', 'B', 'C', 'D', 'E']

# Create the pie chart
plt.pie(sizes, labels=labels, autopct='%1.1f%%')

# Add a title
plt.title('How to Plot a Pie Chart in Python using Matplotlib - how2matplotlib.com')

# Show the plot
plt.show()
Output:
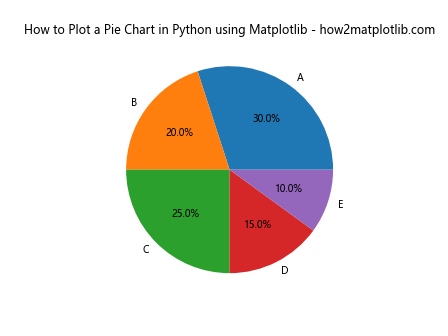
In this example, we’ve created a basic pie chart with five slices. The sizes list contains the values for each slice, and the labels list provides the corresponding labels. The autopct parameter adds percentage labels to each slice.
Customizing Colors in Your Pie Chart
When you plot a pie chart in Python using Matplotlib, you can customize the colors to make your visualization more appealing or to match a specific color scheme. Here’s how you can do that:
import matplotlib.pyplot as plt

sizes = [30, 20, 25, 15, 10]
labels = ['A', 'B', 'C', 'D', 'E']
colors = ['#ff9999', '#66b3ff', '#99ff99', '#ffcc99', '#ff99cc']

plt.pie(sizes, labels=labels, colors=colors, autopct='%1.1f%%')
plt.title('Customized Colors - How to Plot a Pie Chart in Python using Matplotlib - how2matplotlib.com')
plt.show()
Output:
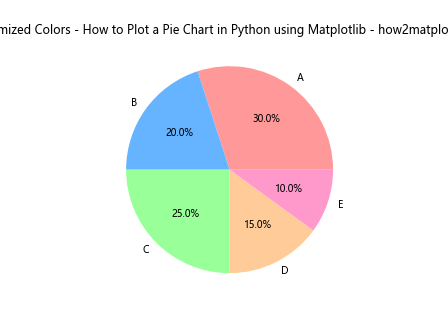
In this example, we’ve added a colors list to specify custom colors for each slice of the pie chart.
Adding Exploded Slices to Your Pie Chart
To emphasize certain slices in your pie chart, you can use the explode parameter when you plot a pie chart in Python using Matplotlib. Here’s an example:
import matplotlib.pyplot as plt

sizes = [30, 20, 25, 15, 10]
labels = ['A', 'B', 'C', 'D', 'E']
explode = (0.1, 0, 0, 0, 0)  # Only "explode" the first slice

plt.pie(sizes, labels=labels, explode=explode, autopct='%1.1f%%')
plt.title('Exploded Pie Chart - How to Plot a Pie Chart in Python using Matplotlib - how2matplotlib.com')
plt.show()
Output:
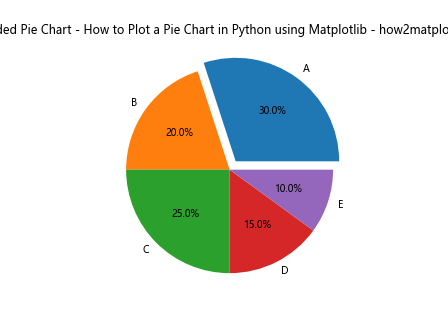
The explode tuple specifies how much each slice should be “pulled out” from the center of the pie.
Creating a Donut Chart
A variation of the pie chart is the donut chart, which has a hole in the center. Here’s how to plot a donut chart in Python using Matplotlib:
import matplotlib.pyplot as plt

sizes = [30, 20, 25, 15, 10]
labels = ['A', 'B', 'C', 'D', 'E']

plt.pie(sizes, labels=labels, autopct='%1.1f%%', pctdistance=0.85)
plt.title('Donut Chart - How to Plot a Pie Chart in Python using Matplotlib - how2matplotlib.com')

# Create a circle at the center to transform it into a donut chart
center_circle = plt.Circle((0,0), 0.70, fc='white')
fig = plt.gcf()
fig.gca().add_artist(center_circle)

plt.show()
Output:
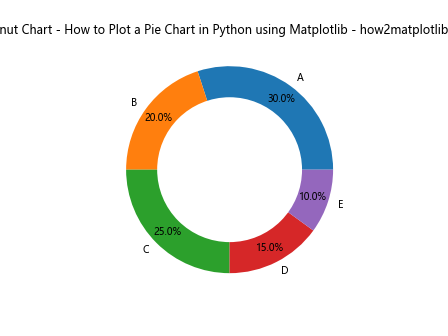
In this example, we’ve added a white circle in the center of the pie chart to create the donut effect.
Adding a Legend to Your Pie Chart
When you plot a pie chart in Python using Matplotlib, you might want to add a legend instead of or in addition to labels on the slices. Here’s how you can do that:
import matplotlib.pyplot as plt

sizes = [30, 20, 25, 15, 10]
labels = ['A', 'B', 'C', 'D', 'E']

plt.pie(sizes, labels=labels, autopct='%1.1f%%')
plt.title('Pie Chart with Legend - How to Plot a Pie Chart in Python using Matplotlib - how2matplotlib.com')
plt.legend(title="Categories")
plt.show()
Output:
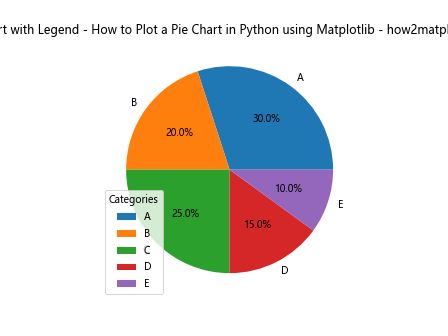
This example adds a legend to the pie chart, which can be useful when you have many categories or long labels.
Adjusting the Start Angle of Your Pie Chart
By default, the first slice of your pie chart starts at the x-axis. However, you can adjust this using the startangle parameter when you plot a pie chart in Python using Matplotlib:
import matplotlib.pyplot as plt

sizes = [30, 20, 25, 15, 10]
labels = ['A', 'B', 'C', 'D', 'E']

plt.pie(sizes, labels=labels, autopct='%1.1f%%', startangle=90)
plt.title('Adjusted Start Angle - How to Plot a Pie Chart in Python using Matplotlib - how2matplotlib.com')
plt.show()
Output:
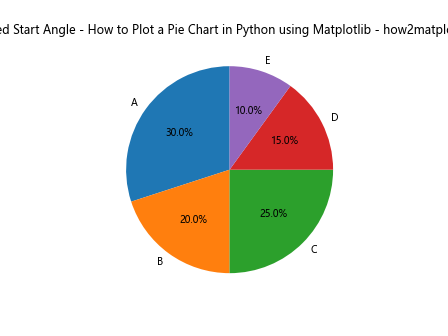
In this example, we’ve set the startangle to 90 degrees, which means the first slice will start at the y-axis.
Creating a Pie Chart from a Pandas DataFrame
Often, when you plot a pie chart in Python using Matplotlib, your data might be in a Pandas DataFrame. Here’s how you can create a pie chart from DataFrame data:
import matplotlib.pyplot as plt
import pandas as pd

# Create a sample DataFrame
data = {'Category': ['A', 'B', 'C', 'D', 'E'],
        'Value': [30, 20, 25, 15, 10]}
df = pd.DataFrame(data)

plt.pie(df['Value'], labels=df['Category'], autopct='%1.1f%%')
plt.title('Pie Chart from DataFrame - How to Plot a Pie Chart in Python using Matplotlib - how2matplotlib.com')
plt.show()
Output:
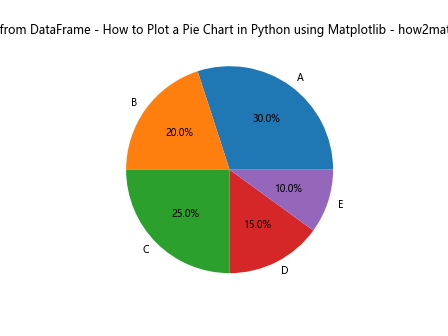
This example demonstrates how to use data from a Pandas DataFrame to create a pie chart.
Adding Data Labels Outside the Pie Chart
When you plot a pie chart in Python using Matplotlib, you might want to place the data labels outside the pie slices for better readability. Here’s how you can achieve this:
import matplotlib.pyplot as plt

sizes = [30, 20, 25, 15, 10]
labels = ['A', 'B', 'C', 'D', 'E']

plt.pie(sizes, labels=labels, autopct='%1.1f%%', pctdistance=0.85, labeldistance=1.2)
plt.title('Pie Chart with External Labels - How to Plot a Pie Chart in Python using Matplotlib - how2matplotlib.com')
plt.show()
Output:
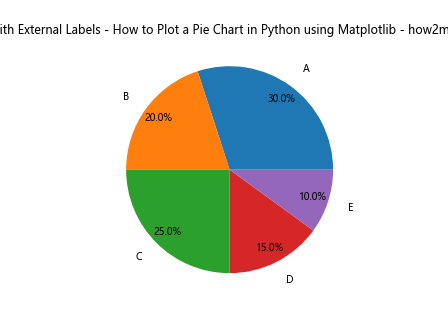
In this example, we’ve used the labeldistance parameter to move the category labels outside the pie chart.
Creating a Nested Pie Chart
A nested pie chart, also known as a multi-level pie chart, can be useful when you want to show hierarchical data. Here’s how to plot a nested pie chart in Python using Matplotlib:
import matplotlib.pyplot as plt

# Data for the outer and inner rings
sizes_outer = [30, 70]
sizes_inner = [15, 15, 20, 50]
labels_outer = ['Category A', 'Category B']
labels_inner = ['A1', 'A2', 'B1', 'B2']

# Create the pie charts
fig, ax = plt.subplots()
ax.pie(sizes_outer, labels=labels_outer, radius=1, wedgeprops=dict(width=0.3, edgecolor='white'))
ax.pie(sizes_inner, labels=labels_inner, radius=0.7, wedgeprops=dict(width=0.3, edgecolor='white'))

plt.title('Nested Pie Chart - How to Plot a Pie Chart in Python using Matplotlib - how2matplotlib.com')
plt.show()
Output:
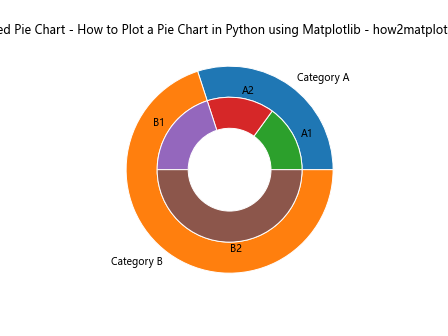
This example creates a nested pie chart with two levels, demonstrating how to visualize hierarchical data.
Customizing Text Properties in Your Pie Chart
When you plot a pie chart in Python using Matplotlib, you can customize various text properties such as font size, color, and style. Here’s an example:
import matplotlib.pyplot as plt

sizes = [30, 20, 25, 15, 10]
labels = ['A', 'B', 'C', 'D', 'E']

plt.pie(sizes, labels=labels, autopct='%1.1f%%',
        textprops={'fontsize': 14, 'color': 'white', 'fontweight': 'bold'})
plt.title('Customized Text - How to Plot a Pie Chart in Python using Matplotlib - how2matplotlib.com',
          fontsize=16, fontweight='bold')
plt.show()
Output:
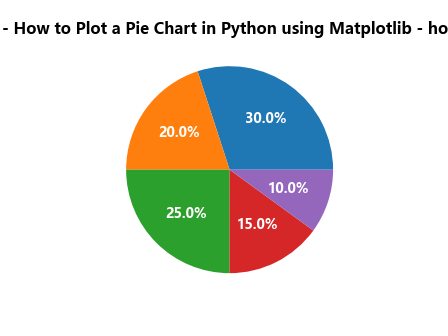
In this example, we’ve customized the font size, color, and weight of the text in the pie chart.
Creating a Pie Chart with Subplots
Sometimes, you might want to create multiple pie charts side by side for comparison. Here’s how to plot multiple pie charts in Python using Matplotlib subplots:
import matplotlib.pyplot as plt

# Data for two pie charts
sizes1 = [30, 20, 25, 15, 10]
sizes2 = [35, 25, 20, 10, 10]
labels = ['A', 'B', 'C', 'D', 'E']

fig, (ax1, ax2) = plt.subplots(1, 2, figsize=(12, 6))

ax1.pie(sizes1, labels=labels, autopct='%1.1f%%')
ax1.set_title('Pie Chart 1')

ax2.pie(sizes2, labels=labels, autopct='%1.1f%%')
ax2.set_title('Pie Chart 2')

plt.suptitle('Multiple Pie Charts - How to Plot a Pie Chart in Python using Matplotlib - how2matplotlib.com')
plt.show()
Output:
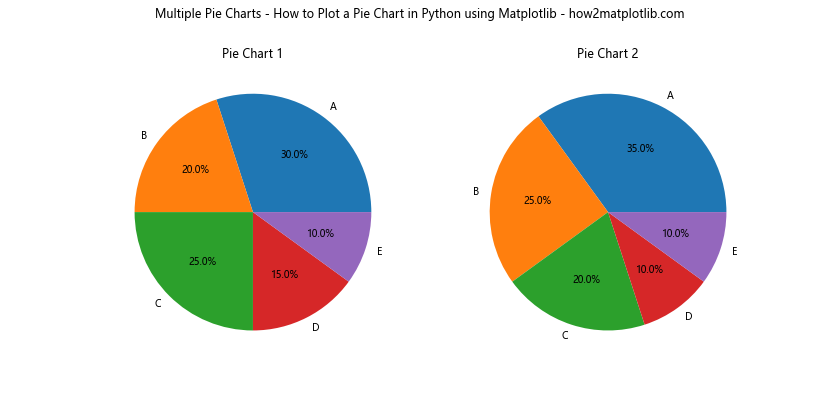
This example creates two pie charts side by side using subplots.
Adding a Shadow Effect to Your Pie Chart
To add depth to your visualization when you plot a pie chart in Python using Matplotlib, you can add a shadow effect. Here’s how:
import matplotlib.pyplot as plt

sizes = [30, 20, 25, 15, 10]
labels = ['A', 'B', 'C', 'D', 'E']

plt.pie(sizes, labels=labels, autopct='%1.1f%%', shadow=True)
plt.title('Pie Chart with Shadow - How to Plot a Pie Chart in Python using Matplotlib - how2matplotlib.com')
plt.show()
Output:
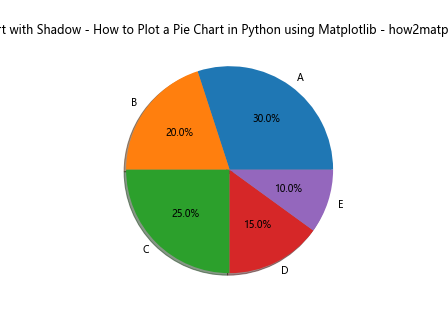
The shadow=True parameter adds a subtle shadow effect to the pie chart.
Creating a Semi-Circle Pie Chart
For a different visual effect, you might want to create a semi-circle pie chart. Here’s how to plot a semi-circle pie chart in Python using Matplotlib:
import matplotlib.pyplot as plt

sizes = [30, 20, 25, 15, 10]
labels = ['A', 'B', 'C', 'D', 'E']

plt.pie(sizes, labels=labels, autopct='%1.1f%%', startangle=90, counterclock=False)
plt.axis('equal')
plt.ylim(0, 1)
plt.title('Semi-Circle Pie Chart - How to Plot a Pie Chart in Python using Matplotlib - how2matplotlib.com')
plt.show()
Output:
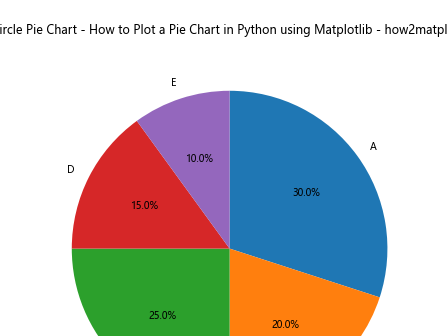
This example creates a semi-circle pie chart by adjusting the start angle and limiting the y-axis.
Saving Your Pie Chart
After you plot a pie chart in Python using Matplotlib, you might want to save it as an image file. Here’s how you can do that:
import matplotlib.pyplot as plt

sizes = [30, 20, 25, 15, 10]
labels = ['A', 'B', 'C', 'D', 'E']

plt.pie(sizes, labels=labels, autopct='%1.1f%%')
plt.title('Saved Pie Chart - How to Plot a Pie Chart in Python using Matplotlib - how2matplotlib.com')
plt.savefig('pie_chart.png', dpi=300, bbox_inches='tight')
plt.show()
Output:
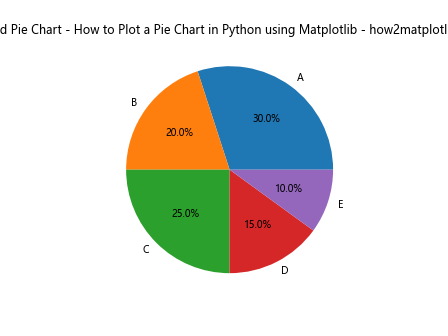
This example saves the pie chart as a PNG file with a resolution of 300 DPI.
Creating an Interactive Pie Chart
While Matplotlib is primarily for static visualizations, you can create interactive pie charts using libraries like Plotly that are based on Matplotlib. Here’s a basic example:
import plotly.graph_objects as go

sizes = [30, 20, 25, 15, 10]
labels = ['A', 'B', 'C', 'D', 'E']

fig = go.Figure(data=[go.Pie(labels=labels, values=sizes)])
fig.update_layout(title='Interactive Pie Chart - How to Plot a Pie Chart in Python using Matplotlib - how2matplotlib.com')
fig.show()
This example creates an interactive pie chart that allows users to hover over slices for more information.
Conclusion: Mastering How to Plot a Pie Chart in Python using Matplotlib
In this comprehensive guide, we’ve explored various aspects of how to plot a pie chart in Python using Matplotlib. From basic pie charts to more advanced techniques like nested pie charts and interactive visualizations, you now have a solid foundation for creating effective and visually appealing pie charts.
Remember, when you plot a pie chart in Python using Matplotlib, you have a wide range of customization options at your disposal. You can adjust colors, explode slices, add legends, customize text properties, and much more. The key is to experiment with different options to find the best way to represent your data.
Pie charts are powerful tools for visualizing proportional data, but it’s important to use them judiciously. They work best when you have a small number of categories (typically no more than 5-7) and when the values add up to a meaningful whole.