How to Plot the Phase Spectrum in Python Using Matplotlib
Plot the phase spectrum in Python using Matplotlib is an essential skill for signal processing and data visualization. This article will provide a detailed exploration of how to plot the phase spectrum using Matplotlib, a powerful plotting library in Python. We’ll cover various aspects of phase spectrum plotting, from basic concepts to advanced techniques, all while using Matplotlib as our primary tool.
Understanding the Phase Spectrum
Before we dive into plotting the phase spectrum in Python using Matplotlib, it’s crucial to understand what a phase spectrum is and why it’s important. The phase spectrum represents the phase angle of each frequency component in a signal. It complements the magnitude spectrum, providing a complete description of the signal in the frequency domain.
When we plot the phase spectrum in Python using Matplotlib, we’re visualizing how the phase of different frequency components varies across the spectrum. This information is particularly useful in signal processing applications, such as filter design, audio analysis, and image processing.
Let’s start with a simple example of how to plot the phase spectrum in Python using Matplotlib:
import numpy as np
import matplotlib.pyplot as plt

# Generate a sample signal
t = np.linspace(0, 1, 1000)
signal = np.sin(2 * np.pi * 10 * t) + 0.5 * np.sin(2 * np.pi * 20 * t)

# Compute the FFT
fft_result = np.fft.fft(signal)

# Compute the phase spectrum
phase_spectrum = np.angle(fft_result)

# Plot the phase spectrum
plt.figure(figsize=(10, 6))
plt.plot(phase_spectrum)
plt.title('Phase Spectrum - how2matplotlib.com')
plt.xlabel('Frequency')
plt.ylabel('Phase (radians)')
plt.grid(True)
plt.show()
Output:
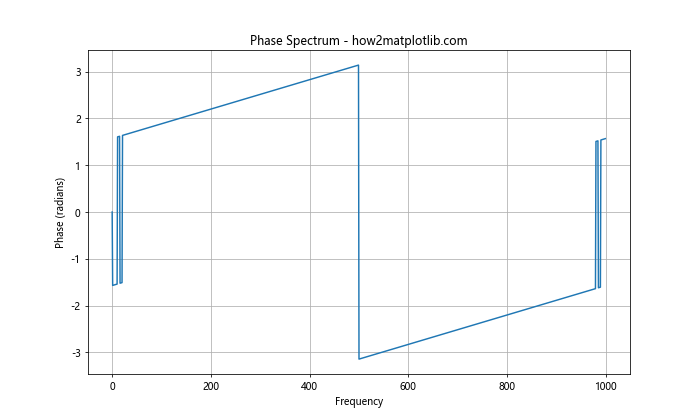
In this example, we generate a simple signal composed of two sine waves, compute its Fast Fourier Transform (FFT), and then extract the phase spectrum using the np.angle() function. Finally, we plot the phase spectrum in Python using Matplotlib.
Basic Phase Spectrum Plotting Techniques
When we plot the phase spectrum in Python using Matplotlib, there are several basic techniques we can employ to enhance our visualizations. Let’s explore some of these techniques:
1. Customizing the x-axis
When we plot the phase spectrum in Python using Matplotlib, it’s often more informative to display the actual frequency values on the x-axis rather than just the array indices. Here’s how we can achieve this:
import numpy as np
import matplotlib.pyplot as plt

# Generate a sample signal
fs = 1000  # Sampling frequency
t = np.linspace(0, 1, fs)
signal = np.sin(2 * np.pi * 10 * t) + 0.5 * np.sin(2 * np.pi * 20 * t)

# Compute the FFT
fft_result = np.fft.fft(signal)

# Compute the phase spectrum
phase_spectrum = np.angle(fft_result)

# Compute frequency values
freqs = np.fft.fftfreq(len(t), 1/fs)

# Plot the phase spectrum
plt.figure(figsize=(10, 6))
plt.plot(freqs[:len(freqs)//2], phase_spectrum[:len(freqs)//2])
plt.title('Phase Spectrum with Frequency Axis - how2matplotlib.com')
plt.xlabel('Frequency (Hz)')
plt.ylabel('Phase (radians)')
plt.grid(True)
plt.show()
Output:
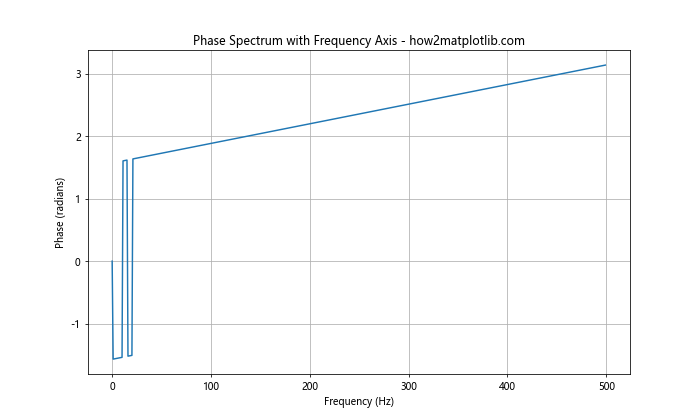
In this example, we use np.fft.fftfreq() to generate the corresponding frequency values for our FFT result. We then plot only the positive frequencies (up to the Nyquist frequency) when we plot the phase spectrum in Python using Matplotlib.
2. Unwrapping the phase
When we plot the phase spectrum in Python using Matplotlib, we might encounter discontinuities due to the phase being wrapped between -π and π. To address this, we can use phase unwrapping:
import numpy as np
import matplotlib.pyplot as plt

# Generate a sample signal
fs = 1000
t = np.linspace(0, 1, fs)
signal = np.sin(2 * np.pi * 10 * t) + 0.5 * np.sin(2 * np.pi * 20 * t)

# Compute the FFT
fft_result = np.fft.fft(signal)

# Compute the phase spectrum
phase_spectrum = np.angle(fft_result)

# Unwrap the phase
unwrapped_phase = np.unwrap(phase_spectrum)

# Compute frequency values
freqs = np.fft.fftfreq(len(t), 1/fs)

# Plot the unwrapped phase spectrum
plt.figure(figsize=(10, 6))
plt.plot(freqs[:len(freqs)//2], unwrapped_phase[:len(freqs)//2])
plt.title('Unwrapped Phase Spectrum - how2matplotlib.com')
plt.xlabel('Frequency (Hz)')
plt.ylabel('Unwrapped Phase (radians)')
plt.grid(True)
plt.show()
Output:
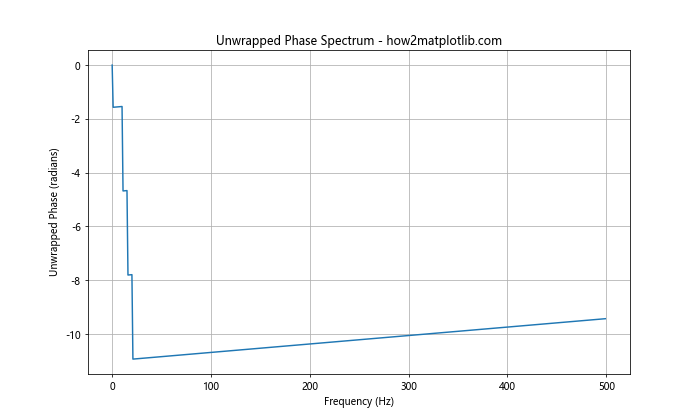
In this example, we use np.unwrap() to remove the discontinuities in the phase spectrum before we plot the phase spectrum in Python using Matplotlib. This can often provide a clearer view of the underlying phase behavior.
Advanced Phase Spectrum Plotting Techniques
As we delve deeper into how to plot the phase spectrum in Python using Matplotlib, we can explore more advanced techniques to enhance our visualizations and extract more meaningful information from our data.
1. Plotting Phase and Magnitude Spectra Together
Often, it’s useful to plot both the phase spectrum and the magnitude spectrum together when we plot the phase spectrum in Python using Matplotlib. This gives a more complete picture of the signal’s frequency content:
import numpy as np
import matplotlib.pyplot as plt

# Generate a sample signal
fs = 1000
t = np.linspace(0, 1, fs)
signal = np.sin(2 * np.pi * 10 * t) + 0.5 * np.sin(2 * np.pi * 20 * t)

# Compute the FFT
fft_result = np.fft.fft(signal)

# Compute the phase spectrum
phase_spectrum = np.angle(fft_result)

# Compute the magnitude spectrum
magnitude_spectrum = np.abs(fft_result)

# Compute frequency values
freqs = np.fft.fftfreq(len(t), 1/fs)

# Plot the phase and magnitude spectra
fig, (ax1, ax2) = plt.subplots(2, 1, figsize=(10, 10))

ax1.plot(freqs[:len(freqs)//2], magnitude_spectrum[:len(freqs)//2])
ax1.set_title('Magnitude Spectrum - how2matplotlib.com')
ax1.set_xlabel('Frequency (Hz)')
ax1.set_ylabel('Magnitude')
ax1.grid(True)

ax2.plot(freqs[:len(freqs)//2], phase_spectrum[:len(freqs)//2])
ax2.set_title('Phase Spectrum - how2matplotlib.com')
ax2.set_xlabel('Frequency (Hz)')
ax2.set_ylabel('Phase (radians)')
ax2.grid(True)

plt.tight_layout()
plt.show()
Output:
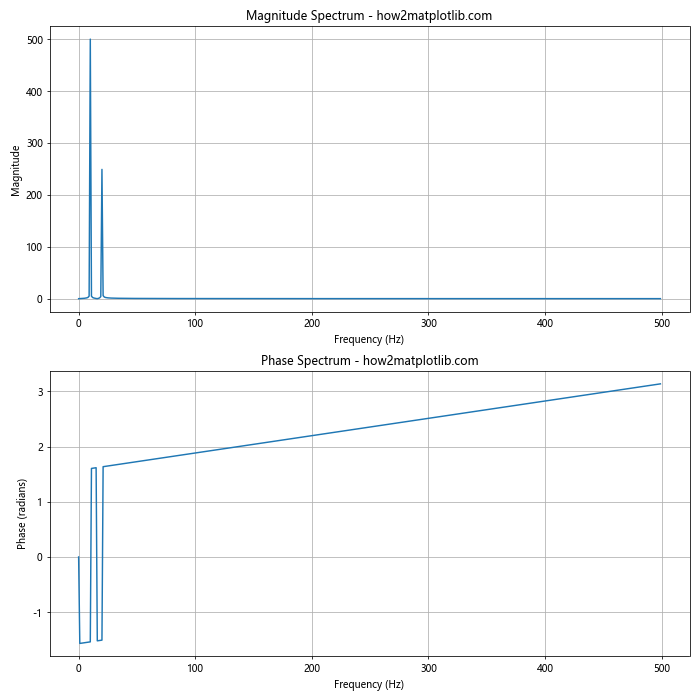
In this example, we create a figure with two subplots: one for the magnitude spectrum and one for the phase spectrum. This allows us to easily compare the two when we plot the phase spectrum in Python using Matplotlib.
2. Using a Polar Plot for Phase Spectrum
Another interesting way to visualize the phase spectrum is by using a polar plot. This can be particularly useful for identifying periodic patterns in the phase:
import numpy as np
import matplotlib.pyplot as plt

# Generate a sample signal
fs = 1000
t = np.linspace(0, 1, fs)
signal = np.sin(2 * np.pi * 10 * t) + 0.5 * np.sin(2 * np.pi * 20 * t)

# Compute the FFT
fft_result = np.fft.fft(signal)

# Compute the phase spectrum
phase_spectrum = np.angle(fft_result)

# Compute frequency values
freqs = np.fft.fftfreq(len(t), 1/fs)

# Create a polar plot
fig, ax = plt.subplots(subplot_kw={'projection': 'polar'})
ax.plot(phase_spectrum[:len(freqs)//2], freqs[:len(freqs)//2])
ax.set_title('Polar Phase Spectrum - how2matplotlib.com')
ax.set_rmax(fs/2)
ax.set_rticks([100, 200, 300, 400])
ax.set_rlabel_position(-22.5)
ax.grid(True)

plt.show()
Output:
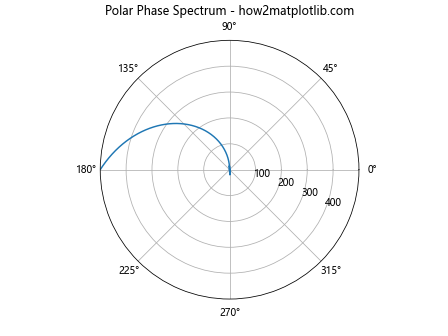
In this example, we use a polar plot to visualize the phase spectrum. The angle represents the phase, while the radius represents the frequency. This can provide an interesting perspective when we plot the phase spectrum in Python using Matplotlib.
Handling Real-World Signals
When we plot the phase spectrum in Python using Matplotlib for real-world signals, we often need to deal with noise and other complexities. Let’s explore some techniques for handling these situations.
1. Applying Windowing
Windowing is a technique used to reduce spectral leakage when computing the FFT. Here’s how we can apply a Hann window before we plot the phase spectrum in Python using Matplotlib:
import numpy as np
import matplotlib.pyplot as plt

# Generate a sample signal with noise
fs = 1000
t = np.linspace(0, 1, fs)
signal = np.sin(2 * np.pi * 10 * t) + 0.5 * np.sin(2 * np.pi * 20 * t) + 0.1 * np.random.randn(len(t))

# Apply Hann window
window = np.hanning(len(signal))
windowed_signal = signal * window

# Compute the FFT
fft_result = np.fft.fft(windowed_signal)

# Compute the phase spectrum
phase_spectrum = np.angle(fft_result)

# Compute frequency values
freqs = np.fft.fftfreq(len(t), 1/fs)

# Plot the phase spectrum
plt.figure(figsize=(10, 6))
plt.plot(freqs[:len(freqs)//2], phase_spectrum[:len(freqs)//2])
plt.title('Phase Spectrum with Windowing - how2matplotlib.com')
plt.xlabel('Frequency (Hz)')
plt.ylabel('Phase (radians)')
plt.grid(True)
plt.show()
Output:
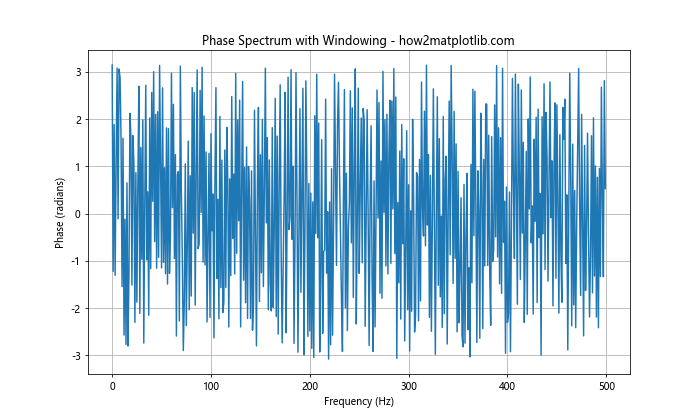
In this example, we apply a Hann window to the signal before computing the FFT. This can help reduce spectral leakage and provide a cleaner phase spectrum when we plot the phase spectrum in Python using Matplotlib.
2. Dealing with Noisy Signals
When dealing with noisy signals, it can be helpful to apply some smoothing to the phase spectrum. Here’s an example using a moving average filter:
import numpy as np
import matplotlib.pyplot as plt

# Generate a noisy signal
fs = 1000
t = np.linspace(0, 1, fs)
signal = np.sin(2 * np.pi * 10 * t) + 0.5 * np.sin(2 * np.pi * 20 * t) + 0.5 * np.random.randn(len(t))

# Compute the FFT
fft_result = np.fft.fft(signal)

# Compute the phase spectrum
phase_spectrum = np.angle(fft_result)

# Apply moving average smoothing
def moving_average(x, w):
    return np.convolve(x, np.ones(w), 'valid') / w

smoothed_phase = moving_average(phase_spectrum, 5)

# Compute frequency values
freqs = np.fft.fftfreq(len(t), 1/fs)

# Plot the original and smoothed phase spectra
plt.figure(figsize=(10, 6))
plt.plot(freqs[:len(freqs)//2], phase_spectrum[:len(freqs)//2], label='Original')
plt.plot(freqs[:len(smoothed_phase)//2], smoothed_phase[:len(smoothed_phase)//2], label='Smoothed')
plt.title('Original vs Smoothed Phase Spectrum - how2matplotlib.com')
plt.xlabel('Frequency (Hz)')
plt.ylabel('Phase (radians)')
plt.legend()
plt.grid(True)
plt.show()
Output:
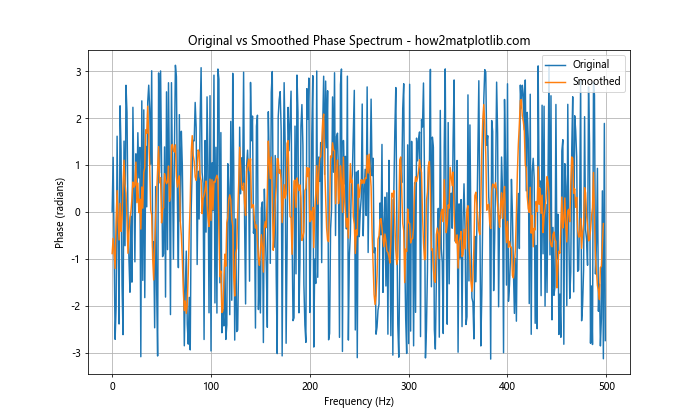
In this example, we apply a simple moving average filter to smooth the phase spectrum. This can help reduce noise and make trends more apparent when we plot the phase spectrum in Python using Matplotlib.
Advanced Visualization Techniques
As we continue to explore how to plot the phase spectrum in Python using Matplotlib, let’s look at some advanced visualization techniques that can provide even more insights into our data.
1. 3D Phase Spectrum Plot
For signals that change over time, we can create a 3D plot of the phase spectrum to visualize how the phase changes across both frequency and time:
import numpy as np
import matplotlib.pyplot as plt
from mpl_toolkits.mplot3d import Axes3D

# Generate a time-varying signal
fs = 1000
t = np.linspace(0, 1, fs)
f1, f2 = 10, 20
signal = np.sin(2 * np.pi * f1 * t) + 0.5 * np.sin(2 * np.pi * f2 * t)
signal *= np.exp(-t)  # Add time-varying amplitude

# Compute STFT
def stft(x, fs, framesz, hop):
    framesamp = int(framesz*fs)
    hopsamp = int(hop*fs)
    w = np.hanning(framesamp)
    X = np.array([np.fft.fft(w*x[i:i+framesamp])
                  for i in range(0, len(x)-framesamp, hopsamp)])
    return X

X = stft(signal, fs, 0.05, 0.01)

# Compute phase spectrum
phase_spectrum = np.angle(X)

# Create 3D plot
fig = plt.figure(figsize=(12, 8))
ax = fig.add_subplot(111, projection='3d')

freq = np.fft.fftfreq(X.shape[1], 1/fs)
time = np.arange(X.shape[0]) * 0.01

freq_mesh, time_mesh = np.meshgrid(freq[:X.shape[1]//2], time)

surf = ax.plot_surface(freq_mesh, time_mesh, phase_spectrum[:, :X.shape[1]//2], cmap='viridis')

ax.set_xlabel('Frequency (Hz)')
ax.set_ylabel('Time (s)')
ax.set_zlabel('Phase (radians)')
ax.set_title('3D Phase Spectrum - how2matplotlib.com')

plt.colorbar(surf)
plt.show()
Output:
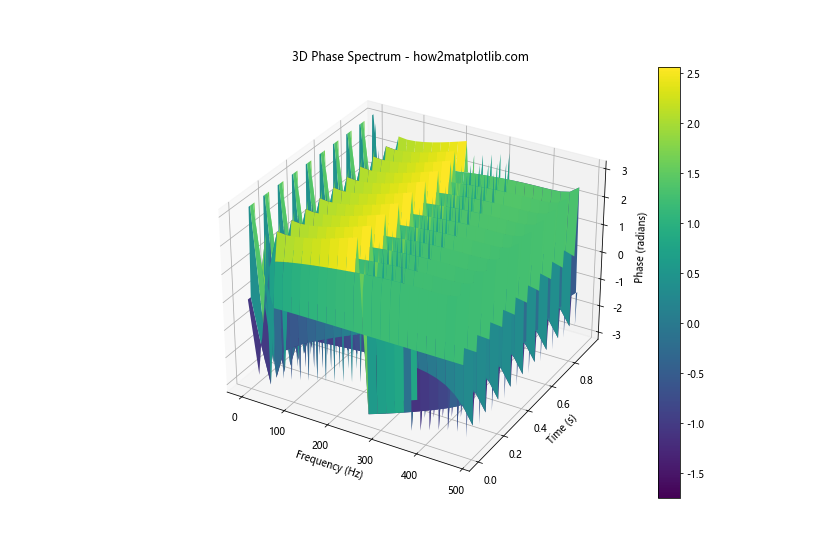
In this example, we use the Short-Time Fourier Transform (STFT) to compute the phase spectrum over time, and then create a 3D surface plot to visualize how the phase spectrum evolves. This advanced technique allows us to see temporal changes in the phase spectrum when we plot the phase spectrum in Python using Matplotlib.
2. Phase Spectrum Heatmap
Another way to visualize the time-varying phase spectrum is through a heatmap:
import numpy as np
import matplotlib.pyplot as plt

# Generate a time-varying signal
fs = 1000
t = np.linspace(0, 1, fs)
f1, f2 = 10, 20
signal = np.sin(2 * np.pi * f1 * t) + 0.5 * np.sin(2 * np.pi * f2 * t)
signal *= np.exp(-t)  # Add time-varying amplitude

# Compute STFT
def stft(x, fs, framesz, hop):
    framesamp = int(framesz*fs)
    hopsamp = int(hop*fs)
    w = np.hanning(framesamp)
    X = np.array([np.fft.fft(w*x[i:i+framesamp])
                  for i in range(0, len(x)-framesamp, hopsamp)])
    return X

X = stft(signal, fs, 0.05, 0.01)

# Compute phase spectrum
phase_spectrum = np.angle(X)

# Create heatmap
plt.figure(figsize=(12, 8))
plt.imshow(phase_spectrum[:, :X.shape[1]//2].T, aspect='auto', origin='lower',
           extent=[0, 1, 0, fs/2], cmap='hsv')
plt.colorbar(label='Phase (radians)')
plt.title('Phase Spectrum Heatmap - how2matplotlib.com')
plt.xlabel('Time (s)')
plt.ylabel('Frequency (Hz)')
plt.show()
Output:
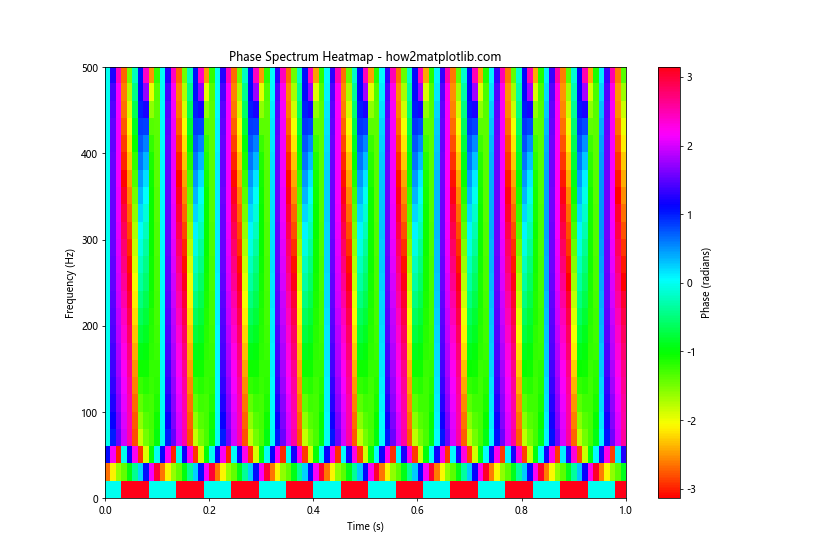
This heatmap visualization provides a compact way to represent the time-varying phase spectrum, with color indicating the phase value. It’s particularly useful for identifying patterns or changes in the phase spectrum over time when we plot the phase spectrum in Python using Matplotlib.
Interpreting Phase Spectrum Plots
When we plot the phase spectrum in Python using Matplotlib, it’s crucial to understand how to interpret the results. Let’s explore some key aspects of phase spectrum interpretation:
1. Linear Phase
A linear phase response indicates that all frequency components of the signal are delayed by the same amount of time. When we plot the phase spectrum in Python using Matplotlib, a linear phase appears as a straight line:
import numpy as np
import matplotlib.pyplot as plt

# Generate a signal with linear phase
fs = 1000
t = np.linspace(0, 1, fs)
f = 10
signal = np.sin(2 * np.pi * f * (t - 0.1))  # 0.1 second delay

# Compute the FFT
fft_result = np.fft.fft(signal)

# Compute the phase spectrum
phase_spectrum = np.angle(fft_result)

# Unwrap the phase
unwrapped_phase = np.unwrap(phase_spectrum)

# Compute frequency values
freqs = np.fft.fftfreq(len(t), 1/fs)

# Plot the unwrapped phase spectrum
plt.figure(figsize=(10, 6))
plt.plot(freqs[:len(freqs)//2], unwrapped_phase[:len(freqs)//2])
plt.title('Linear Phase Spectrum - how2matplotlib.com')
plt.xlabel('Frequency (Hz)')
plt.ylabel('Unwrapped Phase (radians)')
plt.grid(True)
plt.show()
Output:
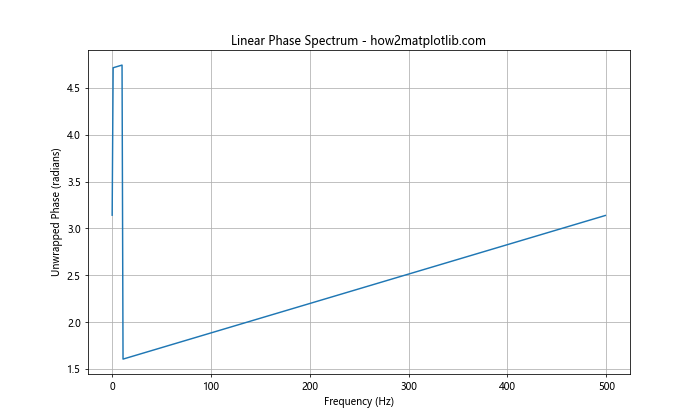
In this example, we create a signal with a constant time delay, resulting in a linear phase response. When we plot the phase spectrum in Python using Matplotlib, we can observe the linear relationship between phase and frequency.
2. Non-Linear Phase
Non-linear phase responses occur when different frequency components experience different delays. This can lead to distortion in the signal. Here’s an example of how to plot a non-linear phase spectrum in Python using Matplotlib:
import numpy as np
import matplotlib.pyplot as plt

# Generate a signal with non-linear phase
fs = 1000
t = np.linspace(0, 1, fs)
f = 10
signal = np.sin(2 * np.pi * f * t + 0.5 * t**2)  # Quadratic phase term

# Compute the FFT
fft_result = np.fft.fft(signal)

# Compute the phase spectrum
phase_spectrum = np.angle(fft_result)

# Unwrap the phase
unwrapped_phase = np.unwrap(phase_spectrum)

# Compute frequency values
freqs = np.fft.fftfreq(len(t), 1/fs)

# Plot the unwrapped phase spectrum
plt.figure(figsize=(10, 6))
plt.plot(freqs[:len(freqs)//2], unwrapped_phase[:len(freqs)//2])
plt.title('Non-Linear Phase Spectrum - how2matplotlib.com')
plt.xlabel('Frequency (Hz)')
plt.ylabel('Unwrapped Phase (radians)')
plt.grid(True)
plt.show()
Output:
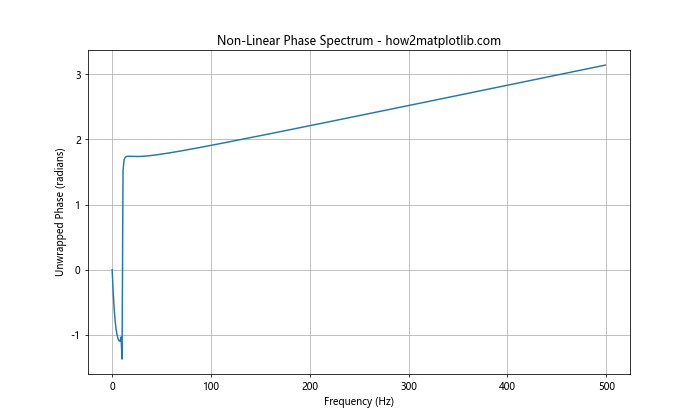
In this example, we introduce a quadratic phase term, resulting in a non-linear phase response. When we plot the phase spectrum in Python using Matplotlib, we can observe the curvature in the phase spectrum, indicating the non-linear relationship between phase and frequency.
Advanced Topics in Phase Spectrum Analysis
As we delve deeper into how to plot the phase spectrum in Python using Matplotlib, let’s explore some advanced topics that can provide even more insights into our signals.
1. Group Delay
The group delay is the negative derivative of the phase spectrum with respect to frequency. It represents the delay experienced by different frequency components of a signal. Here’s how we can compute and plot the group delay:
import numpy as np
import matplotlib.pyplot as plt
from scipy import signal

# Generate a sample signal
fs = 1000
t = np.linspace(0, 1, fs)
f1, f2 = 10, 20
x = np.sin(2 * np.pi * f1 * t) + 0.5 * np.sin(2 * np.pi * f2 * t)

# Compute the FFT
fft_result = np.fft.fft(x)

# Compute the unwrapped phase spectrum
unwrapped_phase = np.unwrap(np.angle(fft_result))

# Compute the group delay
group_delay = -np.diff(unwrapped_phase) / (2 * np.pi * (fs / len(t)))

# Compute frequency values
freqs = np.fft.fftfreq(len(t), 1/fs)

# Plot the group delay
plt.figure(figsize=(10, 6))
plt.plot(freqs[1:len(freqs)//2], group_delay[:len(freqs)//2-1])
plt.title('Group Delay - how2matplotlib.com')
plt.xlabel('Frequency (Hz)')
plt.ylabel('Group Delay (seconds)')
plt.grid(True)
plt.show()
Output:
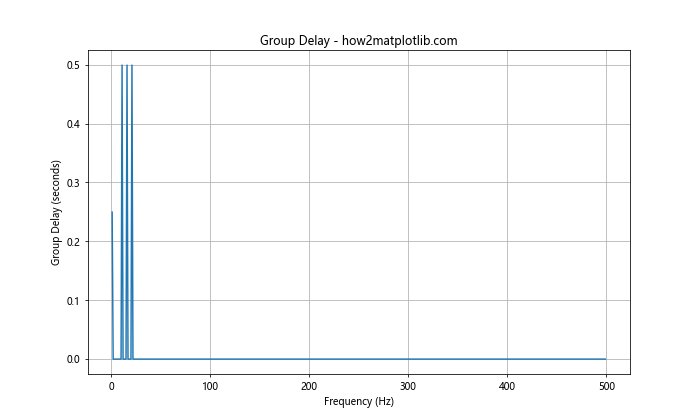
In this example, we compute the group delay by taking the derivative of the unwrapped phase spectrum. The resulting plot shows how different frequency components are delayed when we plot the phase spectrum in Python using Matplotlib.
2. Phase Coherence
Phase coherence is a measure of the consistency of phase relationships between different frequency components across multiple observations. It’s particularly useful in analyzing repetitive signals or comparing multiple signals. Here’s an example of how to compute and plot phase coherence:
import numpy as np
import matplotlib.pyplot as plt

def phase_coherence(signals):
    ffts = np.fft.fft(signals, axis=1)
    phases = np.angle(ffts)
    return np.abs(np.mean(np.exp(1j * phases), axis=0))

# Generate multiple observations of a noisy signal
fs = 1000
t = np.linspace(0, 1, fs)
f1, f2 = 10, 20
n_observations = 100

signals = np.array([np.sin(2 * np.pi * f1 * t) + 0.5 * np.sin(2 * np.pi * f2 * t) + 0.1 * np.random.randn(len(t))
                    for _ in range(n_observations)])

# Compute phase coherence
coherence = phase_coherence(signals)

# Compute frequency values
freqs = np.fft.fftfreq(len(t), 1/fs)

# Plot the phase coherence
plt.figure(figsize=(10, 6))
plt.plot(freqs[:len(freqs)//2], coherence[:len(freqs)//2])
plt.title('Phase Coherence - how2matplotlib.com')
plt.xlabel('Frequency (Hz)')
plt.ylabel('Coherence')
plt.ylim(0, 1)
plt.grid(True)
plt.show()
Output:
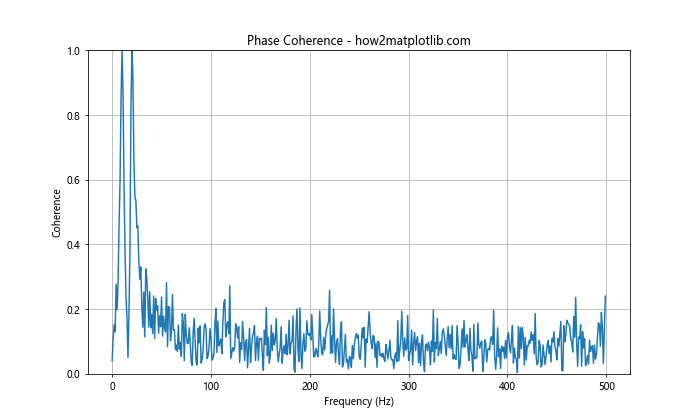
In this example, we generate multiple observations of a noisy signal and compute the phase coherence across these observations. The resulting plot shows which frequency components have consistent phase relationships across the observations when we plot the phase spectrum in Python using Matplotlib.
Best Practices for Phase Spectrum Plotting
When we plot the phase spectrum in Python using Matplotlib, there are several best practices to keep in mind to ensure clear and informative visualizations:
- Always include proper labels and titles in your plots.
- Use appropriate scaling for your axes, especially when dealing with different frequency ranges.
- Consider using unwrapped phase for clearer visualization of phase trends.
- When dealing with noisy signals, apply appropriate windowing or smoothing techniques.
- Use color maps effectively in 2D or 3D phase spectrum plots.
- Include a colorbar when using color to represent phase values.
- Consider plotting both magnitude and phase spectra for a complete representation of the signal.
Here’s an example that incorporates some of these best practices:
import numpy as np
import matplotlib.pyplot as plt

# Generate a sample signal
fs = 1000
t = np.linspace(0, 1, fs)
f1, f2 = 10, 20
signal = np.sin(2 * np.pi * f1 * t) + 0.5 * np.sin(2 * np.pi * f2 * t) + 0.1 * np.random.randn(len(t))

# Apply Hann window
window = np.hanning(len(signal))
windowed_signal = signal * window

# Compute the FFT
fft_result = np.fft.fft(windowed_signal)

# Compute the phase spectrum
phase_spectrum = np.angle(fft_result)

# Unwrap the phase
unwrapped_phase = np.unwrap(phase_spectrum)

# Compute frequency values
freqs = np.fft.fftfreq(len(t), 1/fs)

# Plot the phase spectrum
plt.figure(figsize=(12, 8))
plt.subplot(211)
plt.plot(freqs[:len(freqs)//2], phase_spectrum[:len(freqs)//2])
plt.title('Wrapped Phase Spectrum - how2matplotlib.com')
plt.xlabel('Frequency (Hz)')
plt.ylabel('Phase (radians)')
plt.grid(True)

plt.subplot(212)
plt.plot(freqs[:len(freqs)//2], unwrapped_phase[:len(freqs)//2])
plt.title('Unwrapped Phase Spectrum - how2matplotlib.com')
plt.xlabel('Frequency (Hz)')
plt.ylabel('Unwrapped Phase (radians)')
plt.grid(True)

plt.tight_layout()
plt.show()
Output:
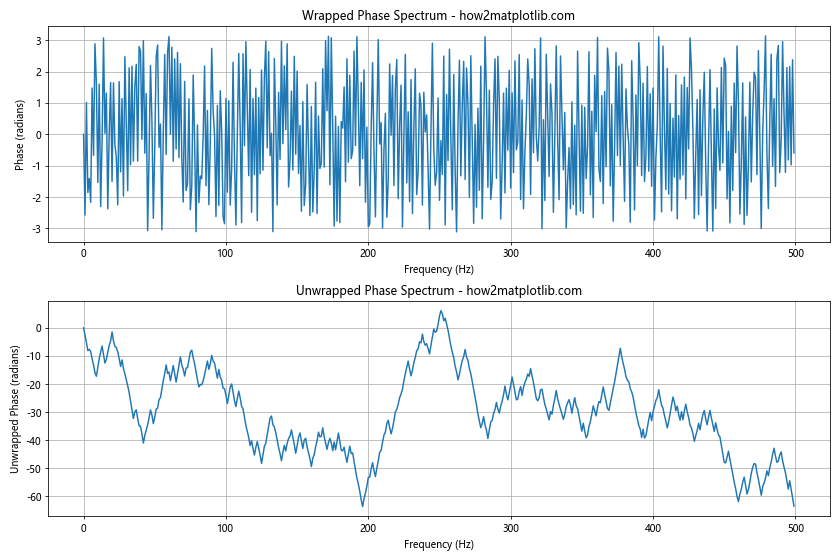
In this example, we plot both the wrapped and unwrapped phase spectra, use appropriate labels and titles, and apply gridlines for better readability when we plot the phase spectrum in Python using Matplotlib.
Conclusion
Learning how to plot the phase spectrum in Python using Matplotlib is an essential skill for anyone working with signal processing or data analysis. Throughout this article, we’ve explored various techniques and considerations for creating effective phase spectrum visualizations.
We’ve covered basic concepts like computing and plotting the phase spectrum, as well as more advanced topics like group delay and phase coherence. We’ve also discussed best practices for creating clear and informative plots.
Remember that when you plot the phase spectrum in Python using Matplotlib, you’re not just creating a graph – you’re providing a window into the fundamental properties of your signal. By mastering these techniques, you’ll be better equipped to analyze and interpret complex signals in a wide range of applications.
Whether you’re working with audio signals, image processing, or any other field that involves frequency-domain analysis, the ability to effectively plot and interpret phase spectra will be an invaluable tool in your data analysis toolkit.