Pip Install Matplotlib
Matplotlib is a powerful data visualization library in Python that allows users to create interactive and static plots, charts, and graphs. It is widely used for data analysis and data visualization tasks in various fields such as scientific research, finance, and machine learning.
Installing Matplotlib is a straightforward process with the help of pip, the package installer for Python. This article will guide you through the steps to install Matplotlib using pip and provide code examples along the way.
Pip Install Matplotlib Steps
Before we begin, make sure you have Python installed on your system. You can check if Python is installed by opening a terminal or command prompt and entering the following command:
python --version
If Python is not installed, head over to the official Python website (https://www.python.org) and download the latest version for your operating system.
Once you have Python installed, follow the steps below to install Matplotlib using pip:
Step 1: Open a terminal or command prompt.
Step 2: Enter the following command to install Matplotlib:
pip install matplotlib
Step 3: Wait for the installation process to complete.
That’s it! Matplotlib should now be installed on your system. Let’s move on to some code examples to explore the capabilities of Matplotlib.
Code Examples
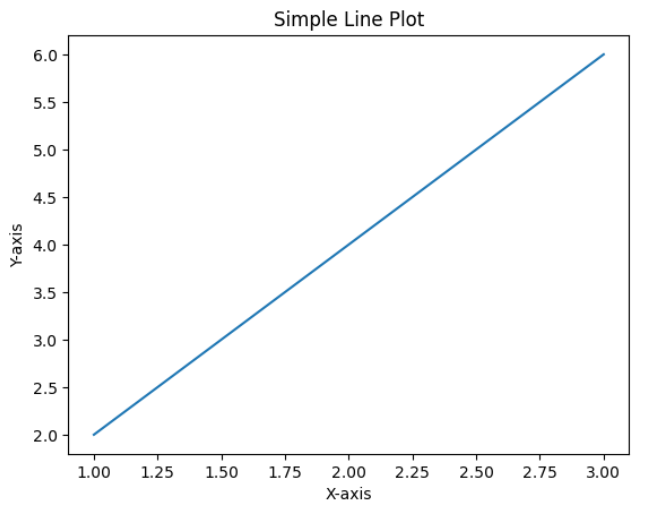
Example 1: Simple Line Plot
Let’s start with a simple line plot using Matplotlib. The following code will plot a line connecting three points (1, 2), (2, 4), and (3, 6).
import matplotlib.pyplot as plt

x = [1, 2, 3]
y = [2, 4, 6]

plt.plot(x, y)

plt.xlabel('X-axis')
plt.ylabel('Y-axis')
plt.title('Simple Line Plot')

plt.show()
Output:
Example 2: Bar Chart
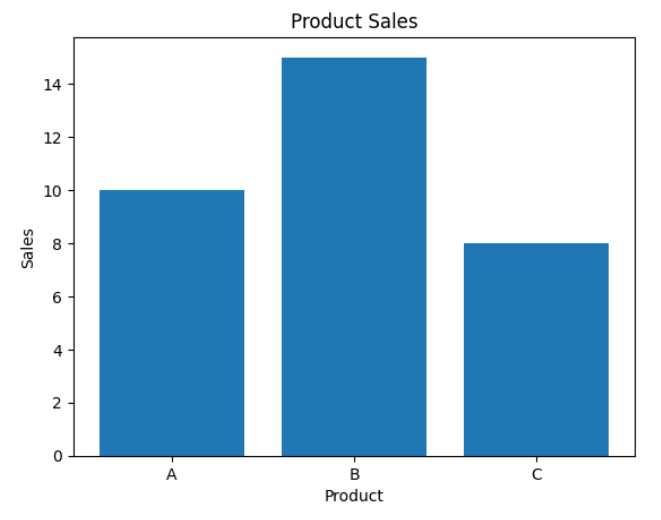
Here’s an example of a bar chart using Matplotlib. The code below will create a bar chart comparing the sales of three products: A, B, and C.
import matplotlib.pyplot as plt

products = ['A', 'B', 'C']
sales = [10, 15, 8]

plt.bar(products, sales)

plt.xlabel('Product')
plt.ylabel('Sales')
plt.title('Product Sales')

plt.show()
Output:
Example 3: Scatter Plot
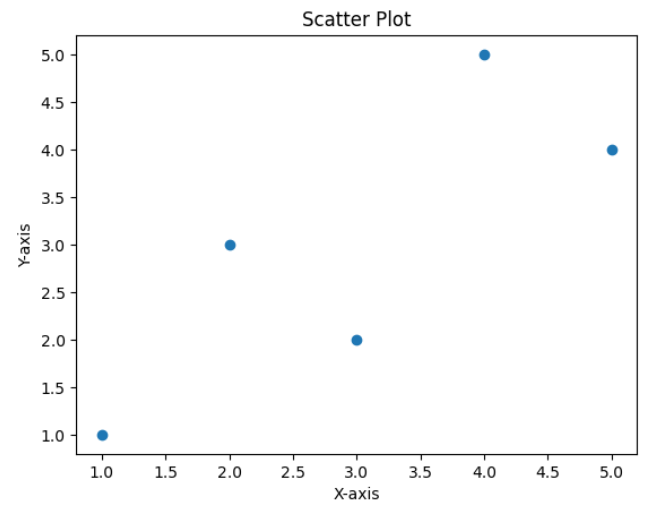
Let’s create a scatter plot using Matplotlib. In the code below, we’ll plot five points (1, 1), (2, 3), (3, 2), (4, 5), and (5, 4).
import matplotlib.pyplot as plt

x = [1, 2, 3, 4, 5]
y = [1, 3, 2, 5, 4]

plt.scatter(x, y)

plt.xlabel('X-axis')
plt.ylabel('Y-axis')
plt.title('Scatter Plot')

plt.show()
Output:
Example 4: Subplots
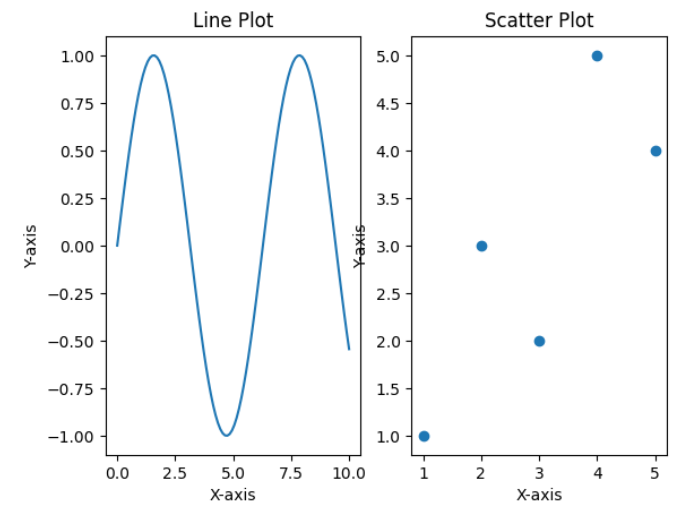
Matplotlib allows you to create multiple plots within a single figure by using subplots. The code below demonstrates how to create a figure with two subplots: one for a line plot and one for a scatter plot.
import matplotlib.pyplot as plt
import numpy as np

# Data for line plot
x = np.linspace(0, 10, 100)
y = np.sin(x)

# Data for scatter plot
x_scatter = [1, 2, 3, 4, 5]
y_scatter = [1, 3, 2, 5, 4]

# Create a figure with two subplots
fig, (ax1, ax2) = plt.subplots(1, 2)

# Plot line on the first subplot
ax1.plot(x, y)
ax1.set_xlabel('X-axis')
ax1.set_ylabel('Y-axis')
ax1.set_title('Line Plot')

# Plot scatter on the second subplot
ax2.scatter(x_scatter, y_scatter)
ax2.set_xlabel('X-axis')
ax2.set_ylabel('Y-axis')
ax2.set_title('Scatter Plot')

plt.show()
Output:
Example 5: Pie Chart
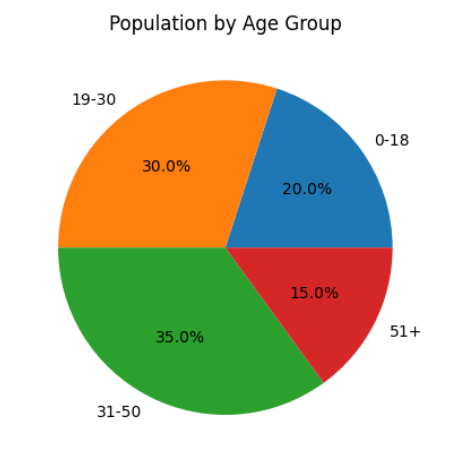
You can create a pie chart in Matplotlib to represent categorical data. The following code will create a pie chart showing the distribution of population by age group.
import matplotlib.pyplot as plt

age_groups = ['0-18', '19-30', '31-50', '51+']
population = [20, 30, 35, 15]

plt.pie(population, labels=age_groups, autopct='%1.1f%%')

plt.title('Population by Age Group')

plt.show()
Output:
Example 6: Histogram
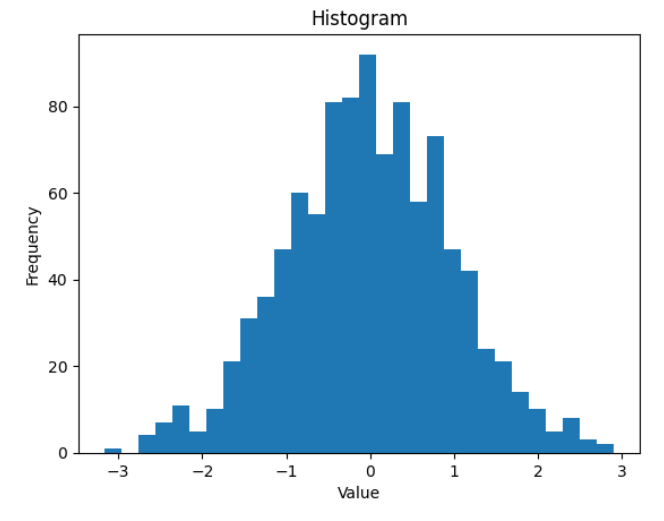
A histogram is a graphical representation of the distribution of a dataset. The code below demonstrates how to create a histogram using Matplotlib.
import matplotlib.pyplot as plt
import numpy as np

# Generate random data
data = np.random.normal(0, 1, 1000)

plt.hist(data, bins=30)

plt.xlabel('Value')
plt.ylabel('Frequency')
plt.title('Histogram')

plt.show()
Output:
Example 7: Box Plot
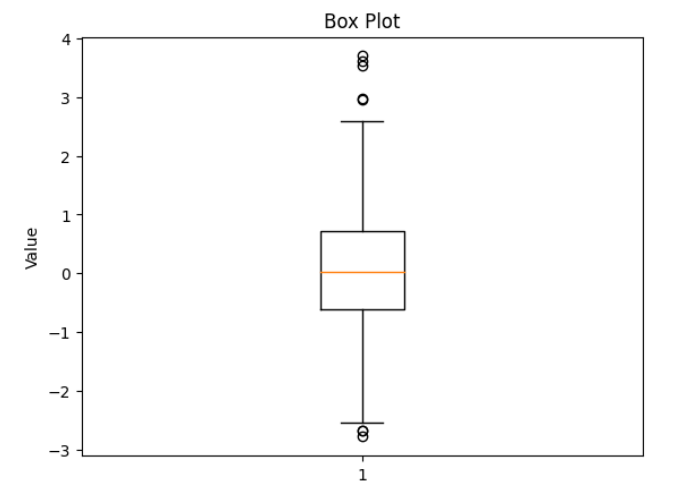
A box plot (also known as a whisker plot) is a graphical representation of the distribution of a dataset. The code below will create a box plot using Matplotlib.
import matplotlib.pyplot as plt
import numpy as np

# Generate random data
data = np.random.normal(0, 1, 1000)

plt.boxplot(data)

plt.ylabel('Value')
plt.title('Box Plot')

plt.show()
Output:
Example 8: Heatmap
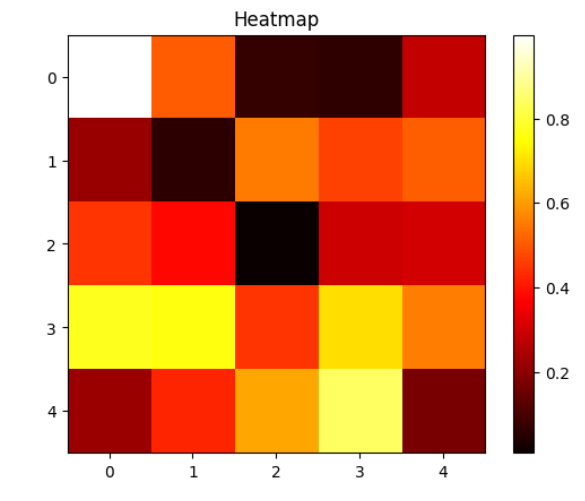
A heatmap is a graphical representation of data where the individual values contained in a matrix are represented as colors. The code below will create a heatmap using Matplotlib.
import matplotlib.pyplot as plt
import numpy as np

# Create a random matrix
data = np.random.rand(5, 5)

plt.imshow(data, cmap='hot')

plt.colorbar()

plt.title('Heatmap')

plt.show()
Output:
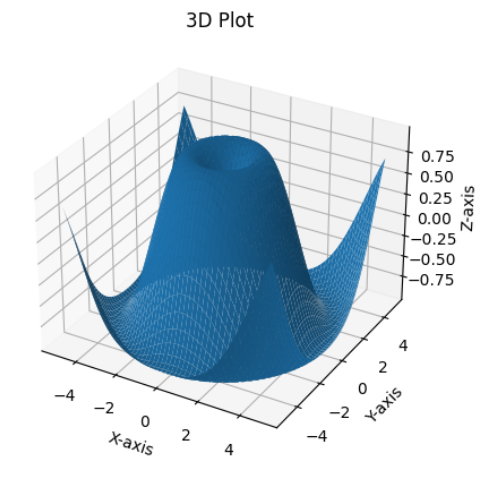
Example 9: 3D Plot
Matplotlib also provides support for creating 3D plots. The code below demonstrates how to create a 3D plot using Matplotlib.
import matplotlib.pyplot as plt
import numpy as np

# Create data points
x = np.linspace(-5, 5, 100)
y = np.linspace(-5, 5, 100)
X, Y = np.meshgrid(x, y)
Z = np.sin(np.sqrt(X**2 + Y**2))

# Create a 3D plot
fig = plt.figure()
ax = fig.add_subplot(111, projection='3d')
ax.plot_surface(X, Y, Z)

ax.set_xlabel('X-axis')
ax.set_ylabel('Y-axis')
ax.set_zlabel('Z-axis')
ax.set_title('3D Plot')

plt.show()
Output:
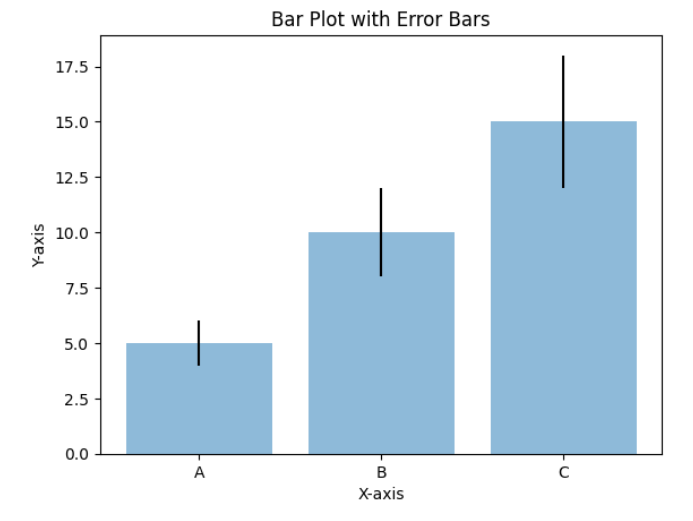
Example 10: Bar Plot with Error Bars
You can add error bars to a bar plot in Matplotlib to visually represent the variability of data. The code below will create a bar plot with error bars.
import matplotlib.pyplot as plt
import numpy as np

# Data for bar plot
x = np.arange(3)
y = [5, 10, 15]
error = [1, 2, 3]

plt.bar(x, y, yerr=error, alpha=0.5)

plt.xlabel('X-axis')
plt.ylabel('Y-axis')
plt.title('Bar Plot with Error Bars')

plt.xticks(x, ['A', 'B', 'C'])

plt.show()
Output:
These are just a few examples of what you can achieve with Matplotlib. It provides a wide range of plots and customization options to cater to various visualization needs.
Pip Install Matplotlib Conclusion
In this article, we discussed how to install Matplotlib using pip and explored several code examples to demonstrate its capabilities. Matplotlib is a powerful data visualization library that enables you to create interactive and static plots, charts, and graphs with ease. With its extensive documentation and community support, you can easily dive into the world of data visualization and create stunning visual representations of your data. So go ahead, install Matplotlib, and start exploring the vast possibilities it offers.