Matplotlib Subplot
In data visualization, subplots are used to divide a single plot into multiple smaller plots. It allows you to display different sets of data or different aspects of the same data in a single figure. Matplotlib provides a versatile and easy-to-use interface for creating subplots.
Creating Subplots in Matplotlib
In Matplotlib, subplots can be created using the subplot function. This function takes three integers as arguments: nrows, ncols, and index. The nrows and ncols specify the number of rows and columns in the subplot grid, while the index specifies the current plot’s position in the grid.
Here is the general syntax to create a subplot using Matplotlib:
import matplotlib.pyplot as plt

plt.subplot(nrows, ncols, index)
Let’s dive into some examples to understand how subplots work in Matplotlib.
Example 1: Simple Subplot
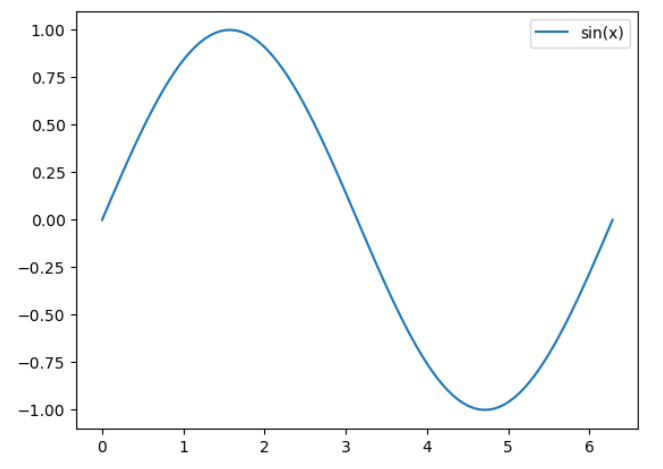
In this example, we will create a figure with a single subplot.
import matplotlib.pyplot as plt
import numpy as np

# Create some data
x = np.linspace(0, 2 * np.pi, 100)
y = np.sin(x)

# Create a figure with a subplot
plt.subplot(1, 1, 1)

# Plot the data
plt.plot(x, y, label='sin(x)')

# Add a legend
plt.legend()

# Show the plot
plt.show()
Output:
Example 2: Multiple Subplots
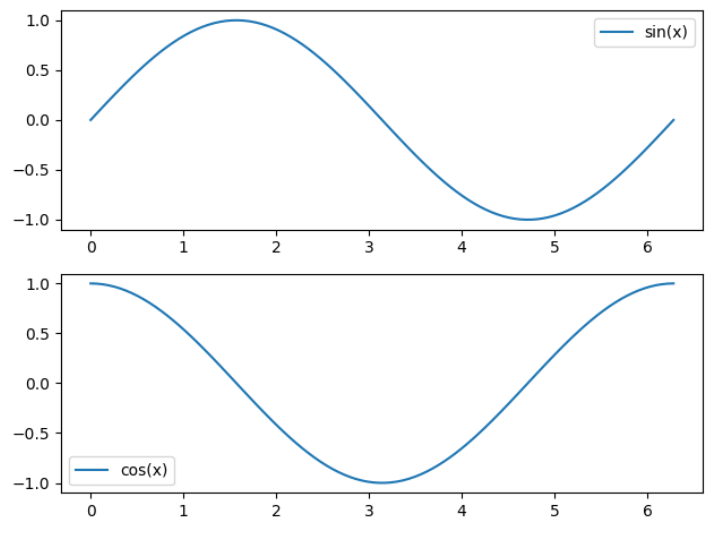
In this example, we will create a figure with multiple subplots.
import matplotlib.pyplot as plt
import numpy as np

# Create some data
x = np.linspace(0, 2 * np.pi, 100)
y1 = np.sin(x)
y2 = np.cos(x)

# Create a figure with two subplots
plt.subplot(2, 1, 1)
plt.plot(x, y1, label='sin(x)')
plt.legend()

plt.subplot(2, 1, 2)
plt.plot(x, y2, label='cos(x)')
plt.legend()

# Adjust the spacing between subplots
plt.tight_layout()

# Show the plot
plt.show()
Output:
Example 3: Subplot Grid
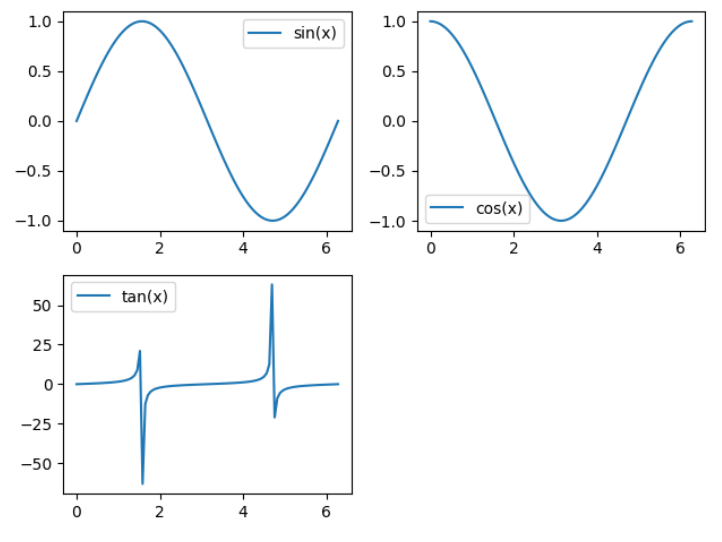
In this example, we will create a figure with a grid of subplots.
import matplotlib.pyplot as plt
import numpy as np

# Create some data
x = np.linspace(0, 2 * np.pi, 100)
y1 = np.sin(x)
y2 = np.cos(x)
y3 = np.tan(x)

# Create a figure with a grid of 2x2 subplots
plt.subplot(2, 2, 1)
plt.plot(x, y1, label='sin(x)')
plt.legend()

plt.subplot(2, 2, 2)
plt.plot(x, y2, label='cos(x)')
plt.legend()

plt.subplot(2, 2, 3)
plt.plot(x, y3, label='tan(x)')
plt.legend()

# Adjust the spacing between subplots
plt.tight_layout()

# Show the plot
plt.show()
Output:
Example 4: Sharing Axes
In this example, we will create a figure with subplots sharing the same x or y axis.
import matplotlib.pyplot as plt
import numpy as np

# Create some data
x = np.linspace(0, 2 * np.pi, 100)
y1 = np.sin(x)
y2 = np.cos(x)

# Create a figure with two subplots sharing the x-axis
plt.subplot(2, 1, 1)
plt.plot(x, y1, label='sin(x)')
plt.legend()

plt.subplot(2, 1, 2, sharex=True)
plt.plot(x, y2, label='cos(x)')
plt.legend()

# Show the plot
plt.show()
Example 5: Axes Labels and Titles
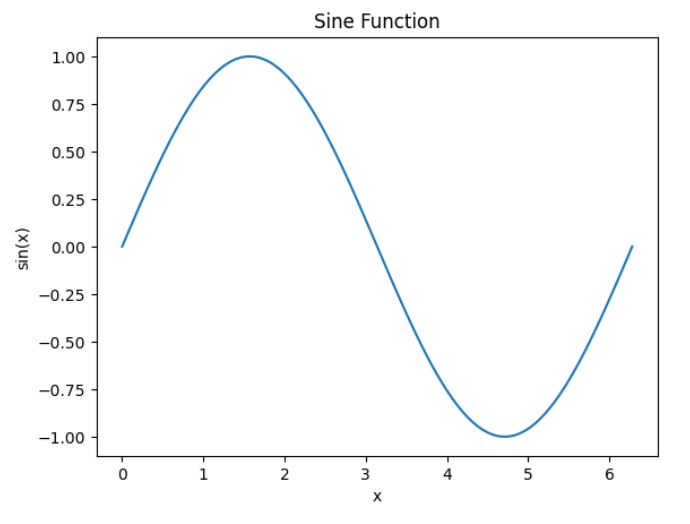
In this example, we will add labels and titles to the subplots.
import matplotlib.pyplot as plt
import numpy as np

# Create some data
x = np.linspace(0, 2 * np.pi, 100)
y = np.sin(x)

# Create a figure with a single subplot
plt.subplot(1, 1, 1)

# Plot the data
plt.plot(x, y)

# Add labels and titles
plt.xlabel('x')
plt.ylabel('sin(x)')
plt.title('Sine Function')

# Show the plot
plt.show()
Output:
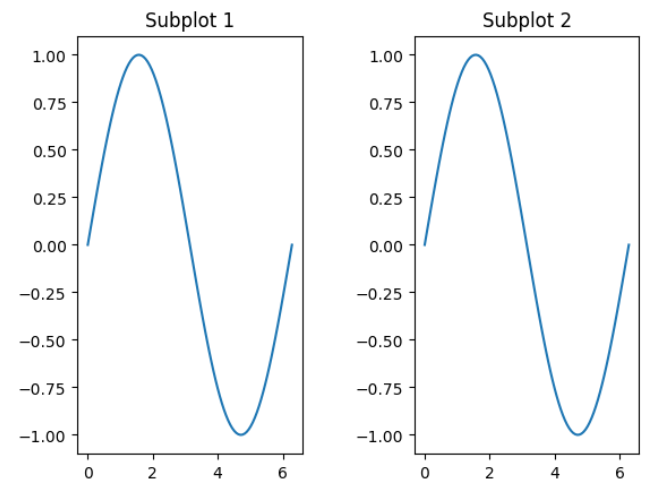
Example 6: Subplot Sizes
In this example, we will adjust the sizes of the subplots.
import matplotlib.pyplot as plt
import numpy as np

# Create some data
x = np.linspace(0, 2 * np.pi, 100)
y = np.sin(x)

# Create a figure with two subplots of different sizes
plt.subplot(1, 2, 1)
plt.plot(x, y)
plt.title('Subplot 1')

plt.subplot(1, 2, 2)
plt.plot(x, y)
plt.title('Subplot 2')

# Adjust the size of subplot 2
plt.subplots_adjust(wspace=0.5)

# Show the plot
plt.show()
Output:
Example 7: Subplot Spacing
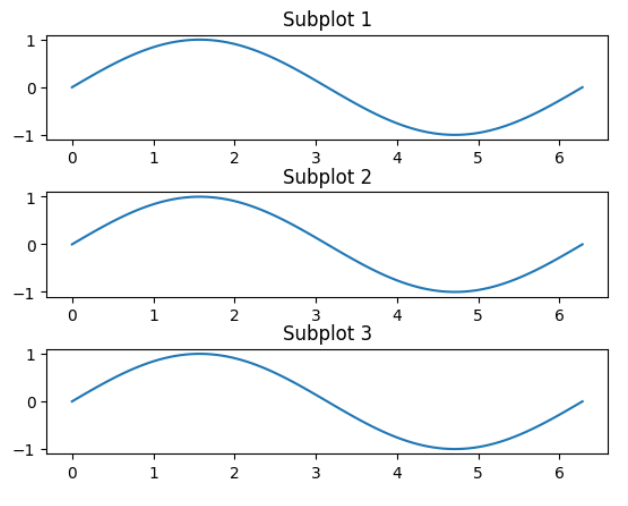
In this example, we will adjust the spacing between subplots.
import matplotlib.pyplot as plt
import numpy as np

# Create some data
x = np.linspace(0, 2 * np.pi, 100)
y = np.sin(x)

# Create a figure with three subplots
plt.subplot(3, 1, 1)
plt.plot(x, y)
plt.title('Subplot 1')

plt.subplot(3, 1, 2)
plt.plot(x, y)
plt.title('Subplot 2')

plt.subplot(3, 1, 3)
plt.plot(x, y)
plt.title('Subplot 3')

# Adjust the spacing between subplots
plt.subplots_adjust(hspace=0.5)

# Show the plot
plt.show()
Output:
Example 8: Subplot Gridspec
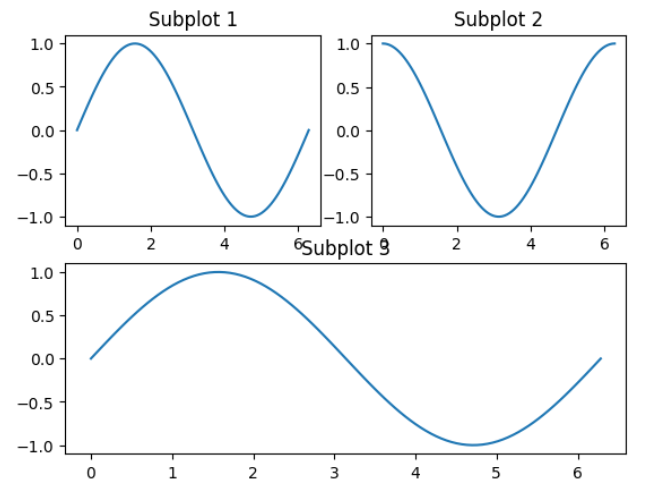
In this example, we will use the GridSpec class to create subplots with custom layout.
import matplotlib.pyplot as plt
import matplotlib.gridspec as gridspec
import numpy as np

# Create some data
x = np.linspace(0, 2 * np.pi, 100)
y1 = np.sin(x)
y2 = np.cos(x)

# Create a figure with custom layout
fig = plt.figure()

gs = gridspec.GridSpec(2, 2)
ax1 = fig.add_subplot(gs[0, 0])
ax1.plot(x, y1)
ax1.set_title('Subplot 1')

ax2 = fig.add_subplot(gs[0, 1])
ax2.plot(x, y2)
ax2.set_title('Subplot 2')

ax3 = fig.add_subplot(gs[1, :])
ax3.plot(x, y1)
ax3.set_title('Subplot 3')

# Show the plot
plt.show()
Output:
Example 9: Subplot with Image
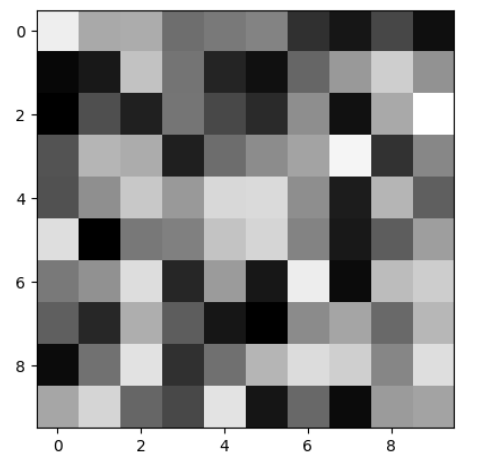
In this example, we will create a subplot with an image.
import matplotlib.pyplot as plt
import numpy as np

# Create some image data
image = np.random.rand(10, 10)

# Create a figure with a single subplot
plt.subplot(1, 1, 1)

# Plot the image
plt.imshow(image, cmap='gray')

# Show the plot
plt.show()
Output:
Example 10: Subplot with Colorbar
In this example, we will create a subplot with a colorbar.
import matplotlib.pyplot as plt
import numpy as np

# Create some data
x = np.linspace(0, 2 * np.pi, 100)
y = np.sin(x)

# Create a figure with two subplots
plt.subplot(1, 2, 1)
plt.plot(x, y)
plt.title('Subplot 1')

plt.subplot(1, 2, 2)
plt.scatter(x, y, c=y, cmap='viridis')
plt.colorbar(label='sin(x)')

# Show the plot
plt.show()
Output:
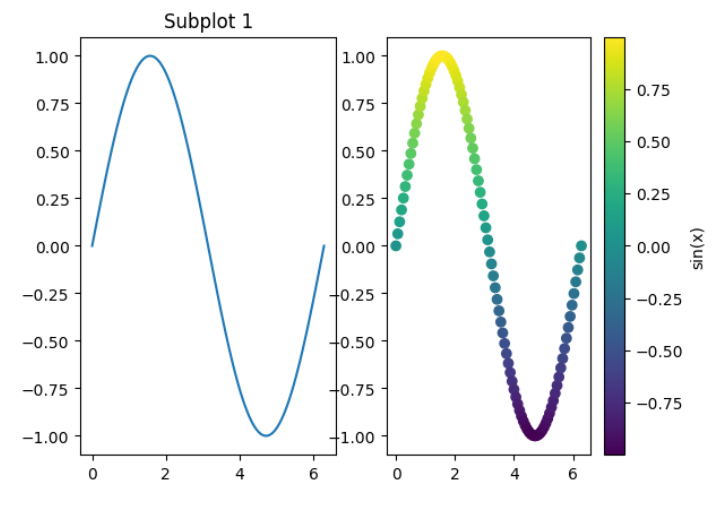
These examples demonstrate the versatility of Matplotlib’s subplot functionality. You can create multiple subplots in various configurations, share axes between subplots, adjust spacing, and include images or colorbars within subplots.
Experiment with these examples and explore further possibilities. Subplots provide a powerful way to organize and visualize your data effectively in a single figure.