Matplotlib Inline
Matplotlib is a powerful Python library used for creating visualizations. It provides a wide range of plots, charts, and graphs to help us analyze and understand our data. One of the most convenient ways to use Matplotlib is through the “inline” backend.
The inline backend allows us to generate and display plots directly within our Jupyter Notebook or JupyterLab environment. It eliminates the need to save plots to external files or display them in separate windows, making it incredibly user-friendly.
To use the inline backend, we need to first import the Matplotlib library and then include the %matplotlib inline magic command at the beginning of our notebook.
import matplotlib.pyplot as plt
%matplotlib inline
Once we have set up the inline backend, we can start creating our visualizations. Let’s look at ten code examples that demonstrate the capabilities of Matplotlib inline:
Basic Line Plot
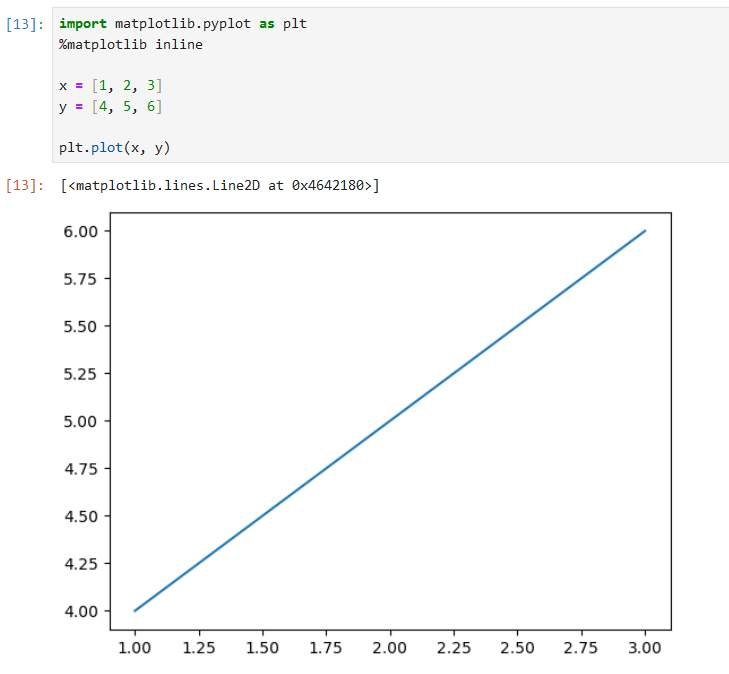
This example shows how to create a simple line plot using Matplotlib inline. It generates a plot with two data points.
import matplotlib.pyplot as plt
%matplotlib inline

x = [1, 2, 3]
y = [4, 5, 6]

plt.plot(x, y)
Scatter Plot
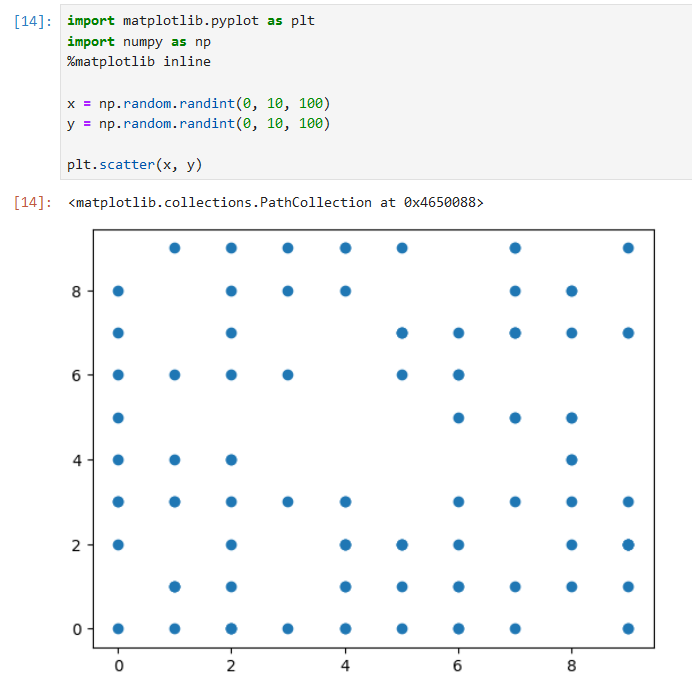
This code snippet demonstrates how to create a scatter plot using Matplotlib inline. It plots randomly generated points within a specified range.
import matplotlib.pyplot as plt
import numpy as np
%matplotlib inline

x = np.random.randint(0, 10, 100)
y = np.random.randint(0, 10, 100)

plt.scatter(x, y)
Bar Plot
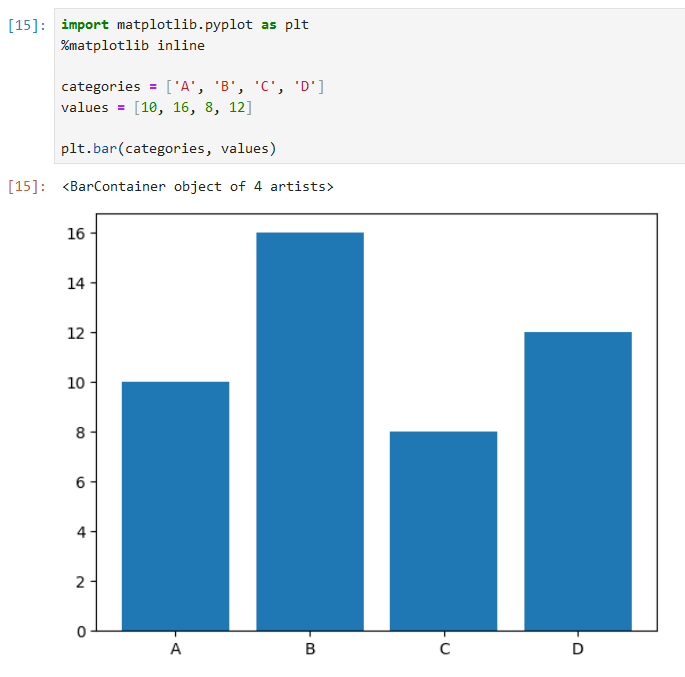
The following example showcases how to generate a bar plot using Matplotlib inline. It plots bars representing the value of each category.
import matplotlib.pyplot as plt
%matplotlib inline

categories = ['A', 'B', 'C', 'D']
values = [10, 16, 8, 12]

plt.bar(categories, values)
Histogram
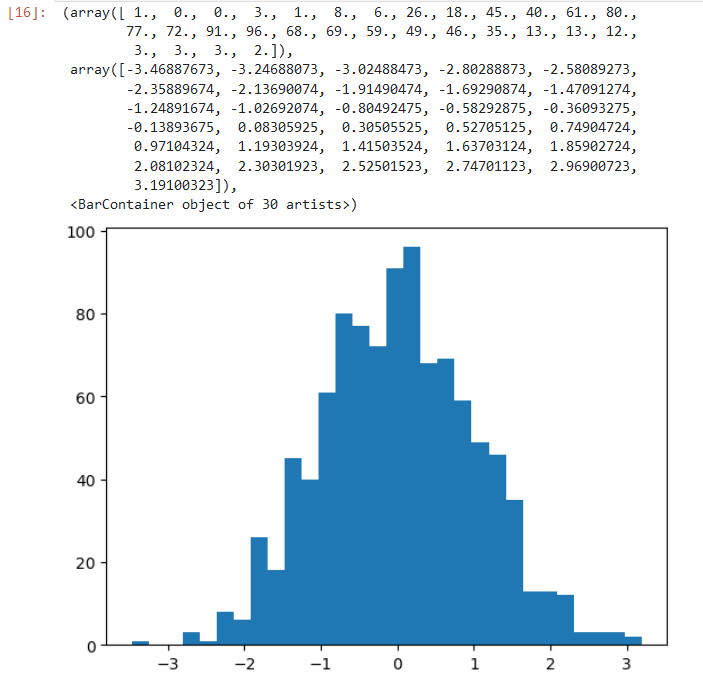
This piece of code creates a histogram using Matplotlib inline. It assigns data to bins and displays their frequency distribution.
import matplotlib.pyplot as plt
import numpy as np
%matplotlib inline

data = np.random.randn(1000)

plt.hist(data, bins=30)
Pie Chart
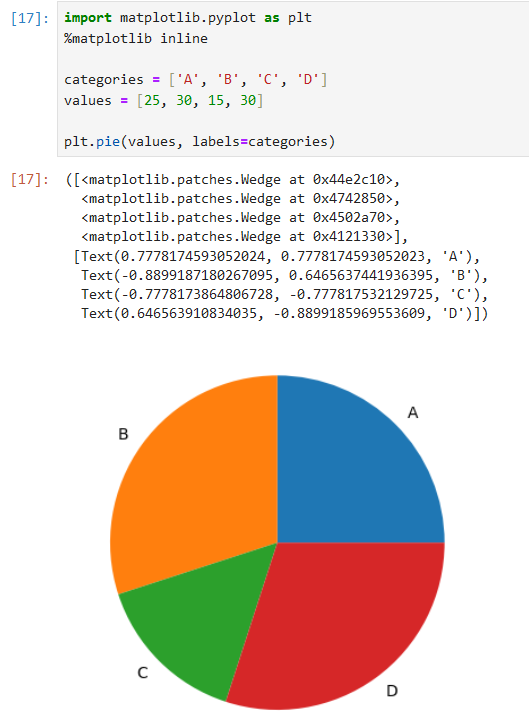
The following code example demonstrates how to generate a pie chart using Matplotlib inline. It represents the proportion of each category as a slice of the pie.
import matplotlib.pyplot as plt
%matplotlib inline

categories = ['A', 'B', 'C', 'D']
values = [25, 30, 15, 30]

plt.pie(values, labels=categories)
Box Plot
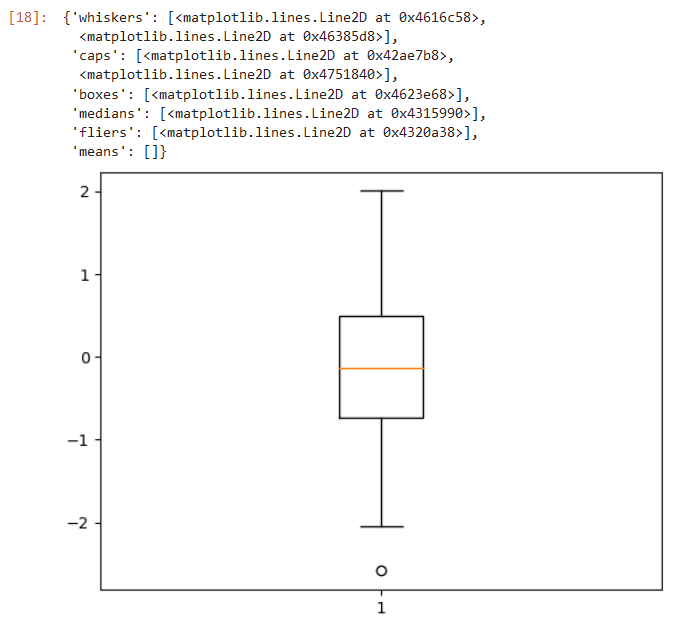
This code snippet creates a box plot using Matplotlib inline. It displays the distribution, skewness, and outliers of a dataset.
import matplotlib.pyplot as plt
import numpy as np
%matplotlib inline

data = np.random.normal(0, 1, 100)

plt.boxplot(data)
Heatmap
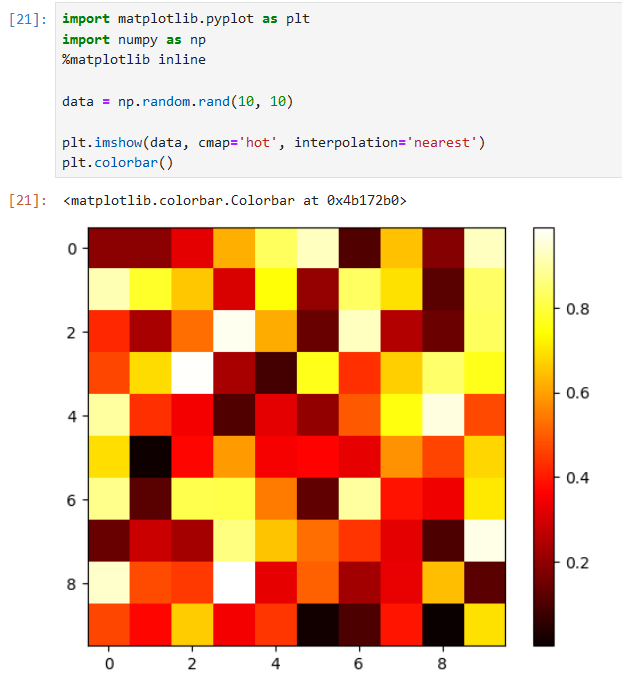
The following example showcases how to generate a heatmap using Matplotlib inline. It represents the values of a matrix as colors.
import matplotlib.pyplot as plt
import numpy as np
%matplotlib inline

data = np.random.rand(10, 10)

plt.imshow(data, cmap='hot', interpolation='nearest')
plt.colorbar()
3D Plot
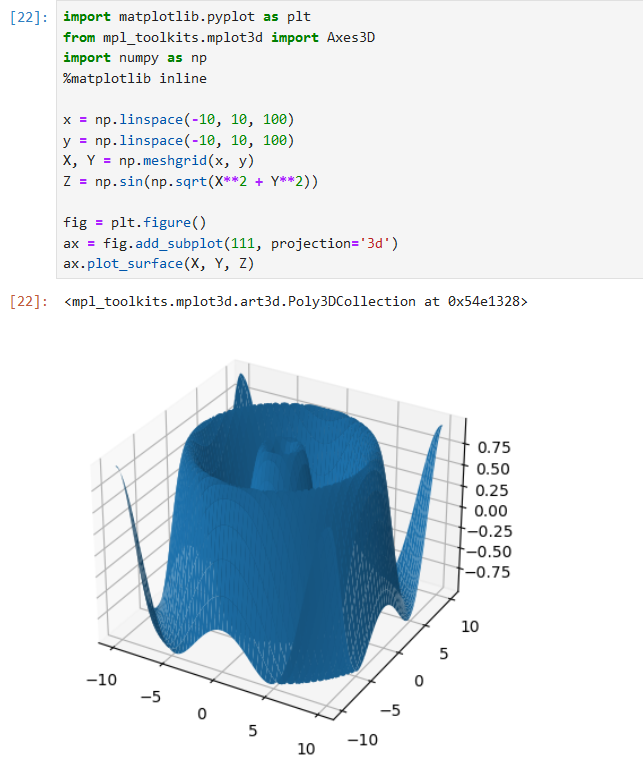
This code snippet demonstrates how to create a 3D plot using Matplotlib inline. It generates a surface plot based on randomly generated data.
import matplotlib.pyplot as plt
from mpl_toolkits.mplot3d import Axes3D
import numpy as np
%matplotlib inline

x = np.linspace(-10, 10, 100)
y = np.linspace(-10, 10, 100)
X, Y = np.meshgrid(x, y)
Z = np.sin(np.sqrt(X**2 + Y**2))

fig = plt.figure()
ax = fig.add_subplot(111, projection='3d')
ax.plot_surface(X, Y, Z)
Polar Plot
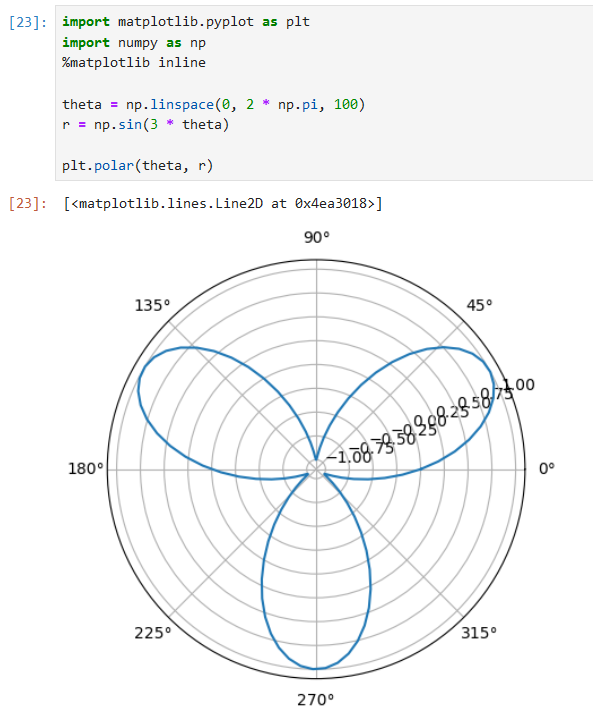
The following example showcases how to generate a polar plot using Matplotlib inline. It plots a curve in polar coordinates.
import matplotlib.pyplot as plt
import numpy as np
%matplotlib inline

theta = np.linspace(0, 2 * np.pi, 100)
r = np.sin(3 * theta)

plt.polar(theta, r)
Subplots
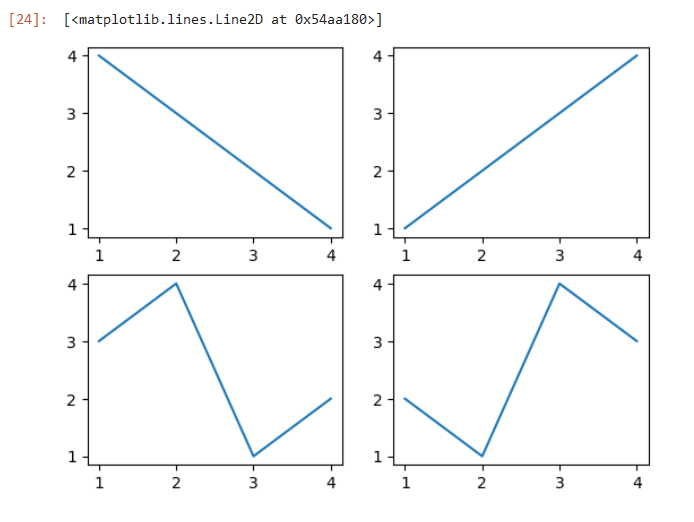
This code snippet demonstrates how to create multiple subplots using Matplotlib inline. It generates four plots arranged in a 2×2 grid.
import matplotlib.pyplot as plt
%matplotlib inline

x = [1, 2, 3, 4]
y1 = [4, 3, 2, 1]
y2 = [1, 2, 3, 4]
y3 = [3, 4, 1, 2]
y4 = [2, 1, 4, 3]

fig, axes = plt.subplots(nrows=2, ncols=2)

axes[0, 0].plot(x, y1)
axes[0, 1].plot(x, y2)
axes[1, 0].plot(x, y3)
axes[1, 1].plot(x, y4)
These ten code examples demonstrate the versatility of Matplotlib inline. From basic line plots to complex 3D visualizations, Matplotlib inline allows us to create various types of plots and analyze our data effectively. The ability to generate and display plots directly within the Jupyter Notebook or JupyterLab environment enhances the exploration and communication of our findings.