Comprehensive Guide to Using Matplotlib.pyplot.table() Function in Python for Data Visualization
Matplotlib.pyplot.table() function in Python is a powerful tool for creating tables within plots. This function is part of the Matplotlib library, which is widely used for data visualization in Python. The table() function allows you to add a table to your plot, providing a way to display tabular data alongside your graphical representations. In this comprehensive guide, we’ll explore the various aspects of the Matplotlib.pyplot.table() function, its parameters, usage, and practical applications.
Introduction to Matplotlib.pyplot.table() Function
The Matplotlib.pyplot.table() function is a versatile tool for adding tables to your plots. It’s particularly useful when you want to display numerical or textual data in a structured format within your visualization. This function is part of the pyplot module in Matplotlib, which provides a MATLAB-like plotting interface.
Let’s start with a basic example to illustrate how to use the Matplotlib.pyplot.table() function:
import matplotlib.pyplot as plt
import numpy as np

data = [['A', 'B', 'C'],
        [1, 2, 3],
        [4, 5, 6]]

fig, ax = plt.subplots()
table = ax.table(cellText=data, loc='center')

ax.axis('off')
plt.title('Basic Table Example - how2matplotlib.com')
plt.show()
Output:

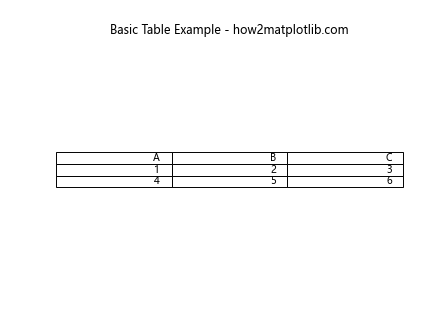
In this example, we create a simple table using the Matplotlib.pyplot.table() function. We define our data as a list of lists, where each inner list represents a row in the table. The cellText parameter is used to pass this data to the table() function. We set the location of the table to ‘center’ using the loc parameter. Finally, we turn off the axis and add a title to our plot.
Parameters of Matplotlib.pyplot.table() Function
The Matplotlib.pyplot.table() function comes with a variety of parameters that allow you to customize the appearance and behavior of your table. Let’s explore some of the key parameters:
- cellText: This parameter takes a 2D list or array of the table’s cell values.
cellColours: This parameter allows you to set the background colors for each cell.
cellLoc: This parameter determines the alignment of text within cells.
colWidths: This parameter sets the column widths.
rowLabels: This parameter allows you to add labels to rows.
colLabels: This parameter allows you to add labels to columns.
loc: This parameter sets the location of the table within the axes.
Let’s see an example that uses some of these parameters: