Comprehensive Guide to Matplotlib.pyplot.subplot() Function in Python
Matplotlib.pyplot.subplot() function in Python is a powerful tool for creating multiple plots within a single figure. This function is an essential part of the Matplotlib library, which is widely used for data visualization in Python. In this comprehensive guide, we’ll explore the Matplotlib.pyplot.subplot() function in depth, covering its syntax, parameters, and various use cases. We’ll also provide numerous examples to illustrate how to use this function effectively in your data visualization projects.
Understanding the Basics of Matplotlib.pyplot.subplot() Function
The Matplotlib.pyplot.subplot() function is used to create a subplot in a figure. A subplot is essentially a smaller plot within a larger figure, allowing you to display multiple plots side by side or in a grid layout. This function is particularly useful when you want to compare different datasets or show various aspects of the same data in a single view.
The basic syntax of the Matplotlib.pyplot.subplot() function is as follows:
import matplotlib.pyplot as plt

plt.subplot(nrows, ncols, index)
Here’s a simple example to illustrate the basic usage of the Matplotlib.pyplot.subplot() function:
import matplotlib.pyplot as plt
import numpy as np

x = np.linspace(0, 10, 100)
y1 = np.sin(x)
y2 = np.cos(x)

plt.subplot(2, 1, 1)
plt.plot(x, y1)
plt.title('Sine Wave - how2matplotlib.com')

plt.subplot(2, 1, 2)
plt.plot(x, y2)
plt.title('Cosine Wave - how2matplotlib.com')

plt.tight_layout()
plt.show()
Output:
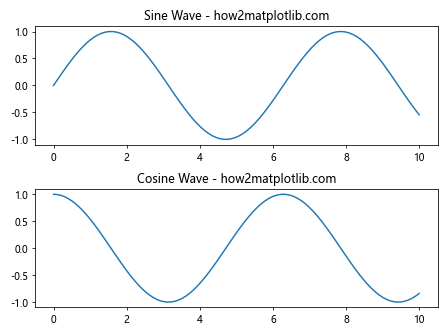
In this example, we create two subplots arranged vertically. The first subplot displays a sine wave, while the second subplot shows a cosine wave. The plt.subplot(2, 1, 1) call creates the first subplot in a 2×1 grid, and plt.subplot(2, 1, 2) creates the second subplot.
Parameters of Matplotlib.pyplot.subplot() Function
The Matplotlib.pyplot.subplot() function takes several parameters that allow you to customize the layout and appearance of your subplots. Let’s explore these parameters in detail:
nrows: The number of rows in the subplot grid.ncols: The number of columns in the subplot grid.index: The index of the current subplot within the grid.projection: The projection type of the axes (e.g., ‘rectilinear’, ‘polar’, ‘3d’).sharex,sharey: Boolean values to indicate whether to share x or y axes among subplots.squeeze: A boolean value to determine whether to remove single-dimensional entries from the subplot grid.subplot_kw: A dictionary of keywords to be passed to theadd_subplot()call.gridspec_kw: A dictionary of keywords to be passed to theGridSpecconstructor.
Here’s an example that demonstrates the use of some of these parameters:
import matplotlib.pyplot as plt
import numpy as np

x = np.linspace(0, 2*np.pi, 100)
y1 = np.sin(x)
y2 = np.cos(x)

fig, (ax1, ax2) = plt.subplots(2, 1, sharex=True, figsize=(8, 6))

ax1.plot(x, y1)
ax1.set_title('Sine Wave - how2matplotlib.com')

ax2.plot(x, y2)
ax2.set_title('Cosine Wave - how2matplotlib.com')

plt.tight_layout()
plt.show()
Output:
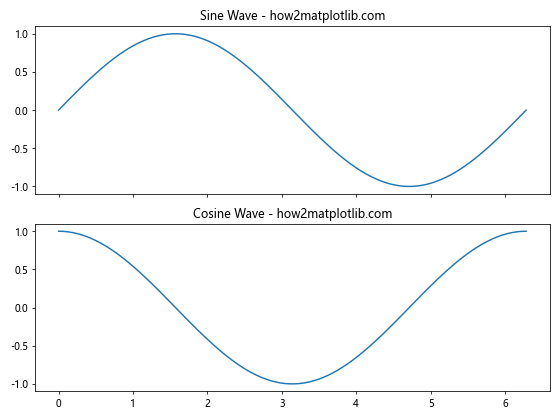
In this example, we use the plt.subplots() function, which is a convenience wrapper around subplot(). We create two subplots with shared x-axes and specify a custom figure size.
Creating Complex Subplot Layouts with Matplotlib.pyplot.subplot() Function
The Matplotlib.pyplot.subplot() function allows you to create complex subplot layouts by specifying different combinations of rows and columns. Let’s explore some examples of creating various subplot layouts:
2×2 Grid Layout
import matplotlib.pyplot as plt
import numpy as np

x = np.linspace(0, 10, 100)

plt.subplot(2, 2, 1)
plt.plot(x, np.sin(x))
plt.title('Sine - how2matplotlib.com')

plt.subplot(2, 2, 2)
plt.plot(x, np.cos(x))
plt.title('Cosine - how2matplotlib.com')

plt.subplot(2, 2, 3)
plt.plot(x, np.tan(x))
plt.title('Tangent - how2matplotlib.com')

plt.subplot(2, 2, 4)
plt.plot(x, np.exp(x))
plt.title('Exponential - how2matplotlib.com')

plt.tight_layout()
plt.show()
Output:
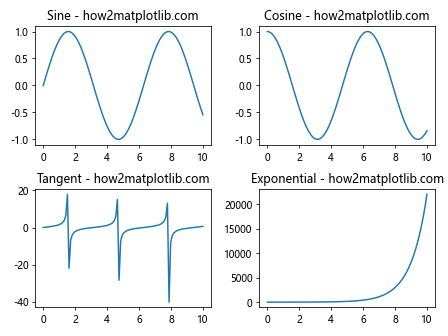
This example creates a 2×2 grid of subplots, each displaying a different mathematical function.
Customizing Subplots with Matplotlib.pyplot.subplot() Function
The Matplotlib.pyplot.subplot() function allows you to customize various aspects of your subplots. Let’s explore some common customization techniques:
Adjusting Subplot Spacing
import matplotlib.pyplot as plt
import numpy as np

x = np.linspace(0, 10, 100)

plt.figure(figsize=(10, 8))

plt.subplot(2, 2, 1)
plt.plot(x, np.sin(x))
plt.title('Sine - how2matplotlib.com')

plt.subplot(2, 2, 2)
plt.plot(x, np.cos(x))
plt.title('Cosine - how2matplotlib.com')

plt.subplot(2, 2, 3)
plt.plot(x, np.tan(x))
plt.title('Tangent - how2matplotlib.com')

plt.subplot(2, 2, 4)
plt.plot(x, np.exp(x))
plt.title('Exponential - how2matplotlib.com')

plt.subplots_adjust(wspace=0.4, hspace=0.4)
plt.show()
Output:
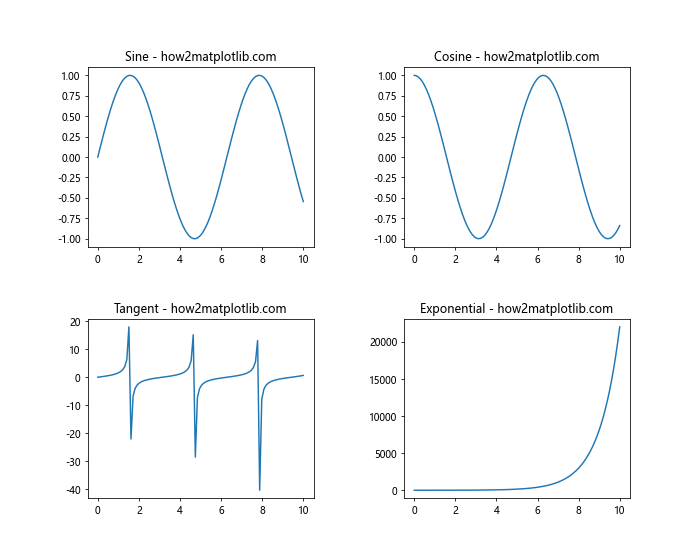
In this example, we use plt.subplots_adjust() to increase the spacing between subplots.
Adding a Common Title and Adjusting Subplot Positions
import matplotlib.pyplot as plt
import numpy as np

x = np.linspace(0, 10, 100)

fig = plt.figure(figsize=(10, 8))

plt.subplot(2, 2, 1)
plt.plot(x, np.sin(x))
plt.title('Sine - how2matplotlib.com')

plt.subplot(2, 2, 2)
plt.plot(x, np.cos(x))
plt.title('Cosine - how2matplotlib.com')

plt.subplot(2, 2, 3)
plt.plot(x, np.tan(x))
plt.title('Tangent - how2matplotlib.com')

plt.subplot(2, 2, 4)
plt.plot(x, np.exp(x))
plt.title('Exponential - how2matplotlib.com')

fig.suptitle('Mathematical Functions - how2matplotlib.com', fontsize=16)
plt.tight_layout(rect=[0, 0.03, 1, 0.95])
plt.show()
Output:
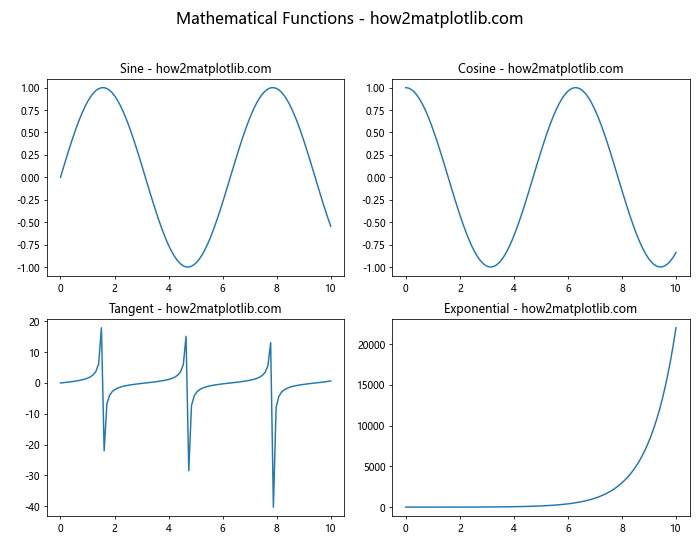
This example adds a common title to the figure and adjusts the subplot positions to accommodate the title.
Advanced Techniques with Matplotlib.pyplot.subplot() Function
Let’s explore some advanced techniques and use cases for the Matplotlib.pyplot.subplot() function:
Creating Subplots with Different Sizes
import matplotlib.pyplot as plt
import numpy as np

x = np.linspace(0, 10, 100)

fig = plt.figure(figsize=(12, 8))

gs = fig.add_gridspec(3, 3)

ax1 = fig.add_subplot(gs[0, :])
ax1.plot(x, np.sin(x))
ax1.set_title('Sine Wave (Full Width) - how2matplotlib.com')

ax2 = fig.add_subplot(gs[1, :-1])
ax2.plot(x, np.cos(x))
ax2.set_title('Cosine Wave - how2matplotlib.com')

ax3 = fig.add_subplot(gs[1:, -1])
ax3.plot(x, np.exp(x))
ax3.set_title('Exponential (Tall) - how2matplotlib.com')

ax4 = fig.add_subplot(gs[-1, 0])
ax4.plot(x, np.log(x))
ax4.set_title('Logarithm - how2matplotlib.com')

ax5 = fig.add_subplot(gs[-1, -2])
ax5.plot(x, x**2)
ax5.set_title('Quadratic - how2matplotlib.com')

plt.tight_layout()
plt.show()
Output:
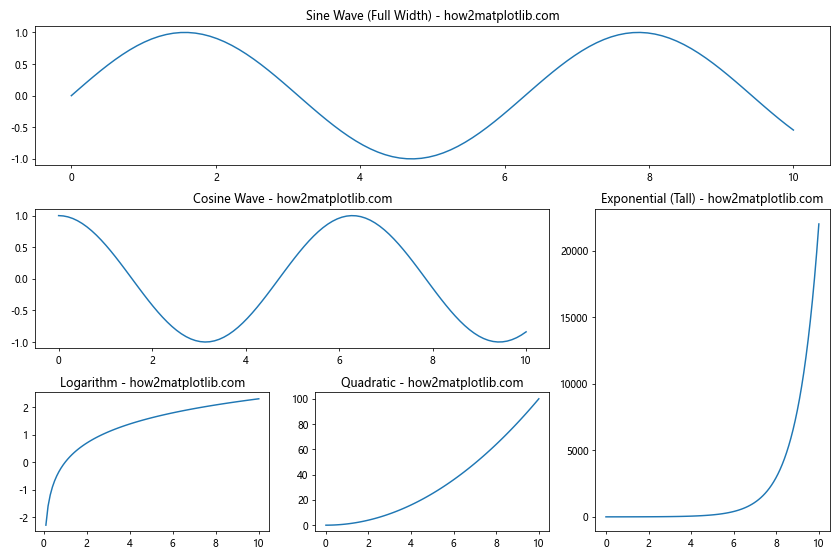
This example demonstrates how to create subplots with different sizes using GridSpec.
Creating Subplots with Different Projections
import matplotlib.pyplot as plt
import numpy as np

fig = plt.figure(figsize=(12, 8))

# 2D plot
ax1 = fig.add_subplot(2, 2, 1)
x = np.linspace(0, 10, 100)
ax1.plot(x, np.sin(x))
ax1.set_title('2D Sine Wave - how2matplotlib.com')

# Polar plot
ax2 = fig.add_subplot(2, 2, 2, projection='polar')
theta = np.linspace(0, 2*np.pi, 100)
r = np.cos(4*theta)
ax2.plot(theta, r)
ax2.set_title('Polar Plot - how2matplotlib.com')

# 3D plot
ax3 = fig.add_subplot(2, 2, 3, projection='3d')
x = np.linspace(-5, 5, 100)
y = np.linspace(-5, 5, 100)
X, Y = np.meshgrid(x, y)
Z = np.sin(np.sqrt(X**2 + Y**2))
ax3.plot_surface(X, Y, Z)
ax3.set_title('3D Surface Plot - how2matplotlib.com')

# Image plot
ax4 = fig.add_subplot(2, 2, 4)
data = np.random.rand(10, 10)
ax4.imshow(data, cmap='viridis')
ax4.set_title('Image Plot - how2matplotlib.com')

plt.tight_layout()
plt.show()
Output:
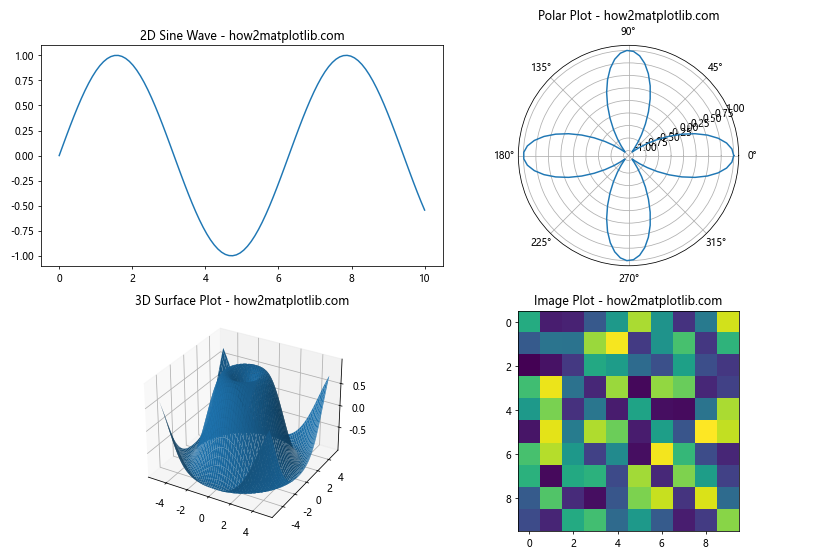
This example showcases how to create subplots with different projections, including 2D, polar, 3D, and image plots.
Handling Large Numbers of Subplots with Matplotlib.pyplot.subplot() Function
When dealing with a large number of subplots, it’s important to manage them efficiently. Let’s explore some techniques for handling multiple subplots:
Creating a Grid of Subplots
import matplotlib.pyplot as plt
import numpy as np

def plot_function(ax, func, title):
    x = np.linspace(0, 10, 100)
    ax.plot(x, func(x))
    ax.set_title(f'{title} - how2matplotlib.com')

functions = [
    (np.sin, 'Sine'),
    (np.cos, 'Cosine'),
    (np.tan, 'Tangent'),
    (np.exp, 'Exponential'),
    (np.log, 'Logarithm'),
    (lambda x: x**2, 'Quadratic'),
    (lambda x: x**3, 'Cubic'),
    (np.sqrt, 'Square Root'),
    (lambda x: 1/x, 'Reciprocal')
]

fig, axes = plt.subplots(3, 3, figsize=(15, 15))

for (func, title), ax in zip(functions, axes.flatten()):
    plot_function(ax, func, title)

plt.tight_layout()
plt.show()
Output:
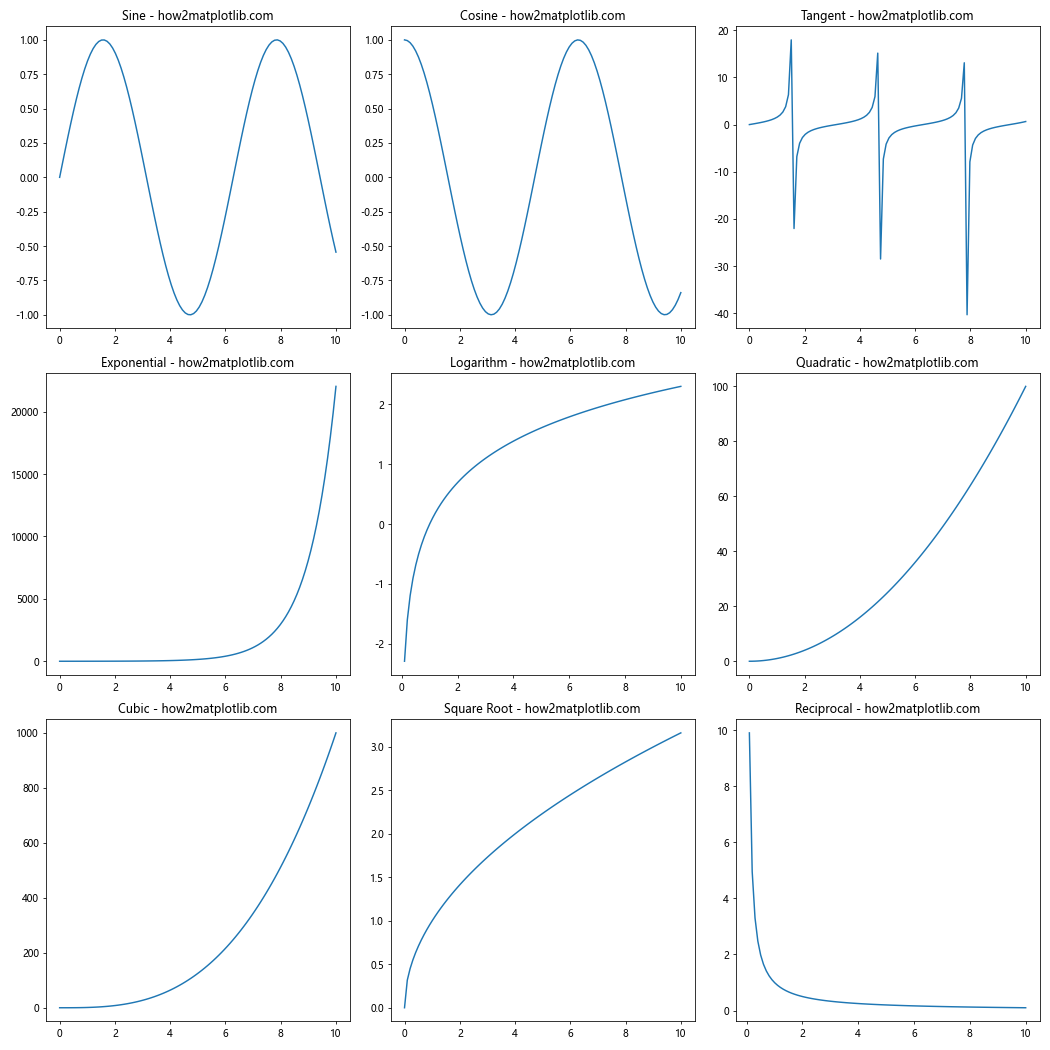
This example creates a 3×3 grid of subplots, each displaying a different mathematical function.
Using plt.subplots() for Efficient Subplot Creation
import matplotlib.pyplot as plt
import numpy as np

x = np.linspace(0, 10, 100)
y1 = np.sin(x)
y2 = np.cos(x)
y3 = np.tan(x)
y4 = np.exp(x)

fig, axes = plt.subplots(2, 2, figsize=(12, 10))

axes[0, 0].plot(x, y1)
axes[0, 0].set_title('Sine Wave - how2matplotlib.com')

axes[0, 1].plot(x, y2)
axes[0, 1].set_title('Cosine Wave - how2matplotlib.com')

axes[1, 0].plot(x, y3)
axes[1, 0].set_title('Tangent Wave - how2matplotlib.com')

axes[1, 1].plot(x, y4)
axes[1, 1].set_title('Exponential Function - how2matplotlib.com')

plt.tight_layout()
plt.show()
Output:
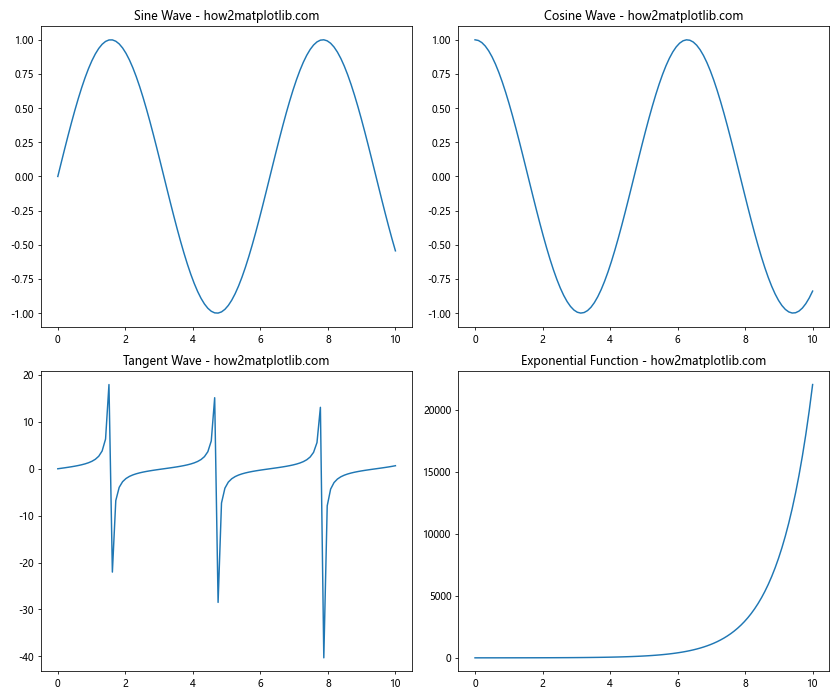
This example demonstrates how to use plt.subplots() to create a 2×2 grid of subplots efficiently.
Customizing Subplot Appearance with Matplotlib.pyplot.subplot() Function
The Matplotlib.pyplot.subplot() function allows for extensive customization of subplot appearance. Let’s explore some techniques for enhancing the visual appeal of your subplots:
Customizing Axes Labels and Ticks
import matplotlib.pyplot as plt
import numpy as np

x = np.linspace(0, 10, 100)
y = np.sin(x)

fig, ax = plt.subplots(figsize=(10, 6))

ax.plot(x, y)
ax.set_title('Customized Sine Wave Plot - how2matplotlib.com', fontsize=16)
ax.set_xlabel('X-axis Label', fontsize=12)
ax.set_ylabel('Y-axis Label', fontsize=12)

ax.tick_params(axis='both', which='major', labelsize=10)
ax.set_xticks(np.arange(0, 11, 2))
ax.set_yticks(np.arange(-1, 1.1, 0.5))ax.grid(True, linestyle='--', alpha=0.7)

plt.tight_layout()
plt.show()
This example demonstrates how to customize axis labels, tick marks, and add a grid to the subplot.
Adding Legends and Annotations
import matplotlib.pyplot as plt
import numpy as np

x = np.linspace(0, 10, 100)
y1 = np.sin(x)
y2 = np.cos(x)

fig, ax = plt.subplots(figsize=(10, 6))

ax.plot(x, y1, label='Sine')
ax.plot(x, y2, label='Cosine')

ax.set_title('Sine and Cosine Waves - how2matplotlib.com', fontsize=16)
ax.set_xlabel('X-axis', fontsize=12)
ax.set_ylabel('Y-axis', fontsize=12)

ax.legend(fontsize=10)

ax.annotate('Peak', xy=(np.pi/2, 1), xytext=(np.pi/2, 1.2),
            arrowprops=dict(facecolor='black', shrink=0.05))

plt.tight_layout()
plt.show()
Output:
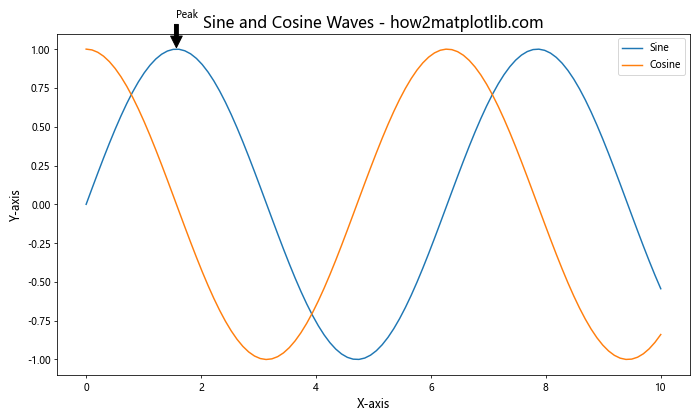
This example shows how to add legends and annotations to your subplots.
Handling Color and Style in Matplotlib.pyplot.subplot() Function
Color and style play a crucial role in making your plots visually appealing and informative. Let’s explore some techniques for managing color and style in your subplots:
Using Custom Color Palettes
import matplotlib.pyplot as plt
import numpy as np

x = np.linspace(0, 10, 100)
y1 = np.sin(x)
y2 = np.cos(x)
y3 = np.tan(x)

fig, ax = plt.subplots(figsize=(10, 6))

custom_colors = ['#FF9999', '#66B2FF', '#99FF99']

ax.plot(x, y1, color=custom_colors[0], label='Sine')
ax.plot(x, y2, color=custom_colors[1], label='Cosine')
ax.plot(x, y3, color=custom_colors[2], label='Tangent')

ax.set_title('Trigonometric Functions with Custom Colors - how2matplotlib.com', fontsize=16)
ax.set_xlabel('X-axis', fontsize=12)
ax.set_ylabel('Y-axis', fontsize=12)

ax.legend(fontsize=10)

plt.tight_layout()
plt.show()
Output:
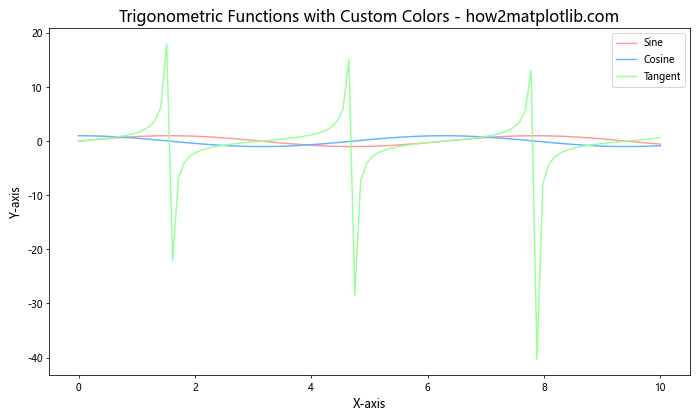
This example demonstrates how to use custom colors for different plots within a subplot.
Applying Different Styles to Subplots
import matplotlib.pyplot as plt
import numpy as np

x = np.linspace(0, 10, 100)
y1 = np.sin(x)
y2 = np.cos(x)

fig, (ax1, ax2) = plt.subplots(1, 2, figsize=(12, 5))

ax1.plot(x, y1, 'r-', linewidth=2)
ax1.set_title('Sine Wave (Default Style) - how2matplotlib.com')

with plt.style.context('seaborn'):
    ax2.plot(x, y2, 'b--', linewidth=2)
    ax2.set_title('Cosine Wave (Seaborn Style) - how2matplotlib.com')

plt.tight_layout()
plt.show()
This example shows how to apply different styles to individual subplots.
Saving and Exporting Subplots Created with Matplotlib.pyplot.subplot() Function
After creating your subplots, you may want to save them for later use or include them in reports. Let’s explore some techniques for saving and exporting subplots:
Saving Subplots as Image Files
import matplotlib.pyplot as plt
import numpy as np

x = np.linspace(0, 10, 100)
y1 = np.sin(x)
y2 = np.cos(x)

fig, (ax1, ax2) = plt.subplots(2, 1, figsize=(8, 10))

ax1.plot(x, y1)
ax1.set_title('Sine Wave - how2matplotlib.com')

ax2.plot(x, y2)
ax2.set_title('Cosine Wave - how2matplotlib.com')

plt.tight_layout()

# Save as PNG
plt.savefig('trigonometric_functions.png', dpi=300, bbox_inches='tight')

# Save as PDF
plt.savefig('trigonometric_functions.pdf', bbox_inches='tight')

plt.show()
Output:
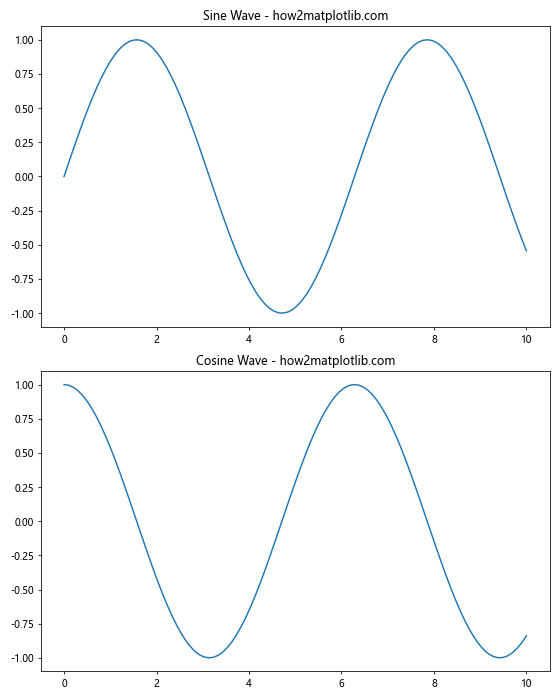
This example demonstrates how to save subplots as both PNG and PDF files.
Exporting Subplots to Different Formats
import matplotlib.pyplot as plt
import numpy as np

x = np.linspace(0, 10, 100)
y = np.sin(x)

fig, ax = plt.subplots(figsize=(8, 6))

ax.plot(x, y)
ax.set_title('Sine Wave - how2matplotlib.com')

plt.tight_layout()

# Save as SVG
plt.savefig('sine_wave.svg', format='svg', dpi=300, bbox_inches='tight')

# Save as EPS
plt.savefig('sine_wave.eps', format='eps', dpi=300, bbox_inches='tight')

# Save as TIFF
plt.savefig('sine_wave.tiff', format='tiff', dpi=300, bbox_inches='tight')

plt.show()
Output:
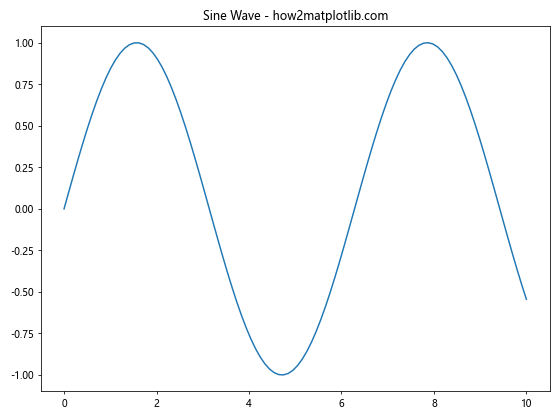
This example shows how to export subplots to various file formats, including SVG, EPS, and TIFF.
Best Practices for Using Matplotlib.pyplot.subplot() Function
To make the most of the Matplotlib.pyplot.subplot() function, it’s important to follow some best practices. Here are some tips to help you create effective and visually appealing subplots:
- Use consistent styling across subplots for a cohesive look.
- Adjust subplot spacing to prevent overlapping or crowding.
- Use appropriate color schemes that are accessible to color-blind viewers.
- Add clear and concise titles, labels, and legends to each subplot.
- Consider using
plt.tight_layout()to automatically adjust subplot parameters. - Use
gridspecfor more complex subplot arrangements. - Limit the number of subplots to maintain readability.
- Use appropriate plot types for different data types and relationships.
Here’s an example that incorporates some of these best practices:
import matplotlib.pyplot as plt
import numpy as np

x = np.linspace(0, 10, 100)
y1 = np.sin(x)
y2 = np.cos(x)
y3 = np.exp(-x/10) * np.sin(np.pi * x)

fig, axes = plt.subplots(2, 2, figsize=(12, 10))

axes[0, 0].plot(x, y1)
axes[0, 0].set_title('Sine Wave - how2matplotlib.com')
axes[0, 0].set_xlabel('X-axis')
axes[0, 0].set_ylabel('Y-axis')

axes[0, 1].plot(x, y2)
axes[0, 1].set_title('Cosine Wave - how2matplotlib.com')
axes[0, 1].set_xlabel('X-axis')
axes[0, 1].set_ylabel('Y-axis')

axes[1, 0].plot(x, y3)
axes[1, 0].set_title('Damped Sine Wave - how2matplotlib.com')
axes[1, 0].set_xlabel('X-axis')
axes[1, 0].set_ylabel('Y-axis')

axes[1, 1].scatter(x, y1, c=y2, cmap='viridis')
axes[1, 1].set_title('Sine vs Cosine Scatter - how2matplotlib.com')
axes[1, 1].set_xlabel('X-axis')
axes[1, 1].set_ylabel('Y-axis')

plt.tight_layout()
plt.show()
Output:
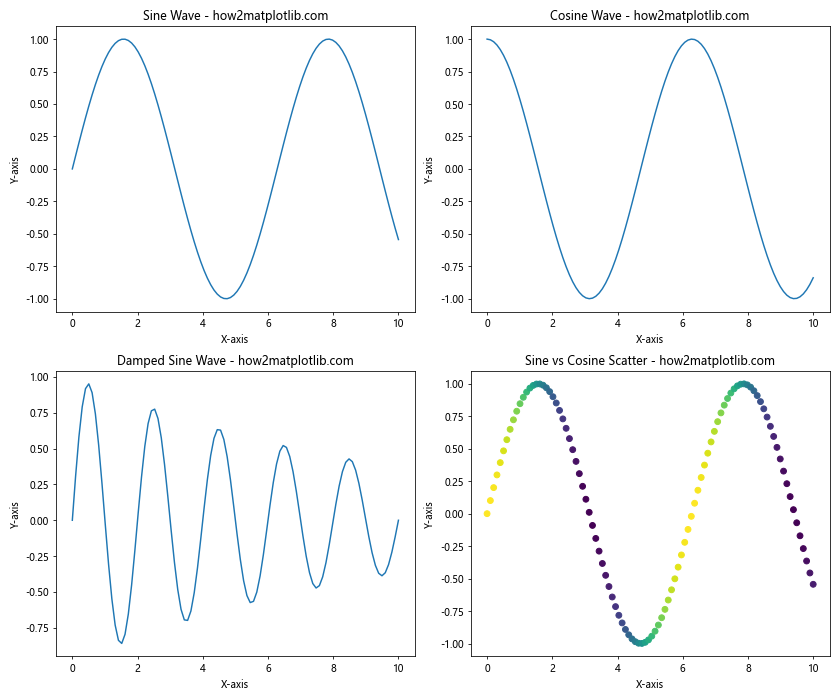
This example demonstrates the use of consistent styling, appropriate labels, and different plot types within a single figure.
Troubleshooting Common Issues with Matplotlib.pyplot.subplot() Function
When working with the Matplotlib.pyplot.subplot() function, you may encounter some common issues. Here are some problems you might face and how to resolve them:
Overlapping Subplots
import matplotlib.pyplot as plt
import numpy as np

x = np.linspace(0, 10, 100)
y = np.sin(x)

fig, axes = plt.subplots(2, 2, figsize=(10, 8))

for ax in axes.flat:
    ax.plot(x, y)
    ax.set_title('Sine Wave - how2matplotlib.com')

# Uncomment the following line to fix overlapping
# plt.tight_layout()

plt.show()
Output:
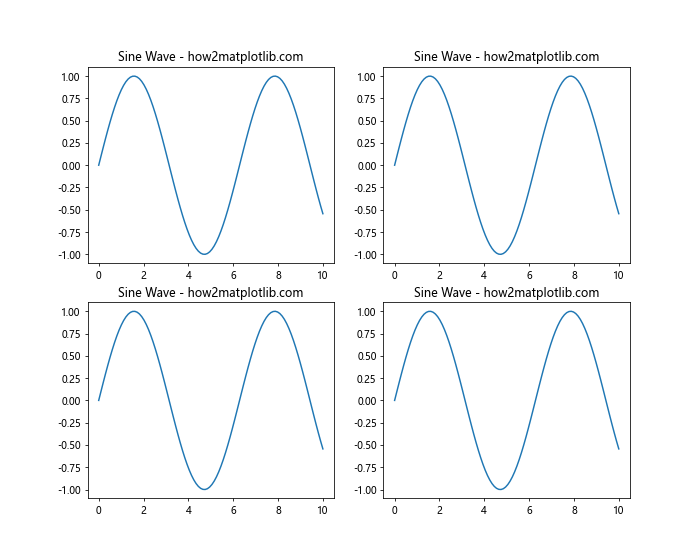
To fix overlapping subplots, use plt.tight_layout() or adjust the spacing manually using plt.subplots_adjust().
Inconsistent Axis Scales
import matplotlib.pyplot as plt
import numpy as np

x = np.linspace(0, 10, 100)
y1 = np.sin(x)
y2 = 100 * np.cos(x)

fig, (ax1, ax2) = plt.subplots(1, 2, figsize=(12, 5))

ax1.plot(x, y1)
ax1.set_title('Sine Wave - how2matplotlib.com')

ax2.plot(x, y2)
ax2.set_title('Scaled Cosine Wave - how2matplotlib.com')

# Uncomment the following line to set consistent y-axis limits
# ax1.set_ylim(ax2.get_ylim())

plt.tight_layout()
plt.show()
Output:
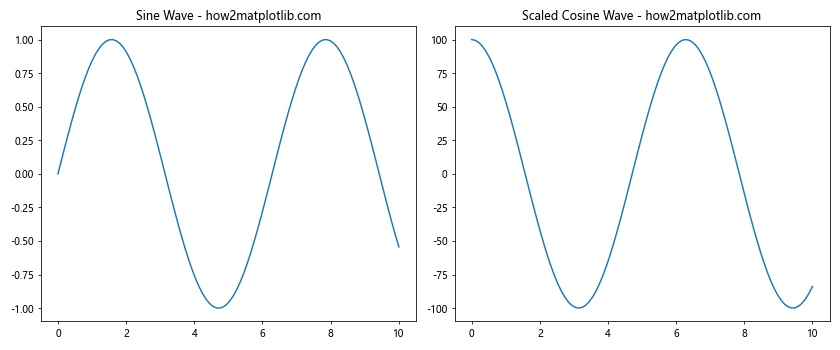
To ensure consistent axis scales across subplots, you can manually set the axis limits using set_ylim() or set_xlim().
Advanced Applications of Matplotlib.pyplot.subplot() Function
The Matplotlib.pyplot.subplot() function can be used for more advanced applications beyond simple plots. Let’s explore some advanced use cases:
Creating Animated Subplots
import matplotlib.pyplot as plt
import numpy as np
from matplotlib.animation import FuncAnimation

fig, (ax1, ax2) = plt.subplots(1, 2, figsize=(12, 5))

x = np.linspace(0, 2*np.pi, 100)
line1, = ax1.plot(x, np.sin(x))
line2, = ax2.plot(x, np.cos(x))

ax1.set_title('Sine Wave - how2matplotlib.com')
ax2.set_title('Cosine Wave - how2matplotlib.com')

def update(frame):
    line1.set_ydata(np.sin(x + frame/10))
    line2.set_ydata(np.cos(x + frame/10))
    return line1, line2

ani = FuncAnimation(fig, update, frames=100, blit=True)

plt.tight_layout()
plt.show()
Output:
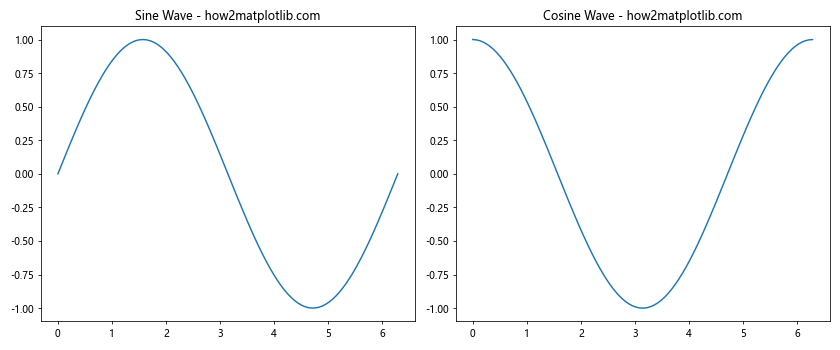
This example creates an animation of sine and cosine waves using subplots.
Creating Interactive Subplots
import matplotlib.pyplot as plt
import numpy as np
from matplotlib.widgets import Slider

fig, (ax1, ax2) = plt.subplots(2, 1, figsize=(8, 10))

x = np.linspace(0, 2*np.pi, 100)
y1 = np.sin(x)
y2 = np.cos(x)

line1, = ax1.plot(x, y1)
line2, = ax2.plot(x, y2)

ax1.set_title('Sine Wave - how2matplotlib.com')
ax2.set_title('Cosine Wave - how2matplotlib.com')

ax_slider = plt.axes([0.2, 0.02, 0.6, 0.03])
slider = Slider(ax_slider, 'Phase', 0, 2*np.pi, valinit=0)

def update(val):
    phase = slider.val
    line1.set_ydata(np.sin(x + phase))
    line2.set_ydata(np.cos(x + phase))
    fig.canvas.draw_idle()

slider.on_changed(update)

plt.tight_layout()
plt.show()
Output:
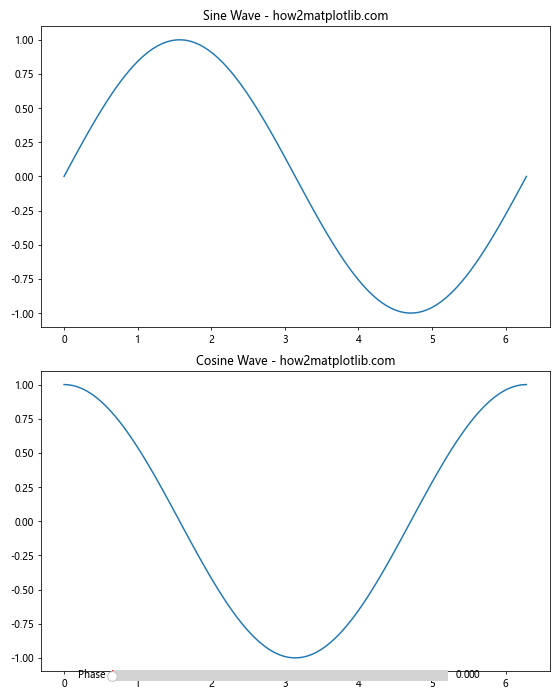
This example creates interactive subplots with a slider to adjust the phase of sine and cosine waves.
Conclusion
The Matplotlib.pyplot.subplot() function is a powerful tool for creating complex and informative visualizations in Python. Throughout this comprehensive guide, we’ve explored various aspects of this function, from basic usage to advanced applications. We’ve covered topics such as creating different subplot layouts, customizing subplot appearance, handling color and style, saving and exporting subplots, and troubleshooting common issues.
By mastering the Matplotlib.pyplot.subplot() function, you can create sophisticated data visualizations that effectively communicate your insights. Remember to follow best practices, such as maintaining consistent styling, using appropriate labels and legends, and considering the overall layout of your subplots.