Comprehensive Guide to Matplotlib.pyplot.figimage() Function in Python
Matplotlib.pyplot.figimage() function in Python is a powerful tool for adding images directly to the figure canvas in Matplotlib. This function allows you to place images on the figure without using an axes object, providing flexibility in image placement and manipulation. In this comprehensive guide, we’ll explore the Matplotlib.pyplot.figimage() function in depth, covering its syntax, parameters, and various use cases with practical examples.
Understanding the Basics of Matplotlib.pyplot.figimage()
The Matplotlib.pyplot.figimage() function is part of the pyplot module in Matplotlib. It’s used to add images to the figure canvas, which is the entire drawing area of a figure. This function is particularly useful when you want to add background images, watermarks, or any other image that doesn’t need to be associated with specific data coordinates.
Let’s start with a basic example of how to use Matplotlib.pyplot.figimage():
import matplotlib.pyplot as plt
import numpy as np

# Create a simple image
image = np.random.rand(20, 20)

# Create a figure
fig = plt.figure()

# Add the image to the figure canvas
plt.figimage(image, cmap='viridis')

# Add a title with how2matplotlib.com
plt.title('Basic Figimage Example - how2matplotlib.com')

plt.show()
Output:
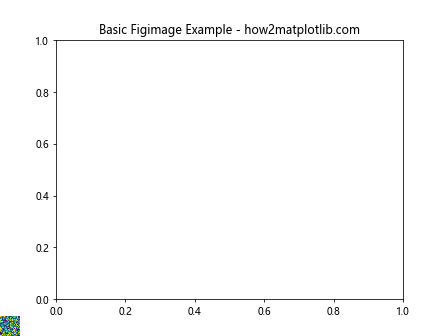
In this example, we create a random 20×20 image using NumPy and add it to the figure canvas using Matplotlib.pyplot.figimage(). The ‘viridis’ colormap is applied to the image for better visualization.
Syntax and Parameters of Matplotlib.pyplot.figimage()
The Matplotlib.pyplot.figimage() function has the following syntax:
matplotlib.pyplot.figimage(X, xo=0, yo=0, alpha=None, norm=None, cmap=None, vmin=None, vmax=None, origin=None, resize=False, **kwargs)
Let’s break down the parameters:
- X: The image data. It can be a 2D array (grayscale) or a 3D array (RGB).
- xo, yo: The x and y offsets in pixels from the bottom-left corner of the figure.
- alpha: The alpha blending value, between 0 (transparent) and 1 (opaque).
- norm: A Normalize instance to map the image data to the [0, 1] range.
- cmap: A colormap instance or registered colormap name.
- vmin, vmax: Used for scaling the luminance data.
- origin: The origin of the image. Options are ‘upper’ or ‘lower’.
- resize: If True, resize the figure to match the given image size.
Now, let’s see an example that demonstrates some of these parameters:
import matplotlib.pyplot as plt
import numpy as np

# Create a larger image
image = np.random.rand(100, 100)

fig = plt.figure(figsize=(8, 6))

# Add the image with custom position and alpha
plt.figimage(image, xo=100, yo=100, alpha=0.7, cmap='plasma')

plt.title('Customized Figimage - how2matplotlib.com')
plt.show()
Output:
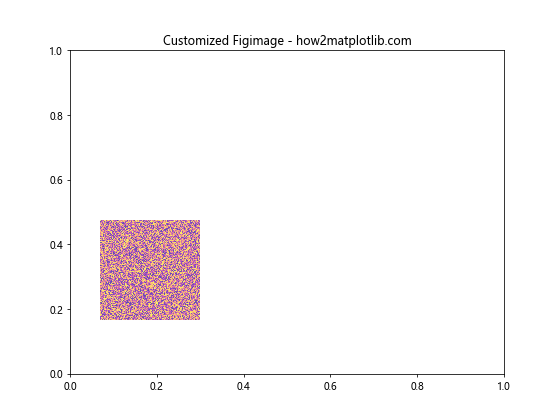
In this example, we create a larger 100×100 image and place it at (100, 100) pixels from the bottom-left corner of the figure. We also set the alpha value to 0.7 for partial transparency and use the ‘plasma’ colormap.
Adding Multiple Images with Matplotlib.pyplot.figimage()
One of the advantages of Matplotlib.pyplot.figimage() is that you can add multiple images to the same figure canvas. This is useful for creating complex layouts or overlaying images.
Here’s an example of adding multiple images:
import matplotlib.pyplot as plt
import numpy as np

# Create two different images
image1 = np.random.rand(50, 50)
image2 = np.random.rand(30, 30)

fig = plt.figure(figsize=(10, 8))

# Add the first image
plt.figimage(image1, xo=50, yo=50, cmap='viridis')

# Add the second image
plt.figimage(image2, xo=200, yo=200, cmap='plasma')

plt.title('Multiple Images with Figimage - how2matplotlib.com')
plt.show()
Output:
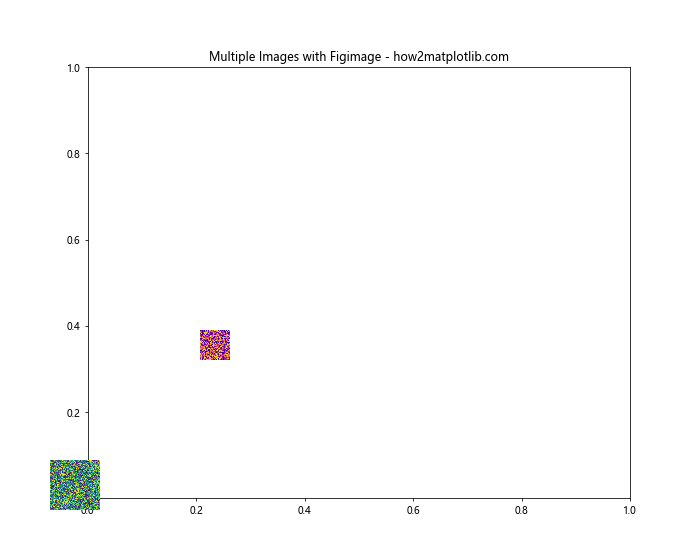
In this example, we create two different-sized images and add them to the figure canvas at different positions. This demonstrates how Matplotlib.pyplot.figimage() can be used to create complex image compositions.
Using Matplotlib.pyplot.figimage() with RGB Images
While we’ve been working with grayscale images so far, Matplotlib.pyplot.figimage() can also handle RGB images. Let’s see how to add a color image to the figure canvas:
import matplotlib.pyplot as plt
import numpy as np

# Create an RGB image
rgb_image = np.random.rand(100, 100, 3)

fig = plt.figure(figsize=(8, 6))

# Add the RGB image to the figure canvas
plt.figimage(rgb_image)

plt.title('RGB Image with Figimage - how2matplotlib.com')
plt.show()
Output:
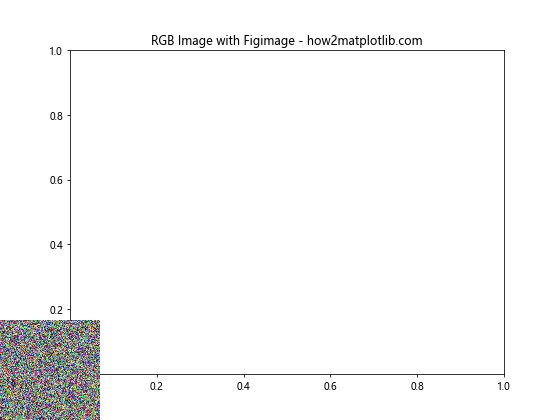
In this example, we create a 100x100x3 array representing an RGB image and add it to the figure canvas. Note that when using RGB images, you don’t need to specify a colormap.
Resizing the Figure to Match the Image
Sometimes, you might want the figure size to match the image size exactly. The Matplotlib.pyplot.figimage() function provides a resize parameter for this purpose:
import matplotlib.pyplot as plt
import numpy as np

# Create an image
image = np.random.rand(200, 300)

# Create a figure (size doesn't matter as we'll resize it)
fig = plt.figure()

# Add the image and resize the figure to match
plt.figimage(image, resize=True, cmap='coolwarm')

plt.title('Resized Figure with Figimage - how2matplotlib.com')
plt.show()
Output:
In this example, we create a 200×300 image and add it to the figure canvas. By setting resize=True, the figure is automatically resized to match the image dimensions.
Combining Matplotlib.pyplot.figimage() with Other Plot Elements
While Matplotlib.pyplot.figimage() adds images directly to the figure canvas, you can still combine these images with other plot elements. Let’s see an example that combines a figimage with a regular plot:
import matplotlib.pyplot as plt
import numpy as np

# Create an image for the background
background = np.random.rand(500, 500)

# Create some data for plotting
x = np.linspace(0, 10, 100)
y = np.sin(x)

# Create a figure and add the background image
fig = plt.figure(figsize=(10, 8))
plt.figimage(background, alpha=0.3, cmap='gray')

# Add a subplot and plot the data
ax = fig.add_subplot(111)
ax.plot(x, y, color='red', linewidth=2)

plt.title('Figimage with Plot Overlay - how2matplotlib.com')
plt.show()
Output:
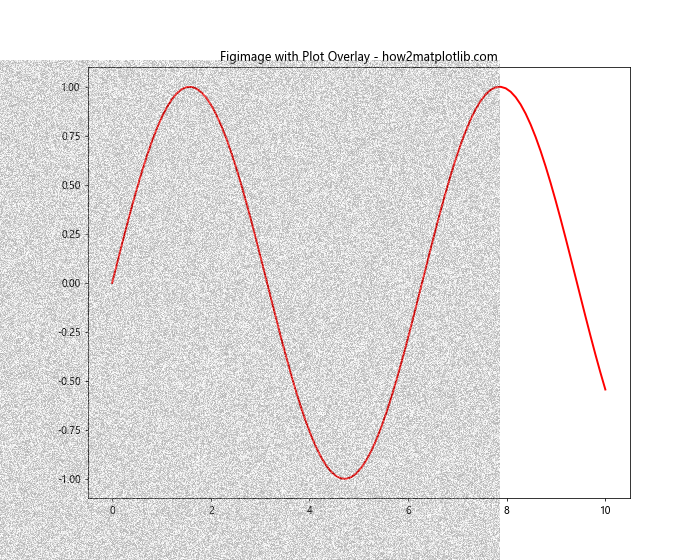
In this example, we first add a background image using Matplotlib.pyplot.figimage() with low opacity. Then, we add a subplot and plot a sine wave on top of the background image. This demonstrates how figimage can be used to create layered visualizations.
Using Matplotlib.pyplot.figimage() for Watermarks
Matplotlib.pyplot.figimage() is particularly useful for adding watermarks to plots. Here’s an example of how to add a text watermark using figimage:
import matplotlib.pyplot as plt
import numpy as np
from PIL import Image, ImageDraw, ImageFont

# Create a plot
x = np.linspace(0, 10, 100)
y = np.sin(x)

fig, ax = plt.subplots(figsize=(10, 6))
ax.plot(x, y)

# Create a watermark image
watermark = Image.new('RGBA', (300, 50), (255, 255, 255, 0))
draw = ImageDraw.Draw(watermark)
font = ImageFont.truetype("arial.ttf", 40)
draw.text((10, 10), "how2matplotlib.com", font=font, fill=(128, 128, 128, 128))

# Convert PIL Image to numpy array
watermark_array = np.array(watermark)

# Add the watermark to the figure
plt.figimage(watermark_array, xo=100, yo=50, alpha=0.5, zorder=3)

plt.title('Plot with Watermark using Figimage')
plt.show()
Output:
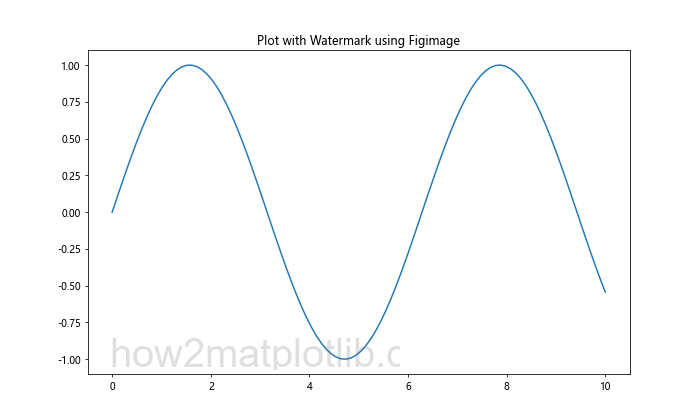
In this example, we create a plot and then add a text watermark using Matplotlib.pyplot.figimage(). The watermark is created as a PIL Image, converted to a numpy array, and then added to the figure canvas.
Animating Images with Matplotlib.pyplot.figimage()
Matplotlib.pyplot.figimage() can also be used in animations. Here’s an example of how to create a simple animation using figimage:
import matplotlib.pyplot as plt
import numpy as np
from matplotlib.animation import FuncAnimation

# Create a figure
fig = plt.figure(figsize=(8, 6))

# Initialize an empty image
image = np.zeros((100, 100))

# Function to update the image
def update(frame):
    global image
    image = np.random.rand(100, 100)
    plt.clf()  # Clear the current figure
    plt.figimage(image, cmap='viridis')
    plt.title(f'Animated Figimage - Frame {frame} - how2matplotlib.com')

# Create the animation
anim = FuncAnimation(fig, update, frames=50, interval=100)

plt.show()
In this example, we create an animation where each frame displays a new random image using Matplotlib.pyplot.figimage(). The update function is called for each frame, generating a new image and updating the figure.
Applying Image Transformations with Matplotlib.pyplot.figimage()
Matplotlib.pyplot.figimage() allows you to apply various transformations to the image before displaying it. Here’s an example of how to flip and rotate an image:
import matplotlib.pyplot as plt
import numpy as np

# Create an image
image = np.random.rand(100, 100)

fig = plt.figure(figsize=(12, 4))

# Original image
plt.subplot(131)
plt.figimage(image, cmap='viridis')
plt.title('Original - how2matplotlib.com')

# Flipped image
plt.subplot(132)
plt.figimage(np.flipud(image), cmap='viridis')
plt.title('Flipped - how2matplotlib.com')

# Rotated image
plt.subplot(133)
plt.figimage(np.rot90(image), cmap='viridis')
plt.title('Rotated - how2matplotlib.com')

plt.show()
Output:
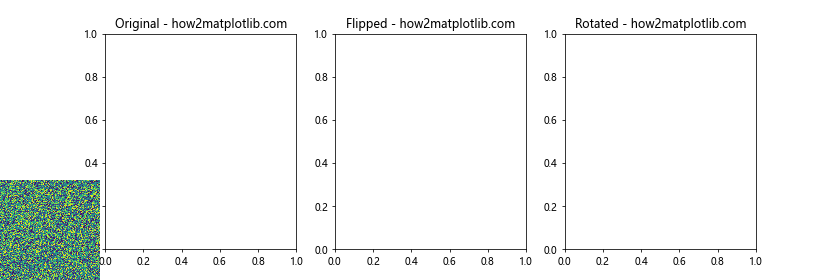
In this example, we create three subplots: one with the original image, one with a vertically flipped image (using np.flipud()), and one with a 90-degree rotated image (using np.rot90()).
Using Matplotlib.pyplot.figimage() with Different Color Spaces
Matplotlib.pyplot.figimage() can handle images in different color spaces. Here’s an example of how to display images in RGB and HSV color spaces:
import matplotlib.pyplot as plt
import numpy as np
from matplotlib.colors import hsv_to_rgb

# Create an RGB image
rgb_image = np.random.rand(100, 100, 3)

# Create an HSV image and convert to RGB
h = np.random.rand(100, 100)
s = np.ones((100, 100))
v = np.ones((100, 100))
hsv_image = np.dstack((h, s, v))
rgb_from_hsv = hsv_to_rgb(hsv_image)

fig = plt.figure(figsize=(10, 5))

# Display RGB image
plt.subplot(121)
plt.figimage(rgb_image)
plt.title('RGB Image - how2matplotlib.com')

# Display HSV image (converted to RGB)
plt.subplot(122)
plt.figimage(rgb_from_hsv)
plt.title('HSV Image - how2matplotlib.com')

plt.show()
Output:
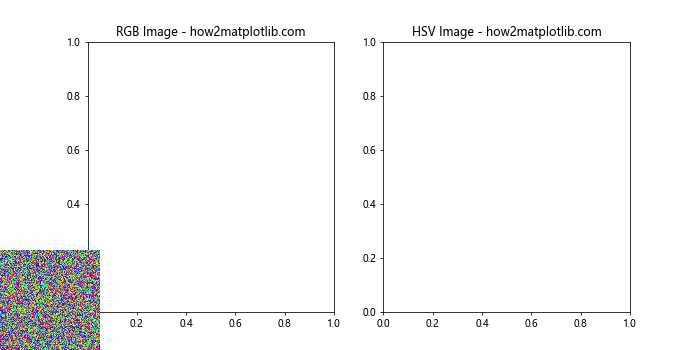
In this example, we create an RGB image directly and an HSV image that we convert to RGB before displaying. This demonstrates how Matplotlib.pyplot.figimage() can work with different color representations.
Combining Matplotlib.pyplot.figimage() with Subplots
While Matplotlib.pyplot.figimage() adds images to the figure canvas, it can be used in conjunction with subplots. Here’s an example that demonstrates this:
import matplotlib.pyplot as plt
import numpy as np

# Create some data
x = np.linspace(0, 10, 100)
y1 = np.sin(x)
y2 = np.cos(x)

# Create an image
image = np.random.rand(50, 50)

fig = plt.figure(figsize=(12, 6))

# Add subplots
ax1 = fig.add_subplot(121)
ax1.plot(x, y1)
ax1.set_title('Sine Wave - how2matplotlib.com')

ax2 = fig.add_subplot(122)
ax2.plot(x, y2)
ax2.set_title('Cosine Wave - how2matplotlib.com')

# Add image to the figure canvas
plt.figimage(image, xo=50, yo=50, cmap='viridis', alpha=0.5)

plt.show()
Output:
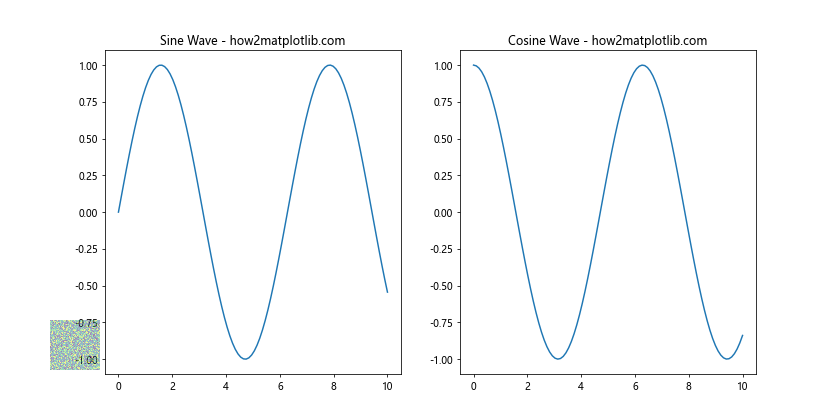
In this example, we create two subplots with line plots, and then add an image to the figure canvas using Matplotlib.pyplot.figimage(). The image appears as an overlay on top of the subplots.
Using Matplotlib.pyplot.figimage() for Image Composition
Matplotlib.pyplot.figimage() can be used to create complex image compositions. Here’s an example that creates a collage of images:
import matplotlib.pyplot as plt
import numpy as np

# Create multiple images
image1 = np.random.rand(100, 100)
image2 = np.random.rand(100, 100)
image3 = np.random.rand(100, 100)
image4 = np.random.rand(100, 100)

fig = plt.figure(figsize=(10, 10))

# Add images to create a collage
plt.figimage(image1, xo=0, yo=0, cmap='viridis')
plt.figimage(image2, xo=100, yo=0, cmap='plasma')
plt.figimage(image3, xo=0, yo=100, cmap='inferno')
plt.figimage(image4, xo=100, yo=100, cmap='magma')

plt.title('Image Collage with Figimage - how2matplotlib.com')
plt.show()
Output:
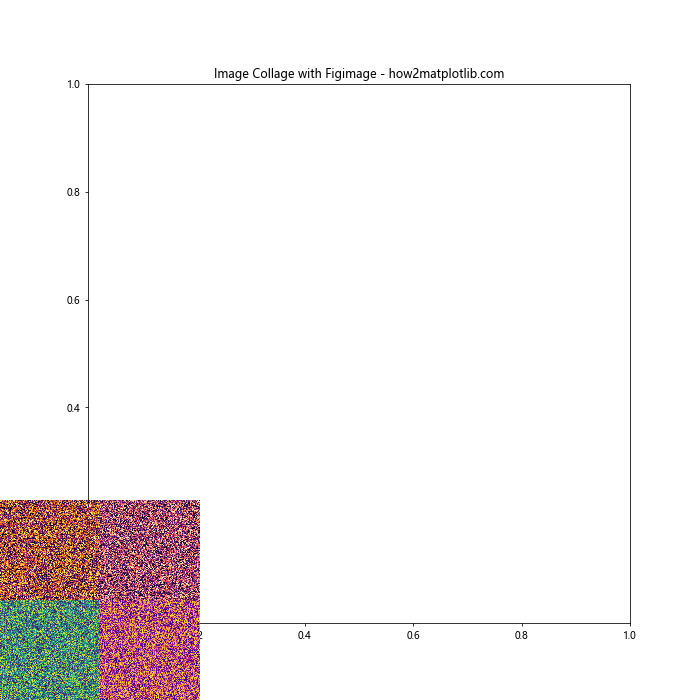
In this example, we create four different images and position them to form a 2×2 grid, creating a collage effect. Each image is given a different colormap for visual distinction.
Conclusion
The Matplotlib.pyplot.figimage() function is a versatile tool in the Matplotlib library, offering a unique way to add images directly to the figure canvas. Throughout this comprehensive guide, we’ve explored various aspectsof this function, from basic usage to more advanced applications.
We’ve seen how Matplotlib.pyplot.figimage() can be used to:
- Add single or multiple images to a figure
- Work with grayscale and RGB images
- Resize figures to match image dimensions
- Combine images with other plot elements
- Create watermarks and overlays
- Animate image sequences
- Load and display image files
- Apply image transformations
- Handle different color spaces
- Create complex image compositions
The flexibility of Matplotlib.pyplot.figimage() makes it a powerful tool for a wide range of visualization tasks. Whether you’re adding background images to plots, creating watermarks, or designing complex image layouts, this function provides the capabilities you need.
As with any Matplotlib function, it’s important to experiment and combine Matplotlib.pyplot.figimage() with other Matplotlib features to achieve your desired visualizations. The examples provided in this guide serve as a starting point, and you can build upon them to create more complex and customized visualizations.
Remember that while Matplotlib.pyplot.figimage() adds images directly to the figure canvas, it can still be used in conjunction with other Matplotlib elements like subplots, text annotations, and more. This allows for great flexibility in creating rich, informative visualizations.
When using Matplotlib.pyplot.figimage(), keep in mind the following tips:
- Pay attention to image positioning using the
xoandyoparameters to avoid overlapping with other plot elements. - Use the
alphaparameter to control image transparency when overlaying images or combining them with plots. - Experiment with different colormaps to enhance the visual appeal of your images.
- Consider using the
resizeparameter when you want the figure size to match the image size exactly. - Remember that figimage works with the pixel coordinates of the figure, which can be different from data coordinates used in regular plots.
As you continue to work with Matplotlib.pyplot.figimage(), you’ll discover even more ways to leverage its capabilities for your specific visualization needs. Whether you’re creating scientific visualizations, data presentations, or artistic compositions, Matplotlib.pyplot.figimage() is a valuable tool in your Matplotlib toolkit.
Advanced Topics with Matplotlib.pyplot.figimage()
Using Matplotlib.pyplot.figimage() with Custom Normalization
While we’ve used the default normalization in our previous examples, Matplotlib.pyplot.figimage() allows for custom normalization of image data. This can be particularly useful when dealing with images that have a wide range of values or when you want to emphasize certain parts of the image.
Here’s an example demonstrating custom normalization:
import matplotlib.pyplot as plt
import numpy as np
from matplotlib.colors import Normalize

# Create an image with a wide range of values
image = np.random.exponential(1, size=(100, 100))

fig, (ax1, ax2) = plt.subplots(1, 2, figsize=(12, 6))

# Default normalization
ax1.set_title('Default Normalization - how2matplotlib.com')
fig.figimage(image, xo=50, yo=50, cmap='viridis')

# Custom normalization
norm = Normalize(vmin=0, vmax=5)
ax2.set_title('Custom Normalization - how2matplotlib.com')
fig.figimage(image, xo=350, yo=50, cmap='viridis', norm=norm)

plt.show()
Output:
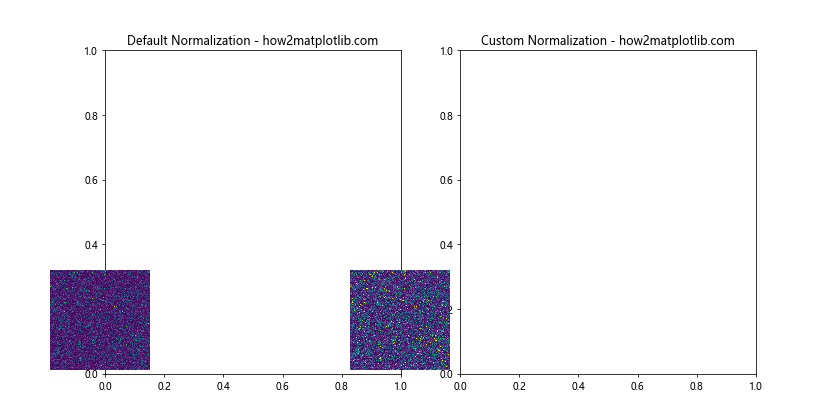
In this example, we create an image with exponentially distributed values. We then display it twice: once with default normalization and once with custom normalization that caps the maximum value at 5. This demonstrates how custom normalization can be used to control the visual representation of the image.
Combining Matplotlib.pyplot.figimage() with Masks
Matplotlib.pyplot.figimage() can be combined with masks to create interesting visual effects. Here’s an example that uses a mask to create a circular image:
import matplotlib.pyplot as plt
import numpy as np

# Create an image
image = np.random.rand(200, 200)

# Create a circular mask
y, x = np.ogrid[-100:100, -100:100]
mask = x*x + y*y <= 100*100

# Apply the mask
masked_image = np.ma.array(image, mask=~mask)

fig = plt.figure(figsize=(8, 8))

# Display the masked image
plt.figimage(masked_image, cmap='viridis')

plt.title('Circular Image with Figimage - how2matplotlib.com')
plt.show()
Output:
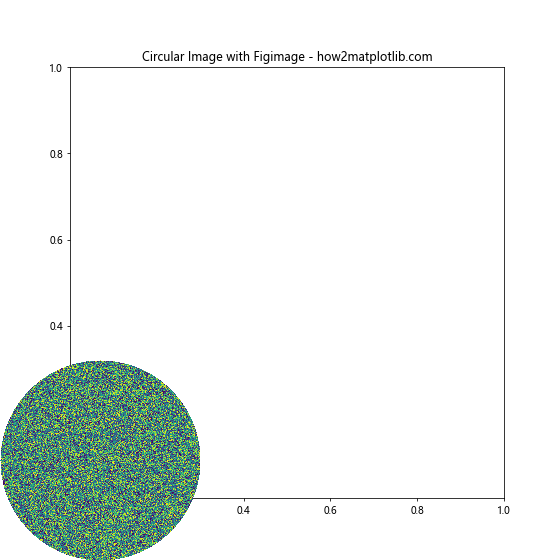
In this example, we create a circular mask and apply it to our image before displaying it with Matplotlib.pyplot.figimage(). This results in a circular image being displayed on the figure canvas.
Using Matplotlib.pyplot.figimage() for Image Filtering
Matplotlib.pyplot.figimage() can be used to display the results of image filtering operations. Here's an example that applies a simple blur filter to an image:
import matplotlib.pyplot as plt
import numpy as np
from scipy.ndimage import gaussian_filter

# Create an image
image = np.random.rand(100, 100)

# Apply Gaussian blur
blurred_image = gaussian_filter(image, sigma=3)

fig, (ax1, ax2) = plt.subplots(1, 2, figsize=(12, 6))

# Display original image
ax1.set_title('Original Image - how2matplotlib.com')
fig.figimage(image, xo=50, yo=50, cmap='viridis')

# Display blurred image
ax2.set_title('Blurred Image - how2matplotlib.com')
fig.figimage(blurred_image, xo=350, yo=50, cmap='viridis')

plt.show()
Output:
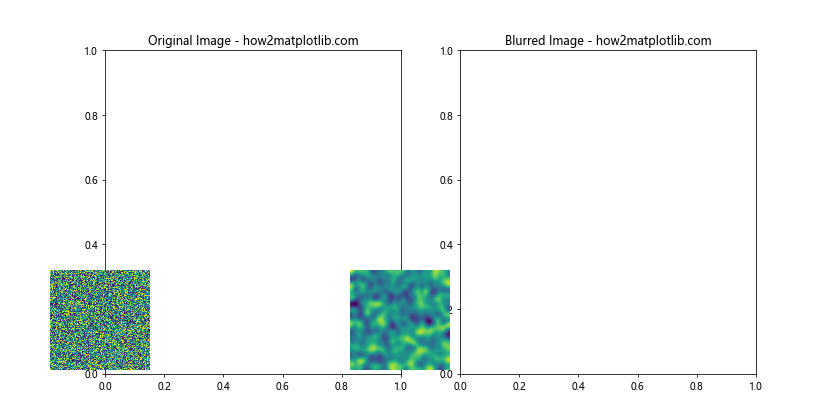
In this example, we create an image, apply a Gaussian blur filter to it, and then display both the original and blurred images using Matplotlib.pyplot.figimage(). This demonstrates how figimage can be used to visualize the results of image processing operations.
Creating a Heatmap with Matplotlib.pyplot.figimage()
While Matplotlib has specific functions for creating heatmaps, Matplotlib.pyplot.figimage() can also be used for this purpose. Here's an example:
import matplotlib.pyplot as plt
import numpy as np

# Create some data for the heatmap
data = np.random.rand(20, 20)

fig = plt.figure(figsize=(8, 8))

# Display the heatmap
plt.figimage(data, cmap='hot', extent=[0, 1, 0, 1])

plt.title('Heatmap with Figimage - how2matplotlib.com')
plt.colorbar()
plt.show()
In this example, we create a 20x20 array of random data and display it as a heatmap using Matplotlib.pyplot.figimage(). The 'hot' colormap is used to give it a typical heatmap appearance, and we add a colorbar to show the value scale.
Using Matplotlib.pyplot.figimage() with Image Gradients
Matplotlib.pyplot.figimage() can be used to visualize image gradients, which can be useful in image processing and computer vision tasks. Here's an example:
import matplotlib.pyplot as plt
import numpy as np

# Create an image
image = np.random.rand(100, 100)

# Compute gradients
gy, gx = np.gradient(image)
gradient_magnitude = np.sqrt(gx**2 + gy**2)

fig, (ax1, ax2) = plt.subplots(1, 2, figsize=(12, 6))

# Display original image
ax1.set_title('Original Image - how2matplotlib.com')
fig.figimage(image, xo=50, yo=50, cmap='gray')

# Display gradient magnitude
ax2.set_title('Gradient Magnitude - how2matplotlib.com')
fig.figimage(gradient_magnitude, xo=350, yo=50, cmap='viridis')

plt.show()
Output:
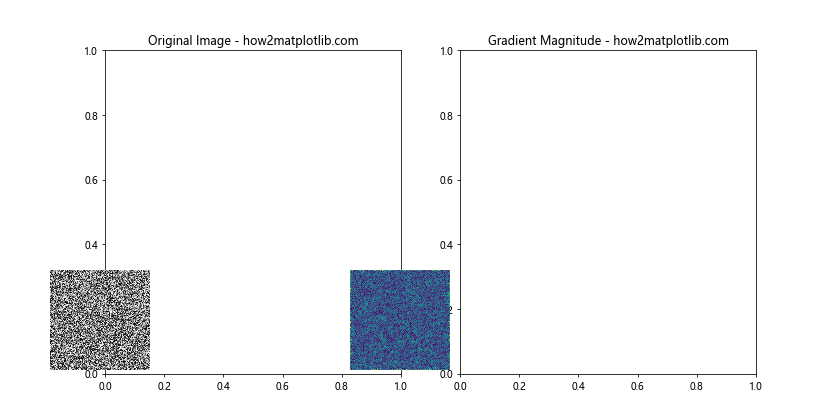
In this example, we create an image, compute its gradient using NumPy's gradient function, and then visualize both the original image and the gradient magnitude using Matplotlib.pyplot.figimage().
Final Thoughts on Matplotlib.pyplot.figimage()
As we've seen throughout this comprehensive guide, Matplotlib.pyplot.figimage() is a versatile and powerful function for adding images to Matplotlib figures. Its ability to work directly with the figure canvas provides unique opportunities for image placement and manipulation that complement Matplotlib's other plotting capabilities.
From simple image display to complex compositions, from basic plots to advanced visualizations, Matplotlib.pyplot.figimage() offers a wide range of possibilities. By combining it with other Matplotlib functions and Python's image processing capabilities, you can create rich, informative, and visually appealing graphics.