Comprehensive Guide to Matplotlib.axis.Axis.update_units() Function in Python
Matplotlib.axis.Axis.update_units() function in Python is a powerful tool for updating the units of an axis in Matplotlib plots. This function is essential for data visualization tasks where you need to dynamically change the units of your axes. In this comprehensive guide, we’ll explore the Matplotlib.axis.Axis.update_units() function in depth, covering its usage, parameters, and providing numerous examples to illustrate its functionality.
Understanding the Matplotlib.axis.Axis.update_units() Function
The Matplotlib.axis.Axis.update_units() function is a method of the Axis class in Matplotlib. Its primary purpose is to update the units of an axis based on the data being plotted. This function is particularly useful when dealing with data that has different units or when you need to change the units of an axis dynamically.
Let’s start with a basic example to demonstrate how to use the Matplotlib.axis.Axis.update_units() function:
import matplotlib.pyplot as plt
import numpy as np

# Create some sample data
x = np.linspace(0, 10, 100)
y = np.sin(x)

# Create a figure and axis
fig, ax = plt.subplots()

# Plot the data
line, = ax.plot(x, y)

# Update the x-axis units
ax.xaxis.update_units(x)

# Set the title
plt.title('How to use Matplotlib.axis.Axis.update_units() - how2matplotlib.com')

# Show the plot
plt.show()
Output:
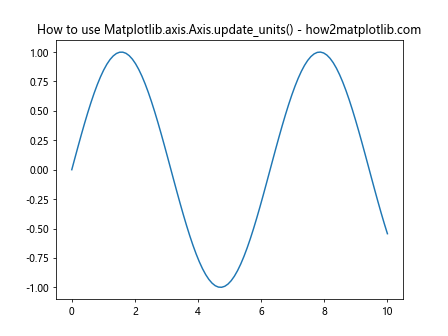
In this example, we create a simple sine wave plot and use the Matplotlib.axis.Axis.update_units() function to update the x-axis units based on the data in the ‘x’ array. This ensures that the x-axis units are appropriate for the data being plotted.
Parameters of Matplotlib.axis.Axis.update_units() Function
The Matplotlib.axis.Axis.update_units() function takes one parameter:
- data: The data to be used for updating the axis units.
Understanding this parameter is crucial for effectively using the Matplotlib.axis.Axis.update_units() function. Let’s explore it in more detail with an example:
import matplotlib.pyplot as plt
import numpy as np

# Create some sample data with different units
x = np.linspace(0, 10, 100) * 1000  # Convert to milliseconds
y = np.sin(x / 1000)  # Use original x values for calculation

# Create a figure and axis
fig, ax = plt.subplots()

# Plot the data
line, = ax.plot(x, y)

# Update the x-axis units
ax.xaxis.update_units(x)

# Set labels and title
ax.set_xlabel('Time (ms)')
ax.set_ylabel('Amplitude')
plt.title('Matplotlib.axis.Axis.update_units() with milliseconds - how2matplotlib.com')

# Show the plot
plt.show()
Output:
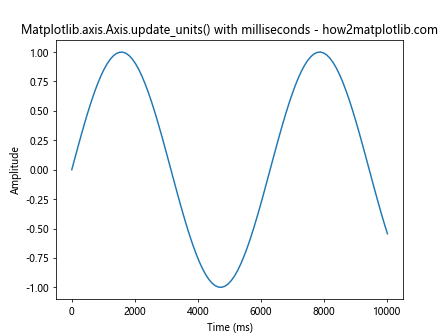
In this example, we multiply our x values by 1000 to convert them to milliseconds. By using Matplotlib.axis.Axis.update_units(x), we ensure that the x-axis units are updated to reflect this change in scale.
Use Cases for Matplotlib.axis.Axis.update_units() Function
The Matplotlib.axis.Axis.update_units() function is particularly useful in several scenarios:
- When dealing with data that has different units
- When dynamically changing the units of an axis
- When working with custom unit converters
Let’s explore each of these use cases with examples.
Dealing with Data That Has Different Units
When working with data that has different units, the Matplotlib.axis.Axis.update_units() function can help ensure that your axes are correctly scaled. Here’s an example:
import matplotlib.pyplot as plt
import numpy as np

# Create data with different units
time = np.linspace(0, 10, 100)  # seconds
distance = np.sin(time) * 1000  # meters

# Create a figure and axis
fig, ax = plt.subplots()

# Plot the data
line, = ax.plot(time, distance)

# Update the units for both axes
ax.xaxis.update_units(time)
ax.yaxis.update_units(distance)

# Set labels and title
ax.set_xlabel('Time (s)')
ax.set_ylabel('Distance (m)')
plt.title('Matplotlib.axis.Axis.update_units() with different units - how2matplotlib.com')

# Show the plot
plt.show()
Output:
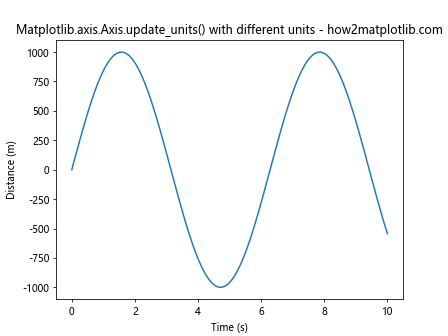
In this example, we have time data in seconds and distance data in meters. By using Matplotlib.axis.Axis.update_units() for both axes, we ensure that the units are correctly represented.
Working with Custom Unit Converters
The Matplotlib.axis.Axis.update_units() function can also be used with custom unit converters. This is particularly useful when dealing with non-standard units. Here’s an example:
import matplotlib.pyplot as plt
import numpy as np
from matplotlib import units

# Define a custom unit converter
class CustomUnitConverter:
    @staticmethod
    def convert(x, unit):
        return x * 2, 'custom_units'

# Register the custom unit converter
units.registry[CustomUnitConverter] = CustomUnitConverter()

# Create some sample data
x = np.linspace(0, 10, 100)
y = np.sin(x)

# Create a figure and axis
fig, ax = plt.subplots()

# Plot the data
line, = ax.plot(x, y)

# Update the x-axis units using the custom converter
ax.xaxis.update_units(CustomUnitConverter)

# Set labels and title
ax.set_xlabel('Custom Units')
ax.set_ylabel('Amplitude')
plt.title('Matplotlib.axis.Axis.update_units() with Custom Converter - how2matplotlib.com')

# Show the plot
plt.show()
Output:
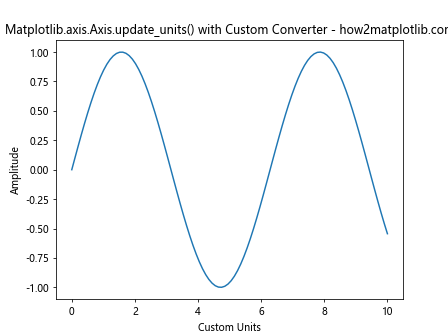
In this example, we define a custom unit converter that doubles the input values. We then use Matplotlib.axis.Axis.update_units() with this custom converter to update the x-axis units.
Advanced Usage of Matplotlib.axis.Axis.update_units() Function
Now that we’ve covered the basics, let’s explore some more advanced uses of the Matplotlib.axis.Axis.update_units() function.
Updating Units for Multiple Axes
When working with subplots or multiple axes, you may need to update units for several axes at once. Here’s how you can do that:
import matplotlib.pyplot as plt
import numpy as np

# Create sample data
x1 = np.linspace(0, 10, 100)
y1 = np.sin(x1)
x2 = np.linspace(0, 5, 100)
y2 = np.cos(x2)

# Create a figure with two subplots
fig, (ax1, ax2) = plt.subplots(2, 1, figsize=(8, 10))

# Plot data on both subplots
line1, = ax1.plot(x1, y1)
line2, = ax2.plot(x2, y2)

# Update units for both x-axes
ax1.xaxis.update_units(x1)
ax2.xaxis.update_units(x2)

# Set labels and titles
ax1.set_xlabel('Time (s)')
ax1.set_ylabel('Amplitude')
ax1.set_title('Subplot 1 - how2matplotlib.com')

ax2.set_xlabel('Time (s)')
ax2.set_ylabel('Amplitude')
ax2.set_title('Subplot 2 - how2matplotlib.com')

plt.tight_layout()
plt.show()
Output:
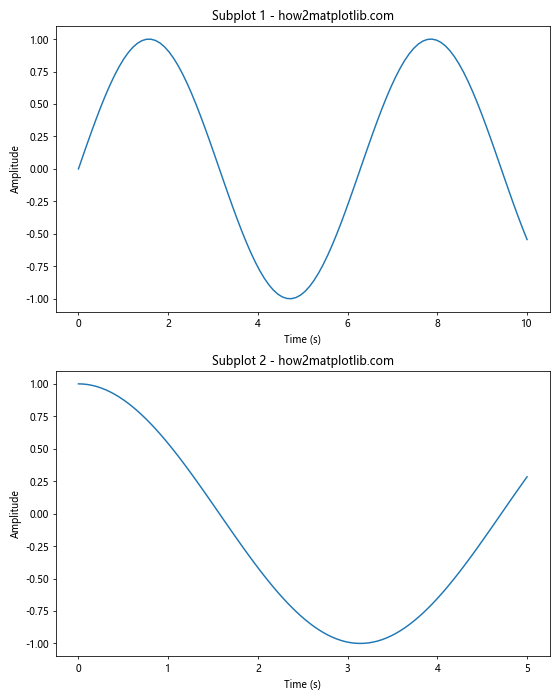
In this example, we create two subplots and use Matplotlib.axis.Axis.update_units() to update the x-axis units for both of them independently.
Updating Units with Date Data
The Matplotlib.axis.Axis.update_units() function can also be useful when working with date data. Here’s an example:
import matplotlib.pyplot as plt
import numpy as np
from datetime import datetime, timedelta

# Create date range
start_date = datetime(2023, 1, 1)
dates = [start_date + timedelta(days=i) for i in range(100)]

# Create some sample data
y = np.sin(np.linspace(0, 10, 100))

# Create a figure and axis
fig, ax = plt.subplots(figsize=(10, 6))

# Plot the data
line, = ax.plot(dates, y)

# Update the x-axis units
ax.xaxis.update_units(dates)

# Set labels and title
ax.set_xlabel('Date')
ax.set_ylabel('Value')
plt.title('Matplotlib.axis.Axis.update_units() with Date Data - how2matplotlib.com')

# Rotate and align the tick labels so they look better
fig.autofmt_xdate()

# Show the plot
plt.show()
Output:
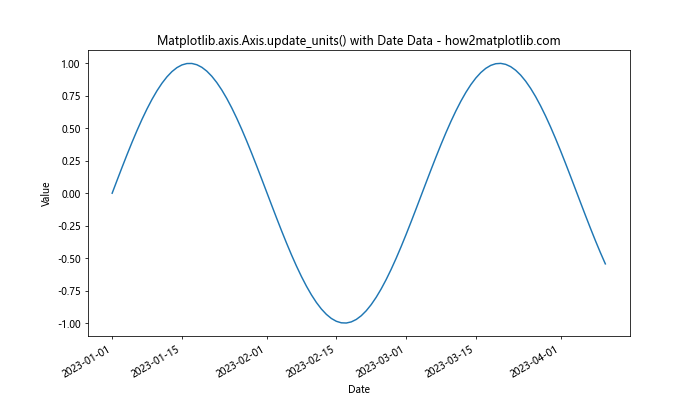
In this example, we use date data for the x-axis and use Matplotlib.axis.Axis.update_units() to ensure that the axis is correctly formatted for dates.
Updating Units with Categorical Data
The Matplotlib.axis.Axis.update_units() function can also be used with categorical data. Here’s an example:
import matplotlib.pyplot as plt
import numpy as np

# Create categorical data
categories = ['A', 'B', 'C', 'D', 'E']
values = np.random.rand(5)

# Create a figure and axis
fig, ax = plt.subplots(figsize=(8, 6))

# Create a bar plot
bars = ax.bar(categories, values)

# Update the x-axis units
ax.xaxis.update_units(categories)

# Set labels and title
ax.set_xlabel('Categories')
ax.set_ylabel('Values')
plt.title('Matplotlib.axis.Axis.update_units() with Categorical Data - how2matplotlib.com')

# Show the plot
plt.show()
Output:
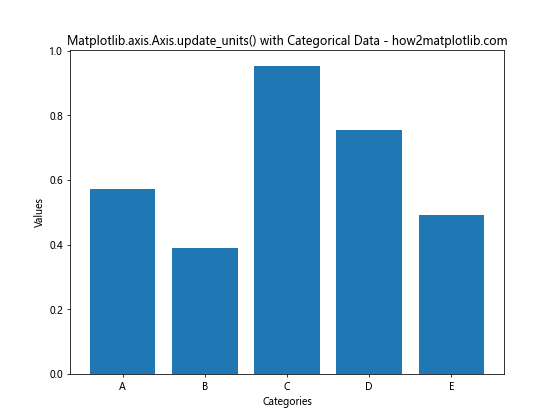
In this example, we use categorical data for the x-axis and use Matplotlib.axis.Axis.update_units() to ensure that the axis is correctly formatted for categories.
Common Pitfalls and How to Avoid Them
While the Matplotlib.axis.Axis.update_units() function is powerful, there are some common pitfalls to be aware of:
- Forgetting to update units after changing data
- Using incompatible units
- Not considering the impact on other plot elements
Let’s address each of these pitfalls with examples and solutions.
Forgetting to Update Units After Changing Data
One common mistake is forgetting to call Matplotlib.axis.Axis.update_units() after changing the data. Here’s an example of how this can lead to incorrect axis scaling:
import matplotlib.pyplot as plt
import numpy as np

# Create initial data
x = np.linspace(0, 10, 100)
y = np.sin(x)

# Create a figure and axis
fig, ax = plt.subplots()

# Plot the initial data
line, = ax.plot(x, y)

# Set initial labels and title
ax.set_xlabel('Time (s)')
ax.set_ylabel('Amplitude')
plt.title('Forgetting to Update Units - how2matplotlib.com')

# Show the initial plot
plt.show()

# Now, let's change the data without updating units
x_new = x * 1000  # Convert to milliseconds
y_new = np.sin(x_new / 1000)

# Update the plot data
line.set_data(x_new, y_new)

# Redraw the plot without updating units
fig.canvas.draw()

# Show the updated plot
plt.show()
In this example, we change the x-axis data to milliseconds but forget to update the units. This results in an incorrectly scaled x-axis. To fix this, we should call ax.xaxis.update_units(x_new) after changing the data.
Using Incompatible Units
Another pitfall is trying to use incompatible units. Here’s an example:
import matplotlib.pyplot as plt
import numpy as np

# Create data with incompatible units
x = np.linspace(0, 10, 100)
y = np.sin(x)

# Create a figure and axis
fig, ax = plt.subplots()

# Plot the data
line, = ax.plot(x, y)

# Try to update x-axis units with y data (incompatible)
ax.xaxis.update_units(y)

# Set labels and title
ax.set_xlabel('Time')
ax.set_ylabel('Amplitude')
plt.title('Using Incompatible Units - how2matplotlib.com')

# Show the plot
plt.show()
Output:
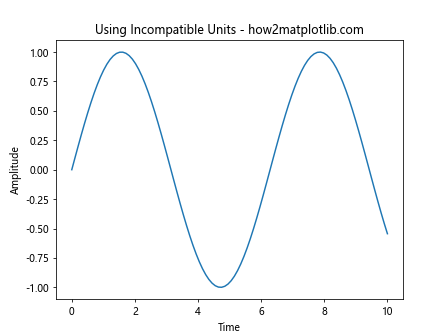
In this example, we try to update the x-axis units with y-axis data, which are incompatible. To avoid this, always ensure that you’re using compatible data when calling Matplotlib.axis.Axis.update_units().
Best Practices for Using Matplotlib.axis.Axis.update_units() Function
To make the most of the Matplotlib.axis.Axis.update_units() function, here are some best practices to follow:
- Use appropriate data types for unit conversion
- Consider the impact on other plot elements
- Combine with other Matplotlib functions for enhanced functionality
Let’s explore each of these best practices with examples.
Use Appropriate Data Types for Unit Conversion
When using Matplotlib.axis.Axis.update_units(), it’s important to use appropriate data types. Here’s an example using NumPy arrays:
import matplotlib.pyplot as plt
import numpy as np

# Create data using NumPy arrays
x = np.linspace(0, 10, 100)
y = np.sin(x)

# Create a figure and axis
fig, ax = plt.subplots()

# Plot the data
line, = ax.plot(x, y)

# Update the x-axis units
ax.xaxis.update_units(x)

# Set labels and title
ax.set_xlabel('Time (s)')
ax.set_ylabel('Amplitude')
plt.title('Using NumPy Arrays with update_units() - how2matplotlib.com')

# Show the plot
plt.show()
Output:
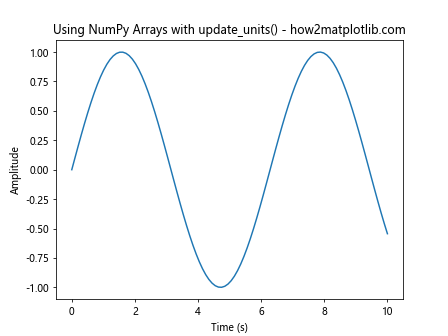
In this example, we use NumPy arrays for our data, which work well with Matplotlib.axis.Axis.update_units().
Combine with Other Matplotlib Functions for Enhanced Functionality
The Matplotlib.axis.Axis.update_units() function can be combined with other Matplotlib functions for enhanced functionality. Here’s an example that combines it with axis formatting:
import matplotlib.pyplot as plt
import numpy as np

# Create data
x = np.linspace(0, 10, 100)
y = np.sin(x)

# Create a figure and axis
fig, ax = plt.subplots()

# Plot the data
line, = ax.plot(x, y)

# Update the x-axis units
ax.xaxis.update_units(x)

# Format the x-axis
ax.xaxis.set_major_locator(plt.MultipleLocator(2))
ax.xaxis.set_minor_locator(plt.MultipleLocator(0.5))

# Set labels and title
ax.set_xlabel('Time (s)')
ax.set_ylabel('Amplitude')
plt.title('Combining update_units() with Axis Formatting - how2matplotlib.com')

# Show the plot
plt.show()
Output:
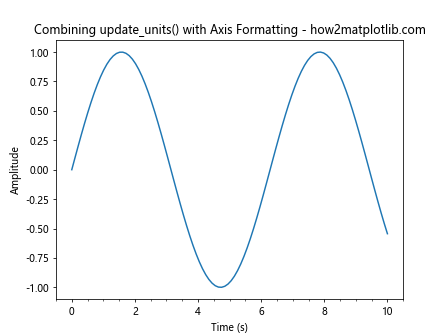
In this example, we combine Matplotlib.axis.Axis.update_units() with axis formatting functions to create a more customized plot.
Troubleshooting Common Issues with Matplotlib.axis.Axis.update_units()
When working with the Matplotlib.axis.Axis.update_units() function, you might encounter some issues. Here are some common problems and how to solve them:
Issue 1: Incorrect Scale After Updating Units
Sometimes, you might find that your axis scale is incorrect after updating units. This can often be solved by manually setting the axis limits:
import matplotlib.pyplot as plt
import numpy as np

# Create data
x = np.linspace(0, 10, 100)
y = np.sin(x)

# Create a figure and axis
fig, ax = plt.subplots()

# Plot the data
line, = ax.plot(x, y)

# Update the x-axis units
ax.xaxis.update_units(x)

# Manually set the x-axis limits
ax.set_xlim(0, 10)

# Set labels and title
ax.set_xlabel('Time (s)')
ax.set_ylabel('Amplitude')
plt.title('Solving Incorrect Scale Issue - how2matplotlib.com')

# Show the plot
plt.show()
Output:
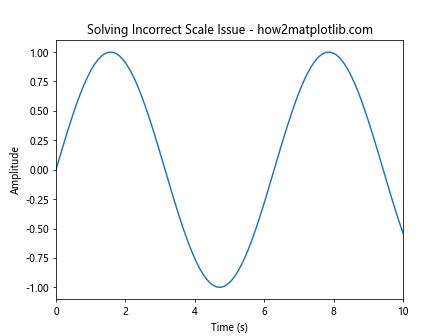
In this example, we manually set the x-axis limits after updating the units to ensure the correct scale.
Issue 3: Units Not Displaying Correctly
If your units are not displaying correctly after using Matplotlib.axis.Axis.update_units(), you might need to manually set the formatter:
import matplotlib.pyplot as plt
import numpy as np
from matplotlib.ticker import FuncFormatter

# Create data
x = np.linspace(0, 10, 100)
y = np.sin(x)

# Create a figure and axis
fig, ax = plt.subplots()

# Plot the data
line, = ax.plot(x, y)

# Update the x-axis units
ax.xaxis.update_units(x)

# Define a custom formatter
def custom_formatter(x, pos):
    return f'{x:.2f} s'

# Set the custom formatter
ax.xaxis.set_major_formatter(FuncFormatter(custom_formatter))

# Set labels and title
ax.set_xlabel('Time')
ax.set_ylabel('Amplitude')
plt.title('Solving Units Display Issue - how2matplotlib.com')

# Show the plot
plt.show()
Output:
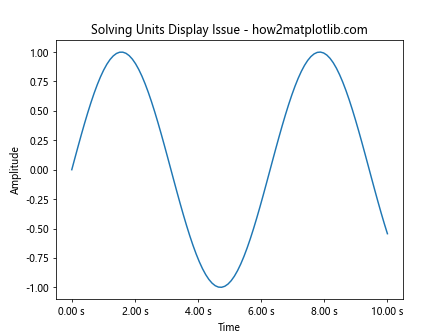
In this example, we define a custom formatter and apply it to the x-axis to ensure that the units are displayed correctly.
Advanced Topics Related to Matplotlib.axis.Axis.update_units()
Now that we’ve covered the basics and some common issues, let’s explore some advanced topics related to the Matplotlib.axis.Axis.update_units() function.
Working with Multiple Unit Systems
Sometimes, you might need to work with multiple unit systems in the same plot. Here’s how you can handle this using Matplotlib.axis.Axis.update_units():
import matplotlib.pyplot as plt
import numpy as np

# Create data
x = np.linspace(0, 10, 100)
y1 = np.sin(x)
y2 = np.cos(x) * 100  # Different scale

# Create a figure and two y-axes
fig, ax1 = plt.subplots()
ax2 = ax1.twinx()

# Plot the data
line1, = ax1.plot(x, y1, 'b-', label='sin(x)')
line2, = ax2.plot(x, y2, 'r-', label='cos(x) * 100')

# Update units for all axes
ax1.xaxis.update_units(x)
ax1.yaxis.update_units(y1)
ax2.yaxis.update_units(y2)

# Set labels and title
ax1.set_xlabel('Time (s)')
ax1.set_ylabel('Amplitude', color='b')
ax2.set_ylabel('Scaled Amplitude', color='r')
plt.title('Multiple Unit Systems - how2matplotlib.com')

# Add legend
lines = [line1, line2]
labels = [l.get_label() for l in lines]
ax1.legend(lines, labels, loc='upper left')

# Show the plot
plt.show()
Output:
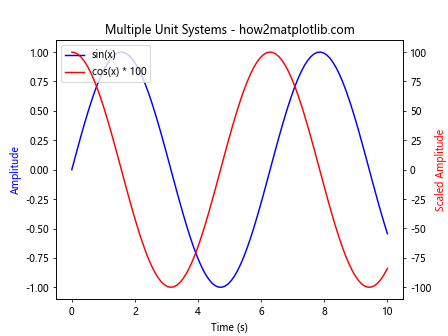
In this example, we create a plot with two y-axes, each with its own unit system. We use Matplotlib.axis.Axis.update_units() for each axis to ensure correct scaling.
Creating Custom Unit Converters
For more complex unit conversions, you might need to create custom unit converters. Here’s an example:
import matplotlib.pyplot as plt
import numpy as np
from matplotlib import units

# Define a custom unit converter
class TemperatureConverter:
    @staticmethod
    def convert(value, unit):
        if unit == 'C':
            return value, 'C'
        elif unit == 'F':
            return (value - 32) * 5/9, 'C'
        else:
            raise ValueError("Unsupported unit")

# Register the custom converter
units.registry[TemperatureConverter] = TemperatureConverter()

# Create data
x = np.linspace(0, 10, 100)
y_celsius = 20 + 10 * np.sin(x)
y_fahrenheit = y_celsius * 9/5 + 32

# Create a figure and axis
fig, ax = plt.subplots()

# Plot the data
line1, = ax.plot(x, y_celsius, 'b-', label='Celsius')
line2, = ax.plot(x, y_fahrenheit, 'r-', label='Fahrenheit')

# Update the y-axis units
ax.yaxis.update_units(TemperatureConverter)

# Set labels and title
ax.set_xlabel('Time (s)')
ax.set_ylabel('Temperature')
plt.title('Custom Unit Converter - how2matplotlib.com')

# Add legend
ax.legend()

# Show the plot
plt.show()
Output:
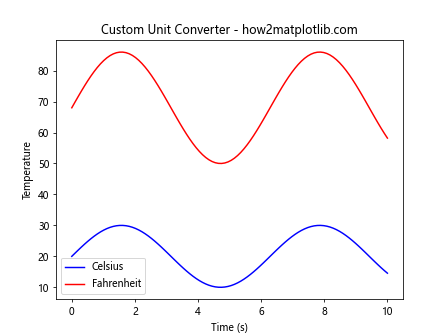
In this example, we create a custom TemperatureConverter that can convert between Celsius and Fahrenheit. We then use this with Matplotlib.axis.Axis.update_units() to handle temperature data in different units.
Animating Unit Changes
You can also use Matplotlib.axis.Axis.update_units() in animations to create dynamic unit changes. Here’s an example:
import matplotlib.pyplot as plt
import numpy as np
from matplotlib.animation import FuncAnimation

# Create initial data
x = np.linspace(0, 10, 100)
y = np.sin(x)

# Create a figure and axis
fig, ax = plt.subplots()

# Plot the initial data
line, = ax.plot(x, y)

# Set initial labels and title
ax.set_xlabel('Time (s)')
ax.set_ylabel('Amplitude')
plt.title('Animating Unit Changes - how2matplotlib.com')

# Animation update function
def update(frame):
    # Update data
    x_new = x * (frame + 1)
    y_new = np.sin(x_new / (frame + 1))

    # Update plot data
    line.set_data(x_new, y_new)

    # Update x-axis units
    ax.xaxis.update_units(x_new)

    # Update x-axis label
    ax.set_xlabel(f'Time ({"ms" if frame % 2 else "s"})')

    # Update axis limits
    ax.relim()
    ax.autoscale_view()

    return line,

# Create animation
anim = FuncAnimation(fig, update, frames=10, interval=1000, blit=True)

# Show the animation
plt.show()
Output:
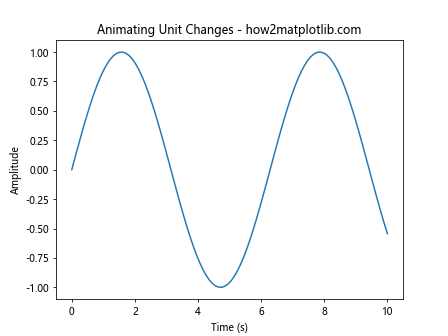
In this example, we create an animation that alternates between seconds and milliseconds, using Matplotlib.axis.Axis.update_units() to update the axis units in each frame.
Conclusion
The Matplotlib.axis.Axis.update_units() function is a powerful tool for managing axis units in Matplotlib plots. Throughout this comprehensive guide, we’ve explored its basic usage, parameters, common pitfalls, best practices, and advanced topics. We’ve seen how this function can be used to handle different unit systems, work with custom unit converters, and even create dynamic unit changes in animations.