Comprehensive Guide to Matplotlib.pyplot.autoscale() in Python
Matplotlib.pyplot.autoscale() in Python is a powerful function that allows you to automatically adjust the axis limits of your plots. This function is an essential tool for data visualization, enabling you to create more dynamic and responsive plots that adapt to your data. In this comprehensive guide, we’ll explore the ins and outs of Matplotlib.pyplot.autoscale(), providing detailed explanations, numerous examples, and practical tips to help you master this versatile function.
Understanding Matplotlib.pyplot.autoscale() in Python
Matplotlib.pyplot.autoscale() in Python is a method that automatically adjusts the view limits of the current axes to encompass all the data. By default, it operates on both the x and y axes, but you can specify which axis to autoscale if needed. This function is particularly useful when you’re dealing with data that has a wide range of values or when you want to ensure that all your data points are visible in the plot.
Let’s start with a basic example to illustrate how Matplotlib.pyplot.autoscale() works:
import matplotlib.pyplot as plt
import numpy as np

# Generate some data
x = np.linspace(0, 10, 100)
y = np.sin(x)

# Create a plot
plt.plot(x, y, label='Sine wave')
plt.title('How2matplotlib.com: Basic Autoscale Example')
plt.xlabel('X-axis')
plt.ylabel('Y-axis')
plt.legend()

# Apply autoscale
plt.autoscale()

plt.show()
Output:
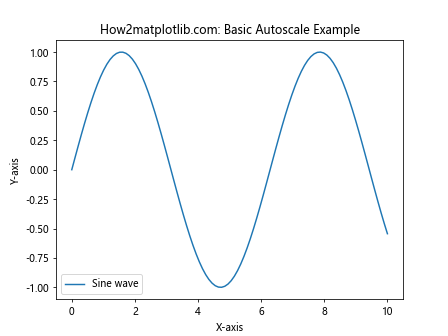
In this example, we create a simple sine wave plot and then apply Matplotlib.pyplot.autoscale(). The function automatically adjusts the axis limits to ensure that all data points are visible. This is particularly useful when you’re not sure about the range of your data or when you want to quickly visualize all data points without manually setting axis limits.
Key Parameters of Matplotlib.pyplot.autoscale() in Python
Matplotlib.pyplot.autoscale() in Python comes with several parameters that allow you to fine-tune its behavior. Let’s explore these parameters in detail:
enable: This boolean parameter determines whether autoscaling is enabled or disabled. By default, it’s set to True.axis: This parameter specifies which axis to autoscale. It can be ‘x’, ‘y’, or ‘both’ (default).tight: When set to True, this parameter sets the axis limits to the minimum and maximum data values.
Let’s see an example that demonstrates the use of these parameters:
import matplotlib.pyplot as plt
import numpy as np

# Generate data
x = np.linspace(0, 10, 100)
y = np.exp(x)

# Create a plot
plt.plot(x, y, label='Exponential')
plt.title('How2matplotlib.com: Autoscale with Parameters')
plt.xlabel('X-axis')
plt.ylabel('Y-axis')
plt.legend()

# Apply autoscale only to y-axis with tight limits
plt.autoscale(enable=True, axis='y', tight=True)

plt.show()
Output:
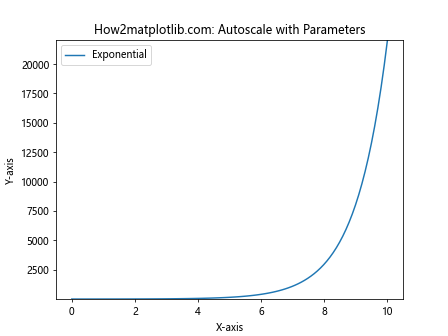
In this example, we’re plotting an exponential function and using Matplotlib.pyplot.autoscale() to adjust only the y-axis limits tightly around the data. This is particularly useful when you want to focus on the vertical spread of your data while maintaining a specific x-axis range.
Matplotlib.pyplot.autoscale() in Python: Handling Different Plot Types
Matplotlib.pyplot.autoscale() in Python works with various types of plots. Let’s explore how it behaves with different plot types:
Line Plots
Line plots are one of the most common types of plots, and Matplotlib.pyplot.autoscale() works seamlessly with them. Here’s an example:
import matplotlib.pyplot as plt
import numpy as np

# Generate data
x = np.linspace(0, 10, 100)
y1 = np.sin(x)
y2 = np.cos(x)

# Create a plot
plt.plot(x, y1, label='Sine')
plt.plot(x, y2, label='Cosine')
plt.title('How2matplotlib.com: Autoscale with Line Plots')
plt.xlabel('X-axis')
plt.ylabel('Y-axis')
plt.legend()

# Apply autoscale
plt.autoscale()

plt.show()
Output:
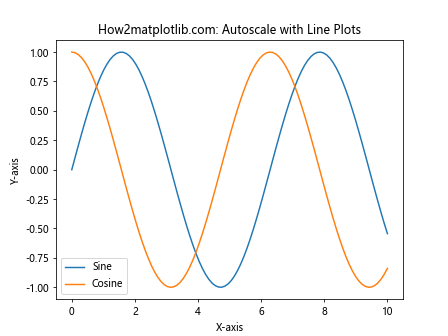
In this example, we plot both sine and cosine functions. Matplotlib.pyplot.autoscale() automatically adjusts the axis limits to show both curves completely.
Scatter Plots
Scatter plots can benefit greatly from autoscaling, especially when dealing with data points that have a wide range of values. Here’s an example:
import matplotlib.pyplot as plt
import numpy as np

# Generate random data
np.random.seed(42)
x = np.random.rand(50) * 100
y = np.random.rand(50) * 100

# Create a scatter plot
plt.scatter(x, y, alpha=0.5)
plt.title('How2matplotlib.com: Autoscale with Scatter Plots')
plt.xlabel('X-axis')
plt.ylabel('Y-axis')

# Apply autoscale
plt.autoscale()

plt.show()
Output:
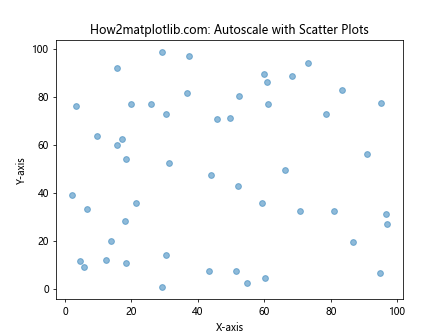
In this scatter plot example, Matplotlib.pyplot.autoscale() ensures that all data points are visible, regardless of their distribution.
Bar Plots
Bar plots can also benefit from autoscaling, especially when dealing with bars of varying heights. Here’s an example:
import matplotlib.pyplot as plt
import numpy as np

# Generate data
categories = ['A', 'B', 'C', 'D', 'E']
values = [23, 45, 56, 78, 32]

# Create a bar plot
plt.bar(categories, values)
plt.title('How2matplotlib.com: Autoscale with Bar Plots')
plt.xlabel('Categories')
plt.ylabel('Values')

# Apply autoscale
plt.autoscale()

plt.show()
Output:
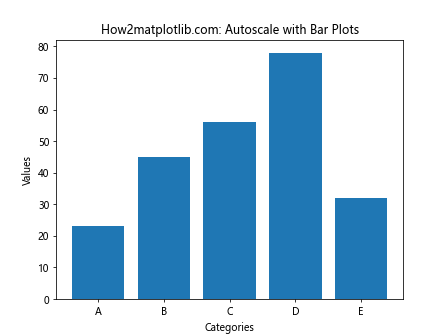
In this bar plot example, Matplotlib.pyplot.autoscale() adjusts the y-axis to accommodate the tallest bar while ensuring all bars are visible.
Advanced Techniques with Matplotlib.pyplot.autoscale() in Python
Now that we’ve covered the basics, let’s explore some advanced techniques using Matplotlib.pyplot.autoscale() in Python.
Combining Autoscale with Manual Limits
Sometimes, you might want to use autoscale for one axis while manually setting limits for the other. Here’s how you can do that:
import matplotlib.pyplot as plt
import numpy as np

# Generate data
x = np.linspace(0, 10, 100)
y = np.sin(x) * np.exp(-x/10)

# Create a plot
plt.plot(x, y)
plt.title('How2matplotlib.com: Combining Autoscale with Manual Limits')
plt.xlabel('X-axis')
plt.ylabel('Y-axis')

# Set manual x-limits and autoscale y-axis
plt.xlim(0, 8)
plt.autoscale(axis='y')

plt.show()
Output:
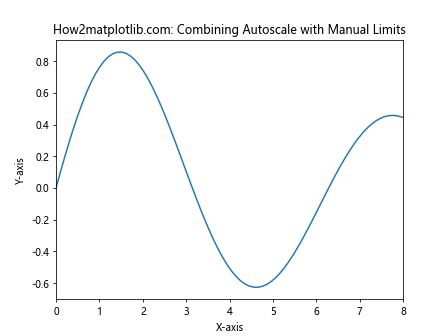
In this example, we manually set the x-axis limits while using Matplotlib.pyplot.autoscale() to adjust the y-axis limits automatically.
Using Autoscale with Subplots
Matplotlib.pyplot.autoscale() in Python can be applied to individual subplots. Here’s an example:
import matplotlib.pyplot as plt
import numpy as np

# Generate data
x = np.linspace(0, 10, 100)
y1 = np.sin(x)
y2 = np.cos(x)

# Create subplots
fig, (ax1, ax2) = plt.subplots(2, 1, figsize=(8, 8))

# Plot in first subplot
ax1.plot(x, y1)
ax1.set_title('How2matplotlib.com: Sine Wave')
ax1.autoscale(axis='y')

# Plot in second subplot
ax2.plot(x, y2)
ax2.set_title('How2matplotlib.com: Cosine Wave')
ax2.autoscale(axis='y')

plt.tight_layout()
plt.show()
Output:
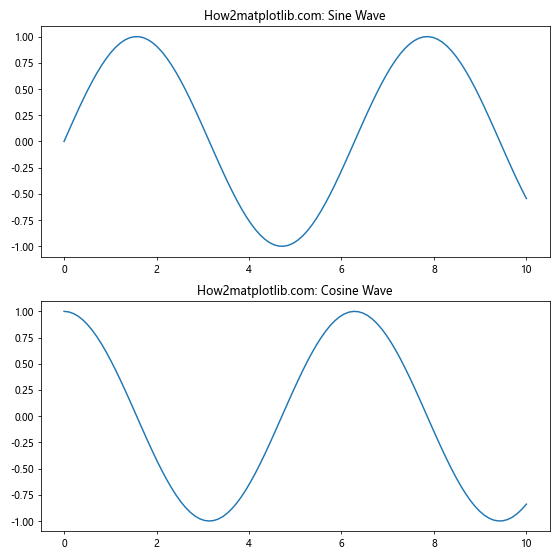
In this example, we apply Matplotlib.pyplot.autoscale() separately to each subplot, allowing for independent y-axis scaling.
Autoscaling with Date Axes
When working with time series data, Matplotlib.pyplot.autoscale() in Python can be particularly useful. Here’s an example:
import matplotlib.pyplot as plt
import numpy as np
import pandas as pd

# Generate date range
dates = pd.date_range(start='2023-01-01', end='2023-12-31', freq='D')
values = np.cumsum(np.random.randn(len(dates)))

# Create a plot
plt.figure(figsize=(10, 6))
plt.plot(dates, values)
plt.title('How2matplotlib.com: Autoscale with Date Axes')
plt.xlabel('Date')
plt.ylabel('Value')

# Apply autoscale
plt.autoscale()

plt.gcf().autofmt_xdate()  # Rotate and align the tick labels
plt.show()
Output:
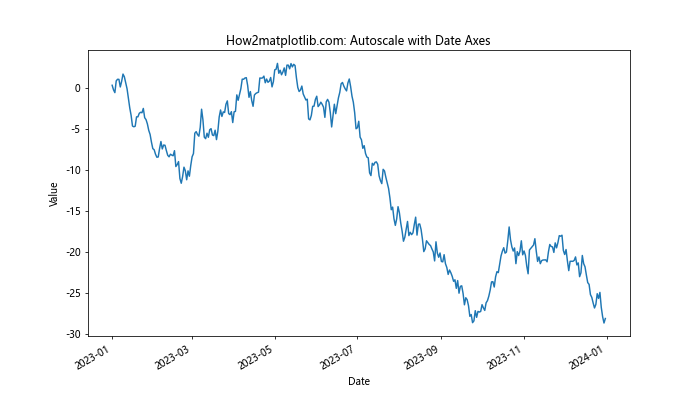
In this example, Matplotlib.pyplot.autoscale() adjusts both the date axis and the value axis to ensure all data points are visible.
Common Pitfalls and Solutions when Using Matplotlib.pyplot.autoscale() in Python
While Matplotlib.pyplot.autoscale() in Python is a powerful tool, there are some common pitfalls you might encounter. Let’s discuss these and their solutions:
Pitfall 1: Autoscale Overriding Manual Limits
Sometimes, you might set manual limits and then call autoscale, which can override your manual settings. To avoid this, you can use the axis parameter to specify which axis to autoscale:
import matplotlib.pyplot as plt
import numpy as np

# Generate data
x = np.linspace(0, 10, 100)
y = np.sin(x)

# Create a plot
plt.plot(x, y)
plt.title('How2matplotlib.com: Avoiding Autoscale Override')
plt.xlabel('X-axis')
plt.ylabel('Y-axis')

# Set manual x-limits
plt.xlim(0, 5)

# Autoscale only y-axis
plt.autoscale(axis='y')

plt.show()
Output:
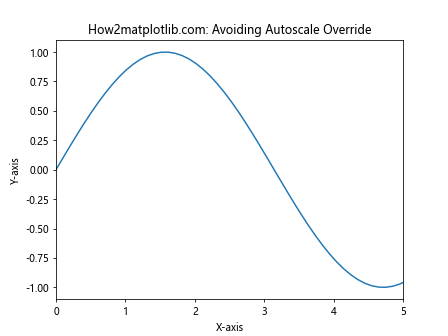
In this example, we set manual x-limits and then use Matplotlib.pyplot.autoscale() only on the y-axis, preserving our manual x-axis settings.
Pitfall 2: Autoscale with Log Scales
When using log scales, autoscale might not always produce the desired result. In such cases, you might need to manually adjust the limits after autoscaling:
import matplotlib.pyplot as plt
import numpy as np

# Generate data
x = np.logspace(0, 3, 100)
y = x**2

# Create a plot
plt.figure(figsize=(8, 6))
plt.loglog(x, y)
plt.title('How2matplotlib.com: Autoscale with Log Scales')
plt.xlabel('X-axis (log scale)')
plt.ylabel('Y-axis (log scale)')

# Apply autoscale
plt.autoscale()

# Adjust limits manually if needed
plt.xlim(1, 1100)
plt.ylim(1, 1100000)

plt.show()
Output:
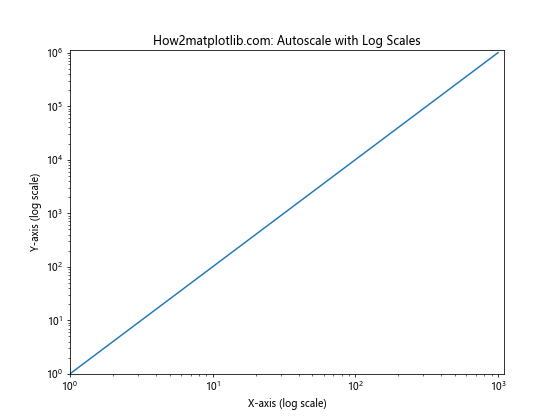
In this example, we use a log-log plot and apply Matplotlib.pyplot.autoscale(). We then manually adjust the limits to ensure a good view of the data.
Best Practices for Using Matplotlib.pyplot.autoscale() in Python
To make the most of Matplotlib.pyplot.autoscale() in Python, consider these best practices:
- Use autoscale early in your plotting process: Apply Matplotlib.pyplot.autoscale() before adding elements like legends or annotations to ensure they’re positioned correctly.
Combine autoscale with manual adjustments: Use autoscale to get a good starting point, then fine-tune manually if needed.
Be mindful of different plot types: Autoscale behavior can vary between plot types, so always check the result.
Use the
tightparameter for precise limits: When you need the axes to fit the data exactly, useplt.autoscale(tight=True).Consider using
plt.axis('tight')as an alternative: This can sometimes provide better results than autoscale for certain plots.
Here’s an example incorporating some of these best practices: