Comprehensive Guide to Using Matplotlib.axis.XAxis.get_url() Function in Python
Matplotlib.axis.XAxis.get_url() in function Python is an essential method for retrieving URL information associated with the x-axis in Matplotlib plots. This function is part of the broader Matplotlib library, which is widely used for creating static, animated, and interactive visualizations in Python. In this comprehensive guide, we’ll explore the Matplotlib.axis.XAxis.get_url() function in depth, covering its usage, applications, and providing numerous examples to illustrate its functionality.
Understanding Matplotlib.axis.XAxis.get_url()
The Matplotlib.axis.XAxis.get_url() function is specifically designed to retrieve the URL associated with the x-axis of a Matplotlib plot. This URL can be used for various purposes, such as linking to external resources or providing additional information about the axis. To fully grasp the concept of Matplotlib.axis.XAxis.get_url(), it’s important to understand its role within the Matplotlib library and how it interacts with other components of a plot.
Basic Usage of Matplotlib.axis.XAxis.get_url()
Let’s start with a simple example to demonstrate the basic usage of Matplotlib.axis.XAxis.get_url():
import matplotlib.pyplot as plt

# Create a simple plot
fig, ax = plt.subplots()
ax.plot([1, 2, 3, 4], [1, 4, 2, 3])

# Set a URL for the x-axis
ax.xaxis.set_url("https://how2matplotlib.com")

# Retrieve the URL using get_url()
url = ax.xaxis.get_url()

print(f"The URL associated with the x-axis is: {url}")

plt.show()
Output:
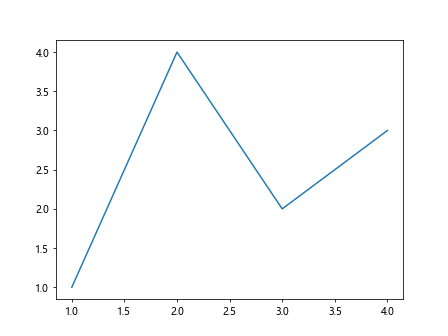
In this example, we create a simple line plot and set a URL for the x-axis using the set_url() method. We then use Matplotlib.axis.XAxis.get_url() to retrieve the URL and print it. This demonstrates the basic functionality of the get_url() method in retrieving URL information associated with the x-axis.
Applications of Matplotlib.axis.XAxis.get_url()
The Matplotlib.axis.XAxis.get_url() function has various applications in data visualization and interactive plotting. Here are some common use cases:
- Creating interactive plots with clickable axes
- Linking to external resources or documentation
- Implementing custom tooltips or hover information
- Enhancing accessibility by providing additional context
Let’s explore each of these applications with examples.
Creating Interactive Plots with Clickable Axes
One powerful application of Matplotlib.axis.XAxis.get_url() is creating interactive plots where users can click on the x-axis to access additional information or resources. Here’s an example:
import matplotlib.pyplot as plt
from matplotlib.backends.backend_tkagg import FigureCanvasTkAgg
import tkinter as tk
import webbrowser

def on_click(event):
    if event.inaxes == ax.xaxis:
        url = ax.xaxis.get_url()
        if url:
            webbrowser.open_new_tab(url)

fig, ax = plt.subplots()
ax.plot([1, 2, 3, 4], [1, 4, 2, 3])
ax.xaxis.set_url("https://how2matplotlib.com")

root = tk.Tk()
canvas = FigureCanvasTkAgg(fig, master=root)
canvas.draw()
canvas.get_tk_widget().pack()

canvas.mpl_connect('button_press_event', on_click)

root.mainloop()
In this example, we create an interactive plot using Tkinter. When the user clicks on the x-axis, the on_click function is triggered, which retrieves the URL using Matplotlib.axis.XAxis.get_url() and opens it in a new browser tab.
Linking to External Resources or Documentation
Matplotlib.axis.XAxis.get_url() can be used to link specific parts of a plot to external resources or documentation. This is particularly useful for creating self-explanatory visualizations. Here’s an example:
import matplotlib.pyplot as plt

fig, ax = plt.subplots()
ax.plot([1, 2, 3, 4], [1, 4, 2, 3], label='Data')
ax.set_xlabel('X-axis (click for more info)')
ax.set_ylabel('Y-axis')
ax.legend()

ax.xaxis.set_url("https://how2matplotlib.com/x-axis-guide")

def on_click(event):
    if event.inaxes == ax.xaxis:
        url = ax.xaxis.get_url()
        if url:
            print(f"For more information about the x-axis, visit: {url}")

fig.canvas.mpl_connect('button_press_event', on_click)

plt.show()
Output:
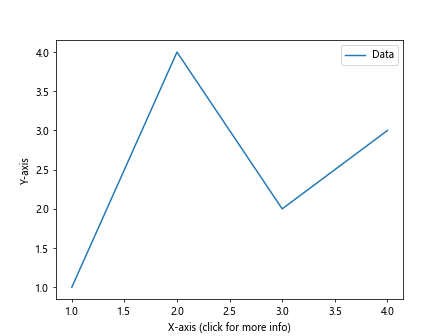
In this example, we set a URL for the x-axis that links to a hypothetical guide about x-axes. When the user clicks on the x-axis, the URL is retrieved using Matplotlib.axis.XAxis.get_url() and printed as a suggestion for further reading.
Implementing Custom Tooltips or Hover Information
Matplotlib.axis.XAxis.get_url() can be used to implement custom tooltips or hover information for the x-axis. Here’s an example:
import matplotlib.pyplot as plt
from matplotlib.backends.backend_tkagg import FigureCanvasTkAgg
import tkinter as tk

def on_hover(event):
    if event.inaxes == ax.xaxis:
        url = ax.xaxis.get_url()
        if url:
            tooltip.config(text=f"Click to visit: {url}")
            tooltip.place(x=event.x, y=event.y)
    else:
        tooltip.place_forget()

fig, ax = plt.subplots()
ax.plot([1, 2, 3, 4], [1, 4, 2, 3])
ax.xaxis.set_url("https://how2matplotlib.com/x-axis-info")

root = tk.Tk()
canvas = FigureCanvasTkAgg(fig, master=root)
canvas.draw()
canvas.get_tk_widget().pack()

tooltip = tk.Label(root, text="", relief="solid", borderwidth=1)
canvas.mpl_connect('motion_notify_event', on_hover)

root.mainloop()
In this example, we create a custom tooltip that appears when the user hovers over the x-axis. The tooltip displays the URL associated with the x-axis, which is retrieved using Matplotlib.axis.XAxis.get_url().
Enhancing Accessibility by Providing Additional Context
Matplotlib.axis.XAxis.get_url() can be used to enhance the accessibility of plots by providing additional context or explanations. Here’s an example:
import matplotlib.pyplot as plt

fig, ax = plt.subplots()
ax.plot([1, 2, 3, 4], [1, 4, 2, 3])
ax.set_xlabel('X-axis')
ax.set_ylabel('Y-axis')

ax.xaxis.set_url("https://how2matplotlib.com/accessibility-info")

def get_axis_description(axis):
    url = axis.get_url()
    if url:
        return f"This axis has additional information available at: {url}"
    return "No additional information available for this axis."

x_description = get_axis_description(ax.xaxis)
y_description = get_axis_description(ax.yaxis)

print("Accessibility Information:")
print(f"X-axis: {x_description}")
print(f"Y-axis: {y_description}")

plt.show()
Output:
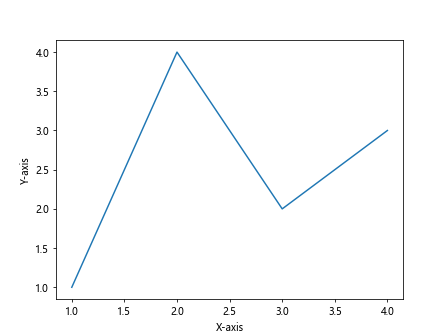
In this example, we use Matplotlib.axis.XAxis.get_url() to provide additional accessibility information for the x-axis. This information can be used by screen readers or other assistive technologies to provide more context about the plot.
Advanced Usage of Matplotlib.axis.XAxis.get_url()
Now that we’ve covered the basic applications of Matplotlib.axis.XAxis.get_url(), let’s explore some more advanced usage scenarios and techniques.
Dynamic URL Assignment
In some cases, you might want to dynamically assign URLs to the x-axis based on certain conditions or data. Here’s an example:
import matplotlib.pyplot as plt
import numpy as np

def assign_url(value):
    if value < 0:
        return "https://how2matplotlib.com/negative-values"
    elif value > 0:
        return "https://how2matplotlib.com/positive-values"
    else:
        return "https://how2matplotlib.com/zero-value"

x = np.linspace(-5, 5, 100)
y = x**2

fig, ax = plt.subplots()
ax.plot(x, y)

for tick in ax.get_xticks():
    ax.xaxis.set_url(assign_url(tick))
    url = ax.xaxis.get_url()
    print(f"X-value: {tick}, URL: {url}")

plt.show()
Output:
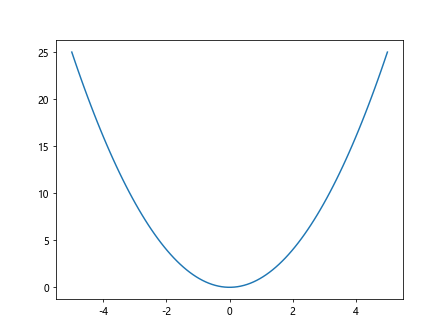
In this example, we dynamically assign URLs to the x-axis based on the value of each tick. We then use Matplotlib.axis.XAxis.get_url() to retrieve and print these URLs.
Using Matplotlib.axis.XAxis.get_url() with Subplots
When working with multiple subplots, you can use Matplotlib.axis.XAxis.get_url() to manage URLs for each subplot’s x-axis independently. Here’s an example:
import matplotlib.pyplot as plt

fig, (ax1, ax2) = plt.subplots(2, 1, figsize=(8, 8))

ax1.plot([1, 2, 3, 4], [1, 4, 2, 3])
ax1.set_title('Subplot 1')
ax1.xaxis.set_url("https://how2matplotlib.com/subplot1")

ax2.plot([1, 2, 3, 4], [3, 1, 4, 2])
ax2.set_title('Subplot 2')
ax2.xaxis.set_url("https://how2matplotlib.com/subplot2")

for i, ax in enumerate([ax1, ax2], 1):
    url = ax.xaxis.get_url()
    print(f"Subplot {i} x-axis URL: {url}")

plt.tight_layout()
plt.show()
Output:
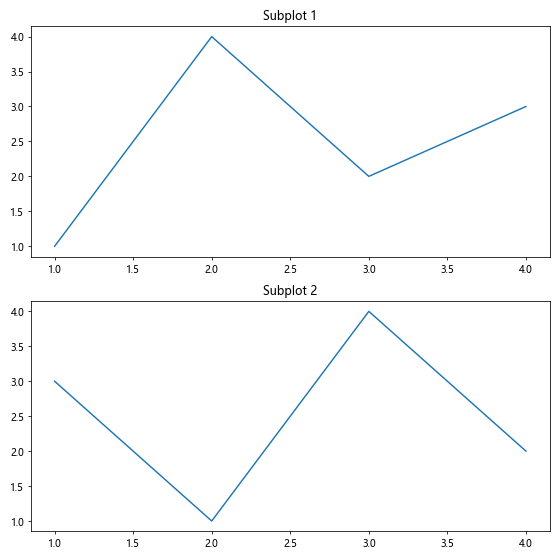
In this example, we create two subplots and assign different URLs to their x-axes. We then use Matplotlib.axis.XAxis.get_url() to retrieve and print these URLs for each subplot.
Combining Matplotlib.axis.XAxis.get_url() with Other Axis Properties
Matplotlib.axis.XAxis.get_url() can be used in conjunction with other axis properties to create more informative and interactive plots. Here’s an example:
import matplotlib.pyplot as plt

fig, ax = plt.subplots()
ax.plot([1, 2, 3, 4], [1, 4, 2, 3])

ax.set_xlabel('X-axis (hover for more info)')
ax.xaxis.set_url("https://how2matplotlib.com/x-axis-properties")

def on_hover(event):
    if event.inaxes == ax.xaxis:
        url = ax.xaxis.get_url()
        label = ax.xaxis.get_label().get_text()
        units = ax.xaxis.get_units()
        print(f"X-axis info - Label: {label}, Units: {units}, URL: {url}")

fig.canvas.mpl_connect('motion_notify_event', on_hover)

plt.show()
Output:
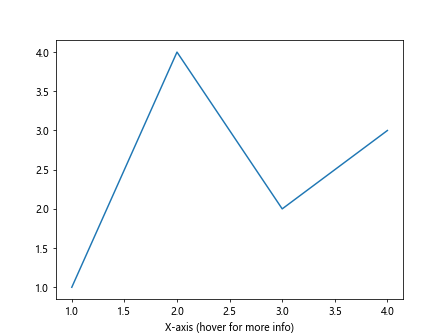
In this example, we combine Matplotlib.axis.XAxis.get_url() with other axis properties like labels and units to provide comprehensive information about the x-axis when the user hovers over it.
Best Practices for Using Matplotlib.axis.XAxis.get_url()
When working with Matplotlib.axis.XAxis.get_url(), it’s important to follow some best practices to ensure your code is efficient, maintainable, and user-friendly. Here are some recommendations:
- Always check if a URL is set before using it
- Use meaningful and relevant URLs
- Combine with other interactive features for a better user experience
- Document the purpose of each URL in your code
- Consider accessibility when using URLs in your plots
Let’s explore each of these best practices with examples.
Checking for URL Existence
Before using the URL retrieved by Matplotlib.axis.XAxis.get_url(), it’s a good practice to check if a URL is actually set. Here’s an example:
import matplotlib.pyplot as plt

fig, ax = plt.subplots()
ax.plot([1, 2, 3, 4], [1, 4, 2, 3])

# Don't set a URL for this example

url = ax.xaxis.get_url()
if url:
    print(f"The x-axis has a URL: {url}")
else:
    print("No URL is set for the x-axis")

plt.show()
Output:
In this example, we check if a URL is set for the x-axis before trying to use it. This prevents potential errors or unexpected behavior in your code.
Using Meaningful and Relevant URLs
When setting URLs for your x-axis, make sure they are meaningful and relevant to the context of your plot. Here’s an example:
import matplotlib.pyplot as plt

fig, ax = plt.subplots()
ax.plot([1, 2, 3, 4], [1, 4, 2, 3])
ax.set_xlabel('Time (seconds)')
ax.set_ylabel('Temperature (°C)')
ax.set_title('Temperature Over Time')

ax.xaxis.set_url("https://how2matplotlib.com/time-series-analysis")

url = ax.xaxis.get_url()
print(f"For more information on time series analysis, visit: {url}")

plt.show()
Output:
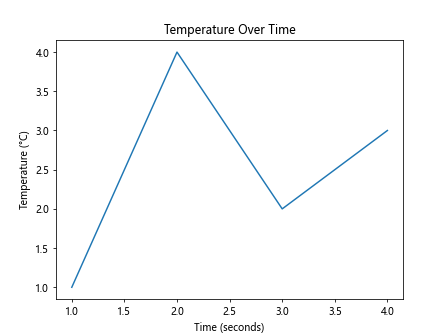
In this example, we set a URL that is relevant to the content of the plot (time series analysis) and provide context for why the user might want to visit that URL.
Combining with Other Interactive Features
To create a more engaging user experience, combine Matplotlib.axis.XAxis.get_url() with other interactive features. Here’s an example using tooltips:
import matplotlib.pyplot as plt
from matplotlib.backends.backend_tkagg import FigureCanvasTkAgg
import tkinter as tk

def on_hover(event):
    if event.inaxes == ax.xaxis:
        url = ax.xaxis.get_url()
        if url:
            tooltip.config(text=f"Click for more info: {url}")
            tooltip.place(x=event.x, y=event.y)
    else:
        tooltip.place_forget()

def on_click(event):
    if event.inaxes == ax.xaxis:
        url = ax.xaxis.get_url()
        if url:
            print(f"Opening URL: {url}")
            # Here you would typically open the URL in a web browser

fig, ax = plt.subplots()
ax.plot([1, 2, 3, 4], [1, 4, 2, 3])
ax.xaxis.set_url("https://how2matplotlib.com/interactive-plots")

root = tk.Tk()
canvas = FigureCanvasTkAgg(fig, master=root)
canvas.draw()
canvas.get_tk_widget().pack()

tooltip = tk.Label(root, text="", relief="solid", borderwidth=1)
canvas.mpl_connect('motion_notify_event', on_hover)
canvas.mpl_connect('button_press_event', on_click)

root.mainloop()
In this example, we combine tooltips and click events with Matplotlib.axis.XAxis.get_url() to create a more interactive plot.
Documenting URL Purposes
When using Matplotlib.axis.XAxis.get_url() in your code, it’s important to document the purpose of each URL. This makes your code more maintainable and easier for others to understand. Here’s an example:
import matplotlib.pyplot as plt

fig, ax = plt.subplots()
ax.plot([1, 2, 3, 4], [1, 4, 2, 3])

# Set URL for x-axis
# This URL leads to documentation about time series data
ax.xaxis.set_url("https://how2matplotlib.com/time-series-data")

# Set URL for y-axis
# This URL leads to documentation about temperature measurements
ax.yaxis.set_url("https://how2matplotlib.com/temperature-data")

def print_axis_info(axis, name):
    url = axis.get_url()
    if url:
        print(f"{name}-axis URL: {url}")
        print(f"Purpose: Provides information about {name}-axis data")
    else:
        print(f"No URL set for {name}-axis")

print_axis_info(ax.xaxis, "X")
print_axis_info(ax.yaxis, "Y")

plt.show()
Output:
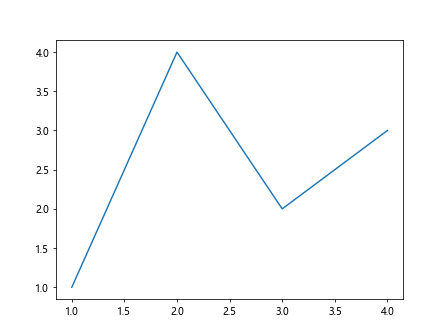
In this example, we add comments explaining the purpose of each URL and create a function that prints this information. This makes it clear why each URL is being used and what information it provides.
Considering Accessibility
When using Matplotlib.axis.XAxis.get_url(), it’s important to consider accessibility for all users. Here’s an example that provides alternative text for URLs:
import matplotlib.pyplot as plt

fig, ax = plt.subplots()
ax.plot([1, 2, 3, 4], [1, 4, 2, 3])

ax.xaxis.set_url("https://how2matplotlib.com/x-axis-info")
ax.xaxis.set_url_alt_text("Information about the x-axis (Time)")

ax.yaxis.set_url("https://how2matplotlib.com/y-axis-info")
ax.yaxis.set_url_alt_text("Information about the y-axis (Temperature)")

def print_accessible_info(axis, name):
    url = axis.get_url()
    alt_text = axis.get_url_alt_text()
    if url and alt_text:
        print(f"{name}-axis URL: {url}")
        print(f"{name}-axis URL description: {alt_text}")
    elif url:
        print(f"{name}-axis URL: {url}")
        print(f"Warning: No alternative text provided for {name}-axis URL")
    else:
        print(f"No URL set for {name}-axis")

print_accessible_info(ax.xaxis, "X")
print_accessible_info(ax.yaxis, "Y")

plt.show()
In this example, we use the set_url_alt_text() method to provide alternative text for the URLs. This alternative text can be used by screen readers or other assistive technologies to provide context for the URLs.
Common Pitfalls and How to Avoid Them
When working with Matplotlib.axis.XAxis.get_url(), there are some common pitfalls that developers might encounter. Let’s discuss these issues and how to avoid them:
- Forgetting to set the URL before getting it
- Not handling cases where no URL is set
- Using absolute URLs that might change
- Overusing URLs and cluttering the plot
- Not considering cross-platform compatibility
Forgetting to Set the URL
One common mistake is trying to get a URL before setting it. Here’s an example of how to avoid this:
import matplotlib.pyplot as plt

fig, ax = plt.subplots()
ax.plot([1, 2, 3, 4], [1, 4, 2, 3])

# Incorrect: Trying to get URL before setting it
# url = ax.xaxis.get_url()
# print(f"X-axis URL: {url}")  # This will print None

# Correct: Set the URL first
ax.xaxis.set_url("https://how2matplotlib.com/x-axis")
url = ax.xaxis.get_url()
print(f"X-axis URL: {url}")

plt.show()
Output:
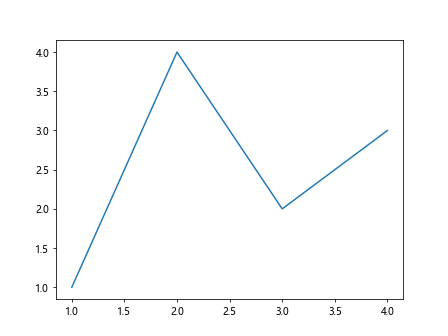
Always make sure to set the URL using set_url() before trying to retrieve it with Matplotlib.axis.XAxis.get_url().
Handling Cases with No URL
It’s important to handle cases where no URL is set. Here’s an example:
import matplotlib.pyplot as plt

fig, ax = plt.subplots()
ax.plot([1, 2, 3, 4], [1, 4, 2, 3])

url = ax.xaxis.get_url()
if url:
    print(f"X-axis URL: {url}")
else:
    print("No URL set for X-axis")

plt.show()
Output:
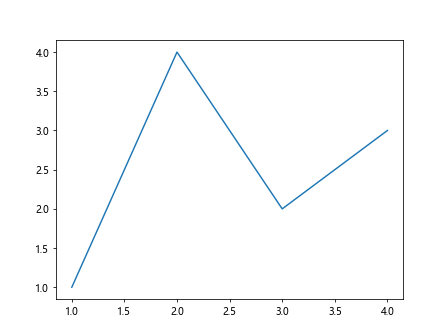
By checking if the URL is None or an empty string, you can avoid errors when no URL is set.
Using Relative URLs
Instead of using absolute URLs that might change, consider using relative URLs or URL placeholders that can be easily updated:
import matplotlib.pyplot as plt

BASE_URL = "https://how2matplotlib.com"

fig, ax = plt.subplots()
ax.plot([1, 2, 3, 4], [1, 4, 2, 3])

ax.xaxis.set_url(f"{BASE_URL}/x-axis")
ax.yaxis.set_url(f"{BASE_URL}/y-axis")

print(f"X-axis URL: {ax.xaxis.get_url()}")
print(f"Y-axis URL: {ax.yaxis.get_url()}")

plt.show()
Output:
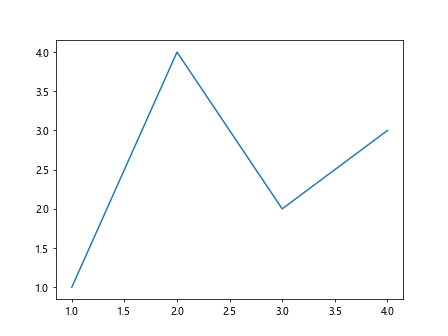
This approach makes it easier to update URLs across your entire project if the base URL changes.
Avoiding URL Clutter
While URLs can be useful, overusing them can clutter your plot and make it less readable. Use URLs judiciously:
import matplotlib.pyplot as plt

fig, ax = plt.subplots()
ax.plot([1, 2, 3, 4], [1, 4, 2, 3])

# Instead of setting URLs for every element, use them sparingly
ax.set_title("Temperature Over Time")
ax.set_xlabel("Time (seconds)")
ax.set_ylabel("Temperature (°C)")

# Set URL only for the main plot for additional information
ax.set_url("https://how2matplotlib.com/temperature-analysis")

url = ax.get_url()
if url:
    print(f"For more information about this plot, visit: {url}")

plt.show()
Output:
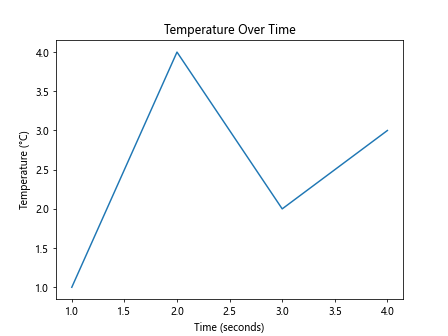
In this example, we set a URL for the entire plot rather than for individual axes, reducing clutter while still providing additional information.
Ensuring Cross-Platform Compatibility
When using Matplotlib.axis.XAxis.get_url(), ensure that your code works across different platforms and environments:
import matplotlib.pyplot as plt
import webbrowser
import platform

fig, ax = plt.subplots()
ax.plot([1, 2, 3, 4], [1, 4, 2, 3])
ax.xaxis.set_url("https://how2matplotlib.com/cross-platform")

def open_url(url):
    try:
        webbrowser.open(url)
    except Exception as e:
        print(f"Error opening URL: {e}")
        if platform.system() == "Linux":
            print("On Linux, you might need to specify a browser.")
            # Example: webbrowser.get('firefox').open(url)

def on_click(event):
    if event.inaxes == ax.xaxis:
        url = ax.xaxis.get_url()
        if url:
            open_url(url)

fig.canvas.mpl_connect('button_press_event', on_click)

plt.show()
Output:
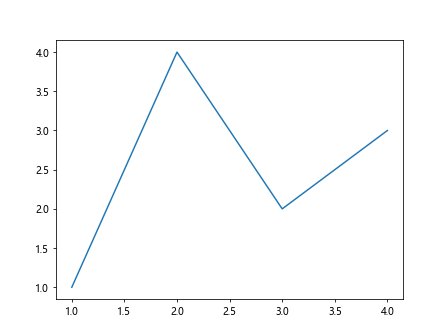
This example includes error handling and platform-specific considerations when opening URLs.
Advanced Techniques with Matplotlib.axis.XAxis.get_url()
Now that we’ve covered the basics and common pitfalls, let’s explore some advanced techniques using Matplotlib.axis.XAxis.get_url().
Dynamic URL Generation
You can dynamically generate URLs based on plot data:
import matplotlib.pyplot as plt
import numpy as np

def generate_url(value):
    return f"https://how2matplotlib.com/data-point/{value:.2f}"

x = np.linspace(0, 10, 100)
y = np.sin(x)

fig, ax = plt.subplots()
line, = ax.plot(x, y)

def on_move(event):
    if event.inaxes:
        cont, ind = line.contains(event)
        if cont:
            x_val = x[ind["ind"][0]]
            y_val = y[ind["ind"][0]]
            ax.xaxis.set_url(generate_url(x_val))
            print(f"Point: ({x_val:.2f}, {y_val:.2f})")
            print(f"URL: {ax.xaxis.get_url()}")

fig.canvas.mpl_connect('motion_notify_event', on_move)

plt.show()
Output:
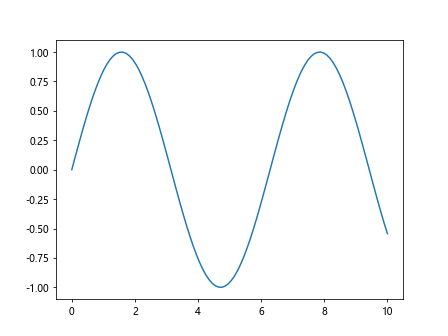
This example generates a unique URL for each data point as the user hovers over the plot.
Integrating with External Data Sources
You can use Matplotlib.axis.XAxis.get_url() to link to external data sources:
import matplotlib.pyplot as plt
import pandas as pd

# Assume we have a CSV file with stock data
df = pd.read_csv('stock_data.csv', parse_dates=['Date'])

fig, ax = plt.subplots()
ax.plot(df['Date'], df['Close'])

ax.set_title('Stock Price Over Time')
ax.set_xlabel('Date')
ax.set_ylabel('Price')

def generate_url(date):
    return f"https://how2matplotlib.com/stock-data/{date.strftime('%Y-%m-%d')}"

for i, date in enumerate(df['Date']):
    if i % 30 == 0:  # Set URL every 30 days to avoid clutter
        ax.xaxis.set_url(generate_url(date))

def on_click(event):
    if event.inaxes == ax.xaxis:
        url = ax.xaxis.get_url()
        if url:
            print(f"Fetching detailed data from: {url}")

fig.canvas.mpl_connect('button_press_event', on_click)

plt.show()
This example links each month in the plot to a hypothetical external data source.
Creating Custom Axis Classes
You can create custom axis classes that extend the functionality of Matplotlib.axis.XAxis.get_url():
import matplotlib.pyplot as plt
from matplotlib.axis import XAxis

class CustomXAxis(XAxis):
    def __init__(self, *args, **kwargs):
        super().__init__(*args, **kwargs)
        self._custom_url = None

    def set_custom_url(self, url):
        self._custom_url = url

    def get_custom_url(self):
        return self._custom_url or self.get_url()

fig, ax = plt.subplots()
ax.plot([1, 2, 3, 4], [1, 4, 2, 3])

custom_xaxis = CustomXAxis(ax)
ax.xaxis = custom_xaxis

custom_xaxis.set_url("https://how2matplotlib.com/default")
custom_xaxis.set_custom_url("https://how2matplotlib.com/custom")

print(f"Default URL: {custom_xaxis.get_url()}")
print(f"Custom URL: {custom_xaxis.get_custom_url()}")

plt.show()
Output:
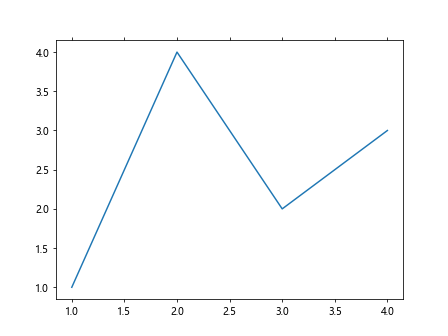
This example creates a custom x-axis class that allows setting and getting both default and custom URLs.
Conclusion
Matplotlib.axis.XAxis.get_url() is a powerful function that enables developers to enhance their plots with interactive and informative features. By linking axes to external resources, implementing custom tooltips, and creating dynamic visualizations, you can significantly improve the user experience of your Matplotlib plots.
Throughout this comprehensive guide, we’ve explored various aspects of Matplotlib.axis.XAxis.get_url(), including:
- Basic usage and applications
- Advanced techniques and best practices
- Common pitfalls and how to avoid them
- Integration with other Matplotlib features
- Considerations for accessibility and cross-platform compatibility