Comprehensive Guide to Matplotlib.axis.XAxis.get_figure() Function in Python
Matplotlib.axis.XAxis.get_figure() function in Python is an essential method for retrieving the Figure object associated with an XAxis instance. This function plays a crucial role in manipulating and accessing various properties of the figure containing the axis. In this comprehensive guide, we’ll explore the Matplotlib.axis.XAxis.get_figure() function in depth, covering its usage, applications, and providing numerous examples to illustrate its functionality.
Understanding the Matplotlib.axis.XAxis.get_figure() Function
The Matplotlib.axis.XAxis.get_figure() function is a method of the XAxis class in Matplotlib. It allows users to obtain the Figure object that contains the XAxis instance. This function is particularly useful when you need to access or modify properties of the entire figure from within the context of an axis.
Let’s start with a simple example to demonstrate how to use the Matplotlib.axis.XAxis.get_figure() function:
import matplotlib.pyplot as plt

# Create a figure and axis
fig, ax = plt.subplots()

# Plot some data
ax.plot([1, 2, 3, 4], [1, 4, 2, 3], label='Data from how2matplotlib.com')

# Get the figure object using get_figure()
figure = ax.xaxis.get_figure()

# Modify the figure title
figure.suptitle('Figure retrieved using Matplotlib.axis.XAxis.get_figure()')

plt.show()
Output:
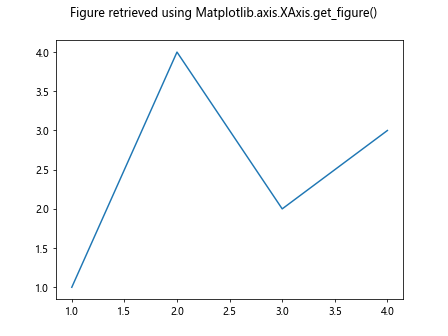
In this example, we create a figure and an axis using plt.subplots(). We then plot some data and use the Matplotlib.axis.XAxis.get_figure() function to retrieve the Figure object. Finally, we modify the figure title using the retrieved object.
Applications of Matplotlib.axis.XAxis.get_figure()
The Matplotlib.axis.XAxis.get_figure() function has numerous applications in data visualization and figure manipulation. Let’s explore some common use cases:
1. Adjusting Figure Properties
One of the primary uses of Matplotlib.axis.XAxis.get_figure() is to adjust various properties of the figure containing the axis. This includes modifying the figure size, background color, and other global settings.
import matplotlib.pyplot as plt

fig, ax = plt.subplots()
ax.plot([1, 2, 3, 4], [1, 4, 2, 3], label='Data from how2matplotlib.com')

# Get the figure object
figure = ax.xaxis.get_figure()

# Adjust figure properties
figure.set_size_inches(10, 6)
figure.set_facecolor('#f0f0f0')
figure.suptitle('Figure Properties Adjusted using Matplotlib.axis.XAxis.get_figure()')

plt.show()
Output:
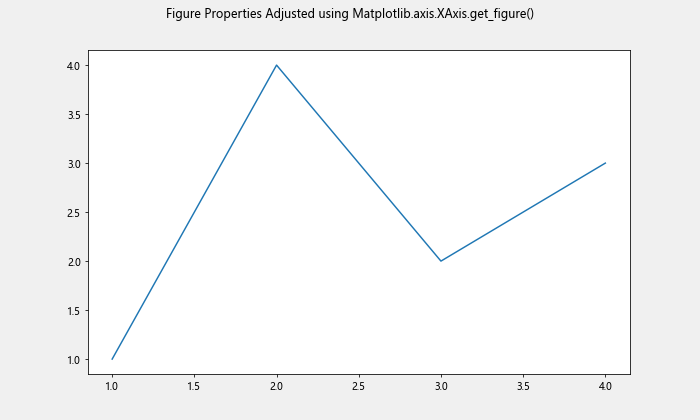
In this example, we use Matplotlib.axis.XAxis.get_figure() to retrieve the Figure object and then adjust its size and background color.
2. Adding Subplots
The Matplotlib.axis.XAxis.get_figure() function can be useful when adding new subplots to an existing figure:
import matplotlib.pyplot as plt

fig, ax1 = plt.subplots()
ax1.plot([1, 2, 3, 4], [1, 4, 2, 3], label='Data 1 from how2matplotlib.com')

# Get the figure object
figure = ax1.xaxis.get_figure()

# Add a new subplot
ax2 = figure.add_subplot(212)
ax2.plot([1, 2, 3, 4], [3, 1, 4, 2], label='Data 2 from how2matplotlib.com')

figure.suptitle('Multiple Subplots using Matplotlib.axis.XAxis.get_figure()')

plt.show()
Output:
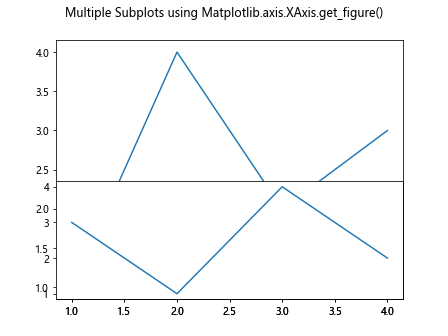
Here, we use Matplotlib.axis.XAxis.get_figure() to add a new subplot to the existing figure.
3. Saving the Figure
The Matplotlib.axis.XAxis.get_figure() function is also helpful when you want to save the figure containing the axis:
import matplotlib.pyplot as plt

fig, ax = plt.subplots()
ax.plot([1, 2, 3, 4], [1, 4, 2, 3], label='Data from how2matplotlib.com')

# Get the figure object
figure = ax.xaxis.get_figure()

# Save the figure
figure.savefig('how2matplotlib_example.png')

plt.show()
Output:
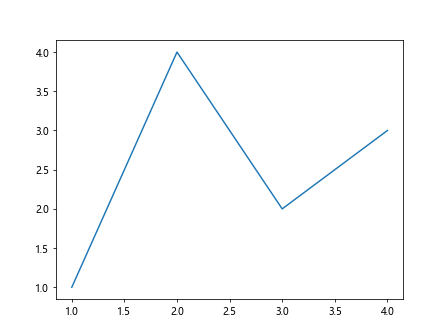
In this example, we use Matplotlib.axis.XAxis.get_figure() to retrieve the Figure object and then save it as an image file.
Advanced Usage of Matplotlib.axis.XAxis.get_figure()
Now that we’ve covered the basics, let’s explore some more advanced applications of the Matplotlib.axis.XAxis.get_figure() function:
1. Customizing Figure Layout
The Matplotlib.axis.XAxis.get_figure() function can be used to customize the layout of subplots within a figure:
import matplotlib.pyplot as plt

fig, (ax1, ax2) = plt.subplots(2, 1, figsize=(8, 6))
ax1.plot([1, 2, 3, 4], [1, 4, 2, 3], label='Data 1 from how2matplotlib.com')
ax2.plot([1, 2, 3, 4], [3, 1, 4, 2], label='Data 2 from how2matplotlib.com')

# Get the figure object
figure = ax1.xaxis.get_figure()

# Adjust subplot layout
figure.tight_layout(pad=3.0)
figure.suptitle('Custom Layout using Matplotlib.axis.XAxis.get_figure()', fontsize=16)

plt.show()
Output:
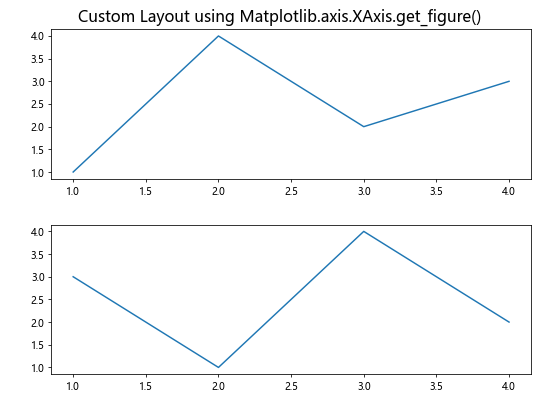
In this example, we use Matplotlib.axis.XAxis.get_figure() to adjust the layout of subplots and add a main title to the figure.
2. Adding Annotations to the Figure
The Matplotlib.axis.XAxis.get_figure() function can be useful when adding annotations or text to the entire figure:
import matplotlib.pyplot as plt

fig, ax = plt.subplots()
ax.plot([1, 2, 3, 4], [1, 4, 2, 3], label='Data from how2matplotlib.com')

# Get the figure object
figure = ax.xaxis.get_figure()

# Add annotation to the figure
figure.text(0.5, 0.02, 'Source: how2matplotlib.com', ha='center', va='center')
figure.suptitle('Figure Annotation using Matplotlib.axis.XAxis.get_figure()')

plt.show()
Output:
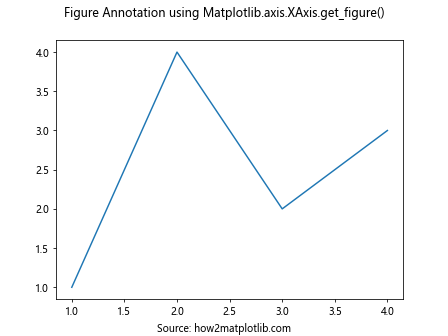
Here, we use Matplotlib.axis.XAxis.get_figure() to add a text annotation to the bottom of the figure.
3. Customizing Figure Legends
The Matplotlib.axis.XAxis.get_figure() function can be used to create and customize a single legend for multiple subplots:
import matplotlib.pyplot as plt

fig, (ax1, ax2) = plt.subplots(1, 2, figsize=(10, 4))
ax1.plot([1, 2, 3, 4], [1, 4, 2, 3], label='Data 1 from how2matplotlib.com')
ax2.plot([1, 2, 3, 4], [3, 1, 4, 2], label='Data 2 from how2matplotlib.com')

# Get the figure object
figure = ax1.xaxis.get_figure()

# Create a single legend for both subplots
handles1, labels1 = ax1.get_legend_handles_labels()
handles2, labels2 = ax2.get_legend_handles_labels()
figure.legend(handles1 + handles2, labels1 + labels2, loc='upper center')

figure.suptitle('Custom Legend using Matplotlib.axis.XAxis.get_figure()')

plt.show()
Output:
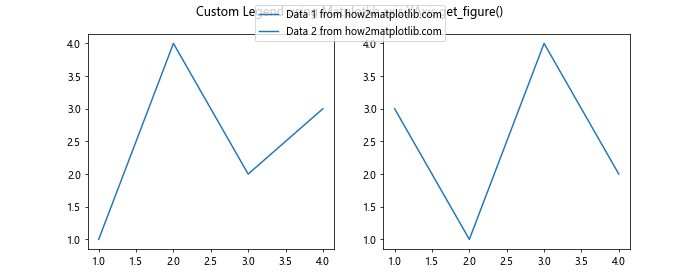
In this example, we use Matplotlib.axis.XAxis.get_figure() to create a single legend for multiple subplots.
Best Practices for Using Matplotlib.axis.XAxis.get_figure()
When working with the Matplotlib.axis.XAxis.get_figure() function, it’s important to follow some best practices to ensure efficient and effective use:
- Use Matplotlib.axis.XAxis.get_figure() sparingly: While it’s a powerful function, overuse can lead to cluttered and hard-to-maintain code. Only use it when you need to access or modify figure-level properties.
Combine with other Matplotlib functions: The Matplotlib.axis.XAxis.get_figure() function works best when combined with other Matplotlib functions for comprehensive figure customization.
Be mindful of performance: Repeatedly calling Matplotlib.axis.XAxis.get_figure() in a loop can impact performance. If possible, retrieve the Figure object once and store it in a variable for future use.
Use with context managers: When working with multiple figures, consider using context managers to ensure proper handling of figure resources.
Let’s look at an example that demonstrates these best practices: