Comprehensive Guide to Matplotlib.axis.Tick.is_transform_set() Function in Python
Matplotlib.axis.Tick.is_transform_set() function in Python is an essential method for working with tick objects in Matplotlib. This function is used to determine whether a transform has been set for a tick object. In this comprehensive guide, we’ll explore the Matplotlib.axis.Tick.is_transform_set() function in detail, covering its usage, applications, and providing numerous examples to help you master this powerful tool.
Understanding Matplotlib.axis.Tick.is_transform_set()
The Matplotlib.axis.Tick.is_transform_set() function is a method of the Tick class in Matplotlib’s axis module. It returns a boolean value indicating whether a transform has been set for the tick object. This function is particularly useful when working with custom tick transformations and ensuring that the desired transformations have been applied correctly.
Let’s start with a simple example to demonstrate the basic usage of Matplotlib.axis.Tick.is_transform_set():
import matplotlib.pyplot as plt

fig, ax = plt.subplots()
ax.set_title("how2matplotlib.com - Basic Example")
ax.plot([1, 2, 3, 4], [1, 4, 2, 3])

# Get the first x-axis tick
tick = ax.xaxis.get_major_ticks()[0]

# Check if a transform is set for the tick
is_transform_set = tick.is_transform_set()

print(f"Is transform set for the tick? {is_transform_set}")

plt.show()
Output:
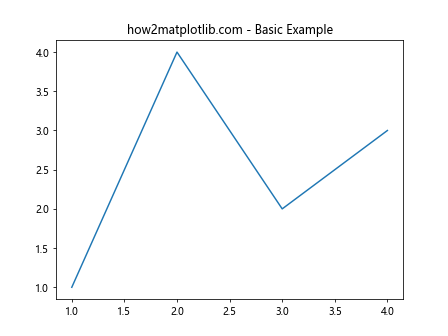
In this example, we create a simple plot and then retrieve the first major tick on the x-axis. We then use the is_transform_set() function to check if a transform has been set for this tick. The result will be printed to the console.
Exploring Tick Transforms
To better understand the Matplotlib.axis.Tick.is_transform_set() function, it’s important to explore tick transforms in more detail. Tick transforms determine how the tick positions and labels are mapped from data coordinates to display coordinates.
Here’s an example that demonstrates setting a custom transform for a tick:
import matplotlib.pyplot as plt
import matplotlib.transforms as transforms

fig, ax = plt.subplots()
ax.set_title("how2matplotlib.com - Custom Tick Transform")
ax.plot([1, 2, 3, 4], [1, 4, 2, 3])

# Get the first x-axis tick
tick = ax.xaxis.get_major_ticks()[0]

# Create a custom transform
custom_transform = transforms.Affine2D().scale(2, 1) + ax.transData

# Set the custom transform for the tick
tick.set_transform(custom_transform)

# Check if a transform is set for the tick
is_transform_set = tick.is_transform_set()

print(f"Is transform set for the tick after custom transform? {is_transform_set}")

plt.show()
Output:
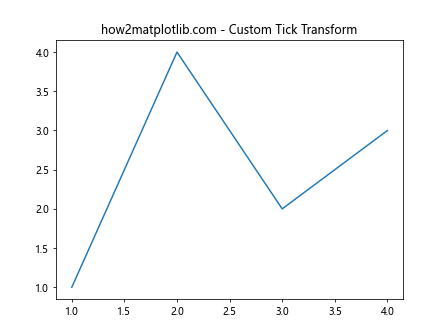
In this example, we create a custom transform that scales the x-axis by a factor of 2. We then set this transform for the first x-axis tick using the set_transform() method. After setting the transform, we use is_transform_set() to verify that the transform has been applied.
Practical Applications of Matplotlib.axis.Tick.is_transform_set()
The Matplotlib.axis.Tick.is_transform_set() function has several practical applications in data visualization and plot customization. Let’s explore some of these applications with examples.
1. Conditional Tick Formatting
One common use case for is_transform_set() is to apply conditional formatting to ticks based on whether a transform has been set. Here’s an example:
import matplotlib.pyplot as plt
import matplotlib.transforms as transforms

fig, ax = plt.subplots()
ax.set_title("how2matplotlib.com - Conditional Tick Formatting")
ax.plot([1, 2, 3, 4], [1, 4, 2, 3])

# Get all x-axis ticks
ticks = ax.xaxis.get_major_ticks()

# Create a custom transform
custom_transform = transforms.Affine2D().scale(2, 1) + ax.transData

# Apply custom transform to even-indexed ticks
for i, tick in enumerate(ticks):
    if i % 2 == 0:
        tick.set_transform(custom_transform)

# Apply conditional formatting
for tick in ticks:
    if tick.is_transform_set():
        tick.label1.set_color('red')
    else:
        tick.label1.set_color('blue')

plt.show()
Output:
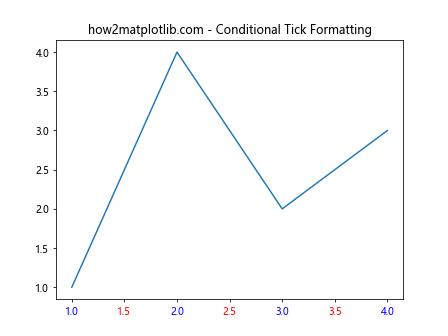
In this example, we apply a custom transform to even-indexed ticks and then use is_transform_set() to conditionally format the tick labels. Ticks with a custom transform are colored red, while others are colored blue.
2. Debugging Tick Transformations
The is_transform_set() function can be useful for debugging tick transformations, especially when working with complex plots. Here’s an example that demonstrates this:
import matplotlib.pyplot as plt
import matplotlib.transforms as transforms

fig, (ax1, ax2) = plt.subplots(1, 2, figsize=(12, 5))
fig.suptitle("how2matplotlib.com - Debugging Tick Transformations")

# Plot 1: Without custom transform
ax1.set_title("Without Custom Transform")
ax1.plot([1, 2, 3, 4], [1, 4, 2, 3])

# Plot 2: With custom transform
ax2.set_title("With Custom Transform")
ax2.plot([1, 2, 3, 4], [1, 4, 2, 3])

# Create a custom transform
custom_transform = transforms.Affine2D().scale(2, 1) + ax2.transData

# Apply custom transform to x-axis ticks of the second plot
for tick in ax2.xaxis.get_major_ticks():
    tick.set_transform(custom_transform)

# Debug tick transformations
for ax in (ax1, ax2):
    print(f"\nDebugging {ax.get_title()}:")
    for i, tick in enumerate(ax.xaxis.get_major_ticks()):
        print(f"Tick {i}: Transform set? {tick.is_transform_set()}")

plt.tight_layout()
plt.show()
Output:
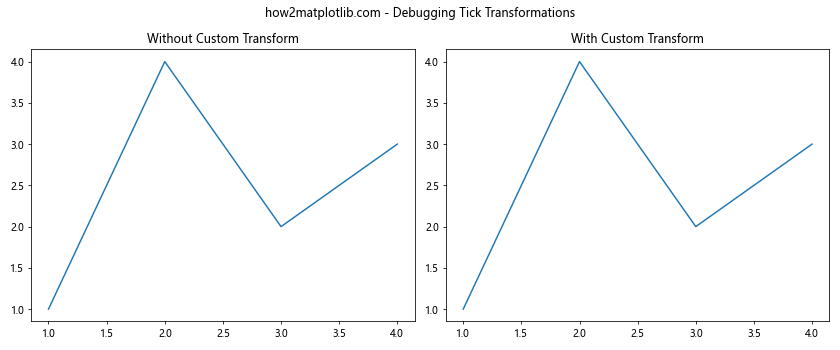
This example creates two side-by-side plots, one with default tick transforms and another with custom transforms. We then use is_transform_set() to debug and verify which ticks have custom transforms applied.
Advanced Usage of Matplotlib.axis.Tick.is_transform_set()
Let’s explore some advanced usage scenarios for the Matplotlib.axis.Tick.is_transform_set() function.
1. Dynamic Tick Transformation
In this example, we’ll create a plot where tick transforms are dynamically updated based on user interaction:
import matplotlib.pyplot as plt
import matplotlib.transforms as transforms

fig, ax = plt.subplots()
ax.set_title("how2matplotlib.com - Dynamic Tick Transformation")
line, = ax.plot([1, 2, 3, 4], [1, 4, 2, 3])

def update_transform(event):
    if event.key == 't':
        for tick in ax.xaxis.get_major_ticks():
            if not tick.is_transform_set():
                custom_transform = transforms.Affine2D().scale(2, 1) + ax.transData
                tick.set_transform(custom_transform)
                tick.label1.set_color('red')
            else:
                tick.set_transform(None)
                tick.label1.set_color('black')
        plt.draw()

fig.canvas.mpl_connect('key_press_event', update_transform)

plt.show()
Output:
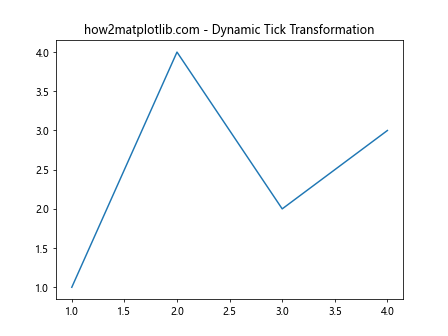
In this interactive example, pressing the ‘t’ key toggles the custom transform for x-axis ticks. The is_transform_set() function is used to determine whether to apply or remove the transform.
2. Selective Tick Transformation
Here’s an example that demonstrates applying transforms to specific ticks based on their values:
import matplotlib.pyplot as plt
import matplotlib.transforms as transforms

fig, ax = plt.subplots()
ax.set_title("how2matplotlib.com - Selective Tick Transformation")
ax.plot([1, 2, 3, 4, 5], [1, 4, 2, 3, 5])

custom_transform = transforms.Affine2D().scale(1.5, 1) + ax.transData

for tick in ax.xaxis.get_major_ticks():
    if float(tick.get_text()) % 2 == 0:
        tick.set_transform(custom_transform)

for tick in ax.xaxis.get_major_ticks():
    if tick.is_transform_set():
        tick.label1.set_color('red')
    else:
        tick.label1.set_color('blue')

plt.show()
In this example, we apply a custom transform only to ticks with even values. The is_transform_set() function is then used to color the tick labels differently based on whether they have a custom transform.
Combining Matplotlib.axis.Tick.is_transform_set() with Other Matplotlib Features
The Matplotlib.axis.Tick.is_transform_set() function can be combined with other Matplotlib features to create more complex and informative visualizations. Let’s explore some examples.
1. Custom Tick Formatters
In this example, we’ll combine is_transform_set() with custom tick formatters:
import matplotlib.pyplot as plt
import matplotlib.transforms as transforms
import matplotlib.ticker as ticker

fig, ax = plt.subplots()
ax.set_title("how2matplotlib.com - Custom Tick Formatters")
ax.plot([1, 2, 3, 4, 5], [1, 4, 2, 3, 5])

custom_transform = transforms.Affine2D().scale(2, 1) + ax.transData

def custom_formatter(x, pos):
    tick = ax.xaxis.get_major_ticks()[pos]
    if tick.is_transform_set():
        return f"[{x:.1f}]"
    return f"{x:.1f}"

ax.xaxis.set_major_formatter(ticker.FuncFormatter(custom_formatter))

for i, tick in enumerate(ax.xaxis.get_major_ticks()):
    if i % 2 == 0:
        tick.set_transform(custom_transform)

plt.show()
Output:
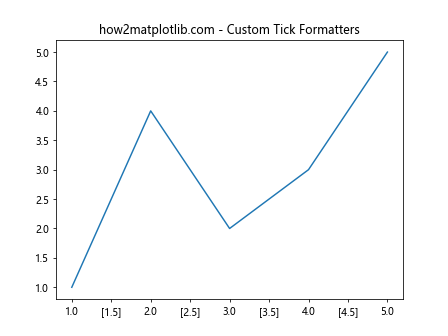
In this example, we create a custom tick formatter that uses is_transform_set() to determine how to format the tick labels. Ticks with a custom transform are enclosed in square brackets.
2. Animated Tick Transformations
Let’s create an animated plot that demonstrates the use of is_transform_set() in a dynamic context:
import matplotlib.pyplot as plt
import matplotlib.transforms as transforms
import matplotlib.animation as animation

fig, ax = plt.subplots()
ax.set_title("how2matplotlib.com - Animated Tick Transformations")
line, = ax.plot([1, 2, 3, 4, 5], [1, 4, 2, 3, 5])

custom_transform = transforms.Affine2D().scale(2, 1) + ax.transData

def animate(frame):
    for i, tick in enumerate(ax.xaxis.get_major_ticks()):
        if i == frame % 5:
            if not tick.is_transform_set():
                tick.set_transform(custom_transform)
                tick.label1.set_color('red')
            else:
                tick.set_transform(None)
                tick.label1.set_color('black')
    return line,

ani = animation.FuncAnimation(fig, animate, frames=20, interval=500, blit=True)

plt.show()
Output:
This animation cycles through the x-axis ticks, applying and removing the custom transform. The is_transform_set() function is used to determine whether to apply or remove the transform for each tick.
Best Practices for Using Matplotlib.axis.Tick.is_transform_set()
When working with the Matplotlib.axis.Tick.is_transform_set() function, it’s important to follow some best practices to ensure your code is efficient and maintainable. Here are some tips:
- Use is_transform_set() for conditional logic: The function is most useful when you need to make decisions based on whether a transform has been applied to a tick.
Combine with other tick methods: is_transform_set() works well in combination with other tick methods like set_transform() and get_transform().
Be aware of performance: While is_transform_set() is generally fast, avoid calling it unnecessarily in tight loops or animations where performance is critical.
Use for debugging: The function can be a valuable tool for debugging complex plots with custom tick transformations.
Consider the entire axis: Remember that is_transform_set() applies to individual ticks, so you may need to check multiple ticks to understand the state of the entire axis.
Let’s see an example that demonstrates these best practices: