Comprehensive Guide to Matplotlib.axis.Tick.get_zorder() Function in Python
Matplotlib.axis.Tick.get_zorder() function in Python is an essential tool for managing the layering of plot elements in Matplotlib. This function allows you to retrieve the zorder value of a tick object, which determines its drawing order relative to other elements in the plot. Understanding and utilizing the get_zorder() function can significantly enhance your ability to create visually appealing and well-organized plots.
Introduction to Matplotlib.axis.Tick.get_zorder()
Matplotlib.axis.Tick.get_zorder() function in Python is a method associated with the Tick objects in Matplotlib. It returns the current zorder value of the tick, which is crucial for determining the drawing order of plot elements. The zorder is a floating-point value that defines the order in which elements are drawn on the plot. Elements with higher zorder values are drawn on top of elements with lower zorder values.
Let’s start with a simple example to demonstrate how to use the get_zorder() function:
import matplotlib.pyplot as plt

fig, ax = plt.subplots()
ax.plot([1, 2, 3, 4], [1, 4, 2, 3], label='how2matplotlib.com')

# Get the zorder of x-axis ticks
x_ticks = ax.xaxis.get_major_ticks()
for tick in x_ticks:
    print(f"X-axis tick zorder: {tick.get_zorder()}")

# Get the zorder of y-axis ticks
y_ticks = ax.yaxis.get_major_ticks()
for tick in y_ticks:
    print(f"Y-axis tick zorder: {tick.get_zorder()}")

plt.legend()
plt.show()
Output:
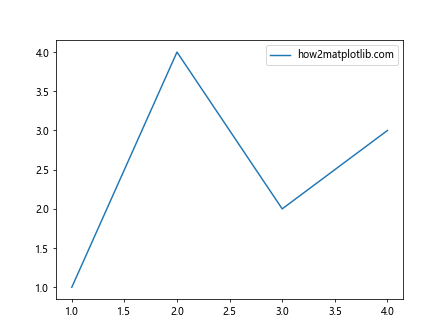
In this example, we create a simple line plot and then use the get_zorder() function to retrieve the zorder values of both x-axis and y-axis ticks. The function is called on each tick object, allowing us to see the default zorder values assigned by Matplotlib.
Understanding the Importance of zorder in Matplotlib
Before diving deeper into the Matplotlib.axis.Tick.get_zorder() function in Python, it’s crucial to understand the concept of zorder and its significance in Matplotlib plots. The zorder determines the drawing order of plot elements, which can greatly affect the visual appearance and clarity of your plots.
Here’s an example that demonstrates the impact of zorder on plot elements:
import matplotlib.pyplot as plt
import numpy as np

fig, ax = plt.subplots()

# Create data
x = np.linspace(0, 10, 100)
y1 = np.sin(x)
y2 = np.cos(x)

# Plot lines with different zorder values
ax.plot(x, y1, color='red', zorder=1, label='Sin (how2matplotlib.com)')
ax.plot(x, y2, color='blue', zorder=2, label='Cos (how2matplotlib.com)')

# Add a horizontal line with lower zorder
ax.axhline(y=0, color='green', linestyle='--', zorder=0, label='Zero line')

# Get and print zorder of plot elements
for line in ax.lines:
    print(f"Line zorder: {line.get_zorder()}")

# Get and print zorder of axis ticks
for tick in ax.xaxis.get_major_ticks():
    print(f"X-axis tick zorder: {tick.get_zorder()}")

plt.legend()
plt.title('Demonstration of zorder in Matplotlib')
plt.show()
Output:
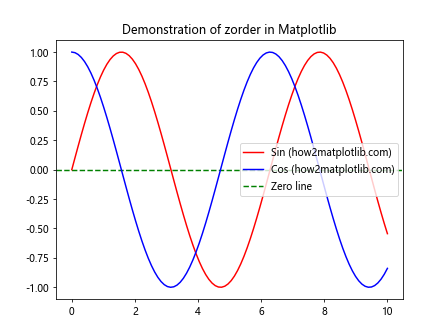
In this example, we create three lines with different zorder values. The horizontal green line has the lowest zorder (0), so it’s drawn first and appears behind the other lines. The red sine curve has a zorder of 1, so it’s drawn next, and the blue cosine curve with a zorder of 2 is drawn last, appearing on top of the other lines.
We also use the get_zorder() function to retrieve and print the zorder values of the plot elements and axis ticks. This helps us understand the default zorder values assigned by Matplotlib and how they affect the layering of elements in the plot.
Exploring the Default zorder Values in Matplotlib
Matplotlib.axis.Tick.get_zorder() function in Python becomes even more useful when we understand the default zorder values assigned to different plot elements. Let’s explore these default values and see how they affect the appearance of our plots.
import matplotlib.pyplot as plt
import numpy as np

fig, ax = plt.subplots()

# Create data
x = np.linspace(0, 10, 100)
y = np.sin(x)

# Plot line
line = ax.plot(x, y, label='Sine wave (how2matplotlib.com)')[0]

# Add scatter points
scatter = ax.scatter(x[::10], y[::10], color='red', label='Scatter points')

# Add text
text = ax.text(5, 0.5, 'how2matplotlib.com', fontsize=12)

# Add patch
rect = plt.Rectangle((4, -0.5), 2, 1, fill=False, edgecolor='green')
ax.add_patch(rect)

# Print zorder values
print(f"Line zorder: {line.get_zorder()}")
print(f"Scatter zorder: {scatter.get_zorder()}")
print(f"Text zorder: {text.get_zorder()}")
print(f"Rectangle zorder: {rect.get_zorder()}")
print(f"Axes zorder: {ax.get_zorder()}")
print(f"Figure zorder: {fig.get_zorder()}")

for tick in ax.xaxis.get_major_ticks():
    print(f"X-axis tick zorder: {tick.get_zorder()}")

plt.legend()
plt.title('Default zorder values in Matplotlib')
plt.show()
Output:
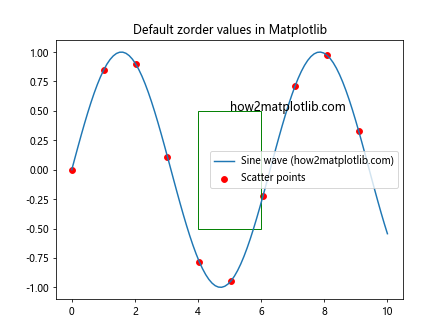
This example creates a plot with various elements (line, scatter points, text, and a rectangle) and uses the get_zorder() function to retrieve their default zorder values. By printing these values, we can see the hierarchy of plot elements in Matplotlib.
Understanding these default values is crucial when working with the Matplotlib.axis.Tick.get_zorder() function in Python, as it helps you make informed decisions about when and how to modify zorder values to achieve the desired layering effect in your plots.
Modifying zorder Values and Using get_zorder()
Now that we understand the default zorder values, let’s explore how to modify them and use the Matplotlib.axis.Tick.get_zorder() function in Python to verify our changes. This is particularly useful when you want to customize the layering of plot elements.
import matplotlib.pyplot as plt
import numpy as np

fig, ax = plt.subplots()

# Create data
x = np.linspace(0, 10, 100)
y1 = np.sin(x)
y2 = np.cos(x)

# Plot lines with custom zorder
line1 = ax.plot(x, y1, color='red', zorder=5, label='Sin (how2matplotlib.com)')[0]
line2 = ax.plot(x, y2, color='blue', zorder=3, label='Cos (how2matplotlib.com)')[0]

# Modify tick zorder
for tick in ax.xaxis.get_major_ticks():
    tick.set_zorder(10)

for tick in ax.yaxis.get_major_ticks():
    tick.set_zorder(10)

# Print zorder values
print(f"Line 1 zorder: {line1.get_zorder()}")
print(f"Line 2 zorder: {line2.get_zorder()}")

for tick in ax.xaxis.get_major_ticks():
    print(f"X-axis tick zorder: {tick.get_zorder()}")

for tick in ax.yaxis.get_major_ticks():
    print(f"Y-axis tick zorder: {tick.get_zorder()}")

plt.legend()
plt.title('Modified zorder values in Matplotlib')
plt.show()
Output:
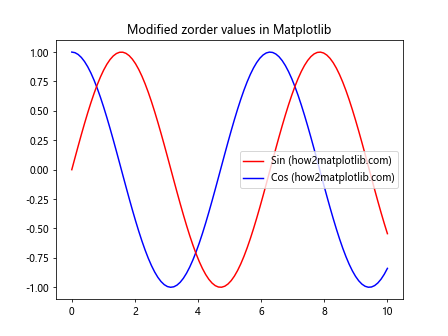
In this example, we set custom zorder values for the two lines and modify the zorder of the axis ticks. We then use the Matplotlib.axis.Tick.get_zorder() function in Python to verify that our changes have been applied correctly. This demonstrates how you can control the layering of plot elements and ensure that certain elements (in this case, the ticks) are always drawn on top of others.
Using get_zorder() for Conditional Formatting
The Matplotlib.axis.Tick.get_zorder() function in Python can be particularly useful when you want to apply conditional formatting based on the current zorder of plot elements. Let’s explore an example where we use this function to highlight ticks with a specific zorder range.
import matplotlib.pyplot as plt
import numpy as np

fig, ax = plt.subplots()

# Create data
x = np.linspace(0, 10, 100)
y = np.sin(x)

# Plot line
ax.plot(x, y, label='Sine wave (how2matplotlib.com)')

# Modify tick zorder randomly
for tick in ax.xaxis.get_major_ticks() + ax.yaxis.get_major_ticks():
    tick.set_zorder(np.random.randint(1, 10))

# Highlight ticks with zorder between 5 and 8
for tick in ax.xaxis.get_major_ticks() + ax.yaxis.get_major_ticks():
    if 5 <= tick.get_zorder() <= 8:
        tick.label1.set_color('red')
        tick.label1.set_fontweight('bold')

# Print zorder values
for tick in ax.xaxis.get_major_ticks():
    print(f"X-axis tick zorder: {tick.get_zorder()}")

for tick in ax.yaxis.get_major_ticks():
    print(f"Y-axis tick zorder: {tick.get_zorder()}")

plt.legend()
plt.title('Conditional Formatting Based on zorder')
plt.show()
Output:
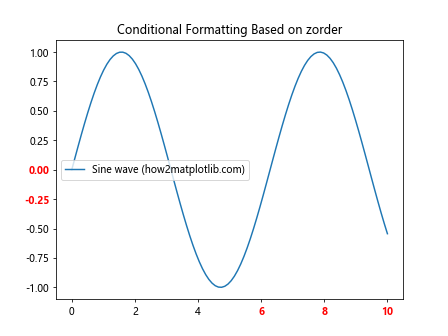
In this example, we randomly assign zorder values to the ticks and then use the Matplotlib.axis.Tick.get_zorder() function in Python to check each tick's zorder. If the zorder is between 5 and 8, we highlight the tick label by changing its color to red and making it bold. This demonstrates how you can use get_zorder() to create dynamic, condition-based formatting in your plots.
Comparing zorder Values of Different Plot Elements
The Matplotlib.axis.Tick.get_zorder() function in Python is not limited to ticks alone. We can use similar methods to compare the zorder values of various plot elements. This can be helpful when debugging layering issues or when you want to ensure that certain elements are always drawn in a specific order relative to others.
import matplotlib.pyplot as plt
import numpy as np

fig, ax = plt.subplots()

# Create data
x = np.linspace(0, 10, 100)
y = np.sin(x)

# Plot line
line = ax.plot(x, y, label='Sine wave (how2matplotlib.com)')[0]

# Add scatter points
scatter = ax.scatter(x[::10], y[::10], color='red', label='Scatter points')

# Add text
text = ax.text(5, 0.5, 'how2matplotlib.com', fontsize=12)

# Add patch
rect = plt.Rectangle((4, -0.5), 2, 1, fill=False, edgecolor='green')
ax.add_patch(rect)

# Compare zorder values
elements = [line, scatter, text, rect, ax.xaxis, ax.yaxis]
element_names = ['Line', 'Scatter', 'Text', 'Rectangle', 'X-axis', 'Y-axis']

for element, name in zip(elements, element_names):
    if hasattr(element, 'get_zorder'):
        print(f"{name} zorder: {element.get_zorder()}")
    elif hasattr(element, 'get_major_ticks'):
        print(f"{name} tick zorder: {element.get_major_ticks()[0].get_zorder()}")

plt.legend()
plt.title('Comparing zorder of Different Plot Elements')
plt.show()
Output:
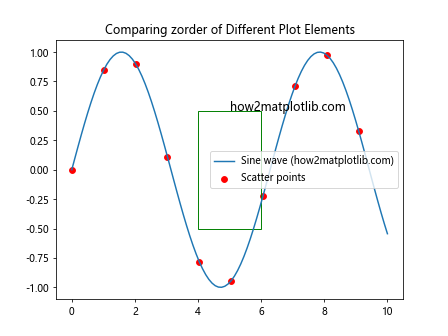
In this example, we create various plot elements and then use their respective get_zorder() methods (or the Matplotlib.axis.Tick.get_zorder() function in Python for axis ticks) to compare their zorder values. This comparison helps us understand the default layering of different elements in a Matplotlib plot and can be useful when deciding how to adjust zorder values for optimal visual presentation.
Using get_zorder() in Custom Plotting Functions
When creating custom plotting functions, the Matplotlib.axis.Tick.get_zorder() function in Python can be a valuable tool for maintaining consistent layering across different plots. Let's create a custom function that uses get_zorder() to ensure that certain elements are always drawn on top.
import matplotlib.pyplot as plt
import numpy as np

def custom_plot(x, y, highlight_range=None):
    fig, ax = plt.subplots()

    # Plot line
    line = ax.plot(x, y, label='Data (how2matplotlib.com)')[0]

    # Highlight range if specified
    if highlight_range:
        start, end = highlight_range
        highlight = ax.axvspan(start, end, alpha=0.3, color='yellow')

        # Ensure highlight is below the line
        highlight.set_zorder(line.get_zorder() - 1)

    # Ensure ticks are on top
    for tick in ax.xaxis.get_major_ticks() + ax.yaxis.get_major_ticks():
        tick.set_zorder(line.get_zorder() + 1)

    # Print zorder values
    print(f"Line zorder: {line.get_zorder()}")
    if highlight_range:
        print(f"Highlight zorder: {highlight.get_zorder()}")
    print(f"Tick zorder: {ax.xaxis.get_major_ticks()[0].get_zorder()}")

    plt.legend()
    plt.title('Custom Plot with Consistent Layering')
    plt.show()

# Use the custom plotting function
x = np.linspace(0, 10, 100)
y = np.sin(x)
custom_plot(x, y, highlight_range=(3, 7))
In this example, we create a custom plotting function that uses the Matplotlib.axis.Tick.get_zorder() function in Python to ensure consistent layering. The function plots a line, optionally adds a highlighted range, and then sets the zorder of the ticks to be higher than the line. This guarantees that the ticks are always drawn on top, regardless of the other elements in the plot.
Animating zorder Changes
The Matplotlib.axis.Tick.get_zorder() function in Python can also be useful when creating animations that involve changing the layering of plot elements. Let's create an example that animates the zorder of plot elements, using get_zorder() to track and display the changes.
import matplotlib.pyplot as plt
import matplotlib.animation as animation
import numpy as np

fig, ax = plt.subplots()

# Create data
x = np.linspace(0, 10, 100)
y1 = np.sin(x)
y2 = np.cos(x)

# Plot lines
line1, = ax.plot(x, y1, color='red', label='Sin (how2matplotlib.com)')
line2, = ax.plot(x, y2, color='blue', label='Cos (how2matplotlib.com)')

# Add text to display zorder
text = ax.text(0.02, 0.98, '', transform=ax.transAxes, va='top')

def animate(frame):
    # Change zorder of lines
    line1.set_zorder(np.sin(frame/10) + 1)
    line2.set_zorder(np.cos(frame/10) + 1)

    # Update text
    text.set_text(f'Sin zorder: {line1.get_zorder():.2f}\nCos zorder: {line2.get_zorder():.2f}')

    return line1, line2, text

# Create animation
anim = animation.FuncAnimation(fig, animate, frames=200, interval=50, blit=True)

plt.legend()
plt.title('Animating zorder Changes')
plt.show()
Output:
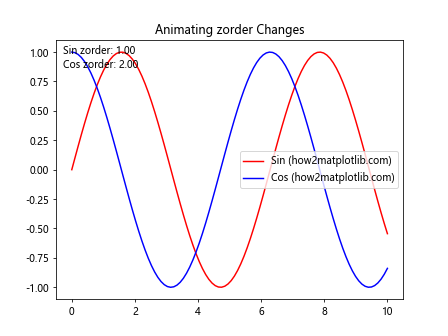
In this example, we create an animation that continuously changes the zorder of two lines. The Matplotlib.axis.Tick.get_zorder() function in Python is used to retrieve the current zorder values, which are then displayed on the plot. This demonstrates how get_zorder() can be used in dynamic visualizations to track and display layering information.
Handling zorder in Subplots
When working with subplots, the Matplotlib.axis.Tick.get_zorder() function in Python can help ensure consistent layering across different axes. Let's explore an example that demonstrates how to manage zorder in a subplot layout.
import matplotlib.pyplot as plt
import numpy as np

fig, (ax1, ax2) = plt.subplots(1, 2, figsize=(12, 5))

# Create data
x = np.linspace(0, 10, 100)
y1 = np.sin(x)
y2 = np.cos(x)

# Plot on first subplot
line1 = ax1.plot(x, y1, color='red', label='Sin (how2matplotlib.com)')[0]
ax1.set_title('Subplot 1')

# Plot on second subplot
line2 = ax2.plot(x, y2, color='blue', label='Cos (how2matplotlib.com)')[0]
ax2.set_title('Subplot 2')

# Set consistent zorder for lines
max_zorder = max(line1.get_zorder(), line2.get_zorder())
line1.set_zorder(max_zorder)
line2.set_zorder(max_zorder)

# Ensure ticks are on top in both subplots
for ax in (ax1, ax2):
    for tick in ax.xaxis.get_major_ticks() + ax.yaxis.get_major_ticks():
        tick.set_zorder(max_zorder + 1)

# Print zorder values
print(f"Subplot 1 line zorder: {line1.get_zorder()}")
print(f"Subplot 2 line zorder: {line2.get_zorder()}")
print(f"Subplot 1 tick zorder: {ax1.xaxis.get_major_ticks()[0].get_zorder()}")
print(f"Subplot 2 tick zorder: {ax2.xaxis.get_major_ticks()[0].get_zorder()}")

plt.tight_layout()
plt.show()
Output:
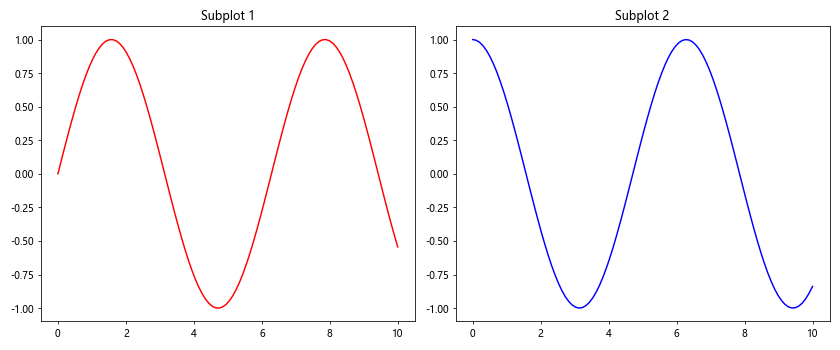
In this example, we create two subplots and use the Matplotlib.axis.Tick.get_zorder() function in Python to ensure that the lines and ticks have consistent zorder values across both subplots. This approach helps maintain a uniform appearance and behavior across multiple axes.
Using get_zorder() with 3D Plots
The Matplotlib.axis.Tick.get_zorder() function in Python can also be useful when working with 3D plots. Although the concept of zorder is slightly different in 3D, we can still use get_zorder() to understand and manipulate the drawing order of elements.
import matplotlib.pyplot as plt
from mpl_toolkits.mplot3d import Axes3D
import numpy as np

fig = plt.figure()
ax = fig.add_subplot(111, projection='3d')

# Create data
x = np.linspace(-5, 5, 100)
y = np.linspace(-5, 5, 100)
X, Y = np.meshgrid(x, y)
Z1 = np.sin(np.sqrt(X**2 + Y**2))
Z2 = np.cos(np.sqrt(X**2 + Y**2))

# Plot surfaces
surf1 = ax.plot_surface(X, Y, Z1, cmap='viridis', alpha=0.7, label='Sin (how2matplotlib.com)')
surf2 = ax.plot_surface(X, Y, Z2, cmap='plasma', alpha=0.7, label='Cos (how2matplotlib.com)')

# Print zorder values
print(f"Surface 1 zorder: {surf1.get_zorder()}")
print(f"Surface 2 zorder: {surf2.get_zorder()}")

# Print tick zorder values
for axis in (ax.xaxis, ax.yaxis, ax.zaxis):
    print(f"{axis.axis_name.upper()}-axis tick zorder: {axis.get_major_ticks()[0].get_zorder()}")

ax.set_xlabel('X')
ax.set_ylabel('Y')
ax.set_zlabel('Z')
ax.set_title('3D Plot with zorder Information')

plt.show()
Output:
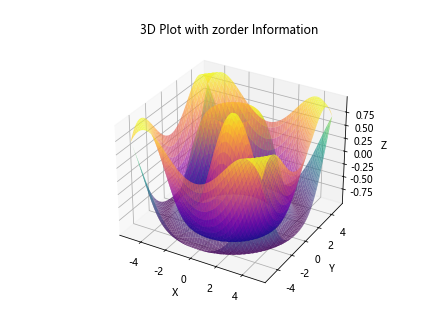
In this example, we create a 3D plot with two surfaces and use the Matplotlib.axis.Tick.get_zorder() function in Python to retrieve the zorder values of the surfaces and axis ticks. While zorder doesn't directly control the drawing order in 3D plots (which is determined by depth), it can still provide useful information about how Matplotlib is handling these elements.
Troubleshooting Layering Issues with get_zorder()
The Matplotlib.axis.Tick.get_zorder() function in Python can be an invaluable tool when troubleshooting layering issues in your plots. Let's look at an example where we use get_zorder() to diagnose and fix a layering problem.
import matplotlib.pyplot as plt
import numpy as np

fig, (ax1, ax2) = plt.subplots(1, 2, figsize=(12, 5))

# Create data
x = np.linspace(0, 10, 100)
y = np.sin(x)

# Plot on first subplot (with layering issue)
ax1.plot(x, y, color='blue', label='Sine wave (how2matplotlib.com)')
ax1.fill_between(x, 0, y, alpha=0.3, color='blue')
ax1.set_title('Before: Layering Issue')

# Plot on second subplot (fixed)
line = ax2.plot(x, y, color='blue', label='Sine wave (how2matplotlib.com)')[0]
fill = ax2.fill_between(x, 0, y, alpha=0.3, color='blue')
ax2.set_title('After: Fixed Layering')

# Fix layering in second subplot
line.set_zorder(fill.get_zorder() + 1)

# Print zorder values
print("Before:")
print(f"Line zorder: {ax1.lines[0].get_zorder()}")
print(f"Fill zorder: {ax1.collections[0].get_zorder()}")

print("\nAfter:")
print(f"Line zorder: {line.get_zorder()}")
print(f"Fill zorder: {fill.get_zorder()}")

# Ensure ticks are on top
for ax in (ax1, ax2):
    for tick in ax.xaxis.get_major_ticks() + ax.yaxis.get_major_ticks():
        tick.set_zorder(max(ax.lines + ax.collections, key=lambda x: x.get_zorder()).get_zorder() + 1)

print(f"\nTick zorder: {ax2.xaxis.get_major_ticks()[0].get_zorder()}")

plt.tight_layout()
plt.show()
Output:
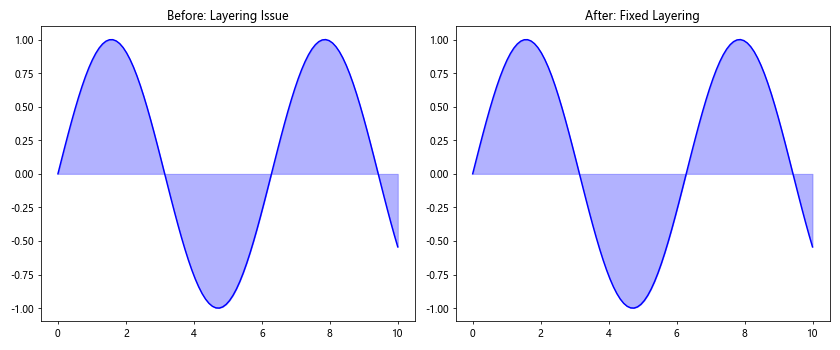
In this example, we create two subplots: one with a layering issue (the fill area is drawn over the line) and one where we fix the issue using the Matplotlib.axis.Tick.get_zorder() function in Python. By retrieving and comparing the zorder values of different elements, we can identify the cause of the layering problem and adjust the zorder accordingly.
Advanced zorder Manipulation with get_zorder()
The Matplotlib.axis.Tick.get_zorder() function in Python can be used in more advanced scenarios to create complex layering effects. Let's explore an example where we create a plot with multiple overlapping elements and use get_zorder() to manage their layering dynamically.
import matplotlib.pyplot as plt
import numpy as np

fig, ax = plt.subplots(figsize=(10, 6))

# Create data
x = np.linspace(0, 10, 100)
y1 = np.sin(x)
y2 = np.cos(x)
y3 = np.tan(x)

# Plot lines
line1 = ax.plot(x, y1, color='red', label='Sin (how2matplotlib.com)')[0]
line2 = ax.plot(x, y2, color='blue', label='Cos (how2matplotlib.com)')[0]
line3 = ax.plot(x, y3, color='green', label='Tan (how2matplotlib.com)')[0]

# Add scatter points
scatter = ax.scatter(x[::10], y1[::10], color='purple', label='Scatter')

# Add text annotations
texts = []
for i in range(5):
    text = ax.text(np.random.uniform(0, 10), np.random.uniform(-1, 1), f'Text {i+1}', fontsize=12)
    texts.append(text)

# Function to cycle zorder
def cycle_zorder(elements):
    zorders = [elem.get_zorder() for elem in elements]
    zorders = zorders[1:] + [zorders[0]]
    for elem, z in zip(elements, zorders):
        elem.set_zorder(z)

# Cycle zorder of lines
cycle_zorder([line1, line2, line3])

# Set scatter points above lines
scatter.set_zorder(max(line1.get_zorder(), line2.get_zorder(), line3.get_zorder()) + 1)

# Randomly set text zorder
for text in texts:
    text.set_zorder(np.random.randint(1, 10))

# Ensure ticks are on top
for tick in ax.xaxis.get_major_ticks() + ax.yaxis.get_major_ticks():
    tick.set_zorder(max([elem.get_zorder() for elem in ax.get_children() if hasattr(elem, 'get_zorder')]) + 1)

# Print zorder values
print(f"Line 1 zorder: {line1.get_zorder()}")
print(f"Line 2 zorder: {line2.get_zorder()}")
print(f"Line 3 zorder: {line3.get_zorder()}")
print(f"Scatter zorder: {scatter.get_zorder()}")
for i, text in enumerate(texts):
    print(f"Text {i+1} zorder: {text.get_zorder()}")
print(f"Tick zorder: {ax.xaxis.get_major_ticks()[0].get_zorder()}")

plt.legend()
plt.title('Advanced zorder Manipulation')
plt.show()
Output:
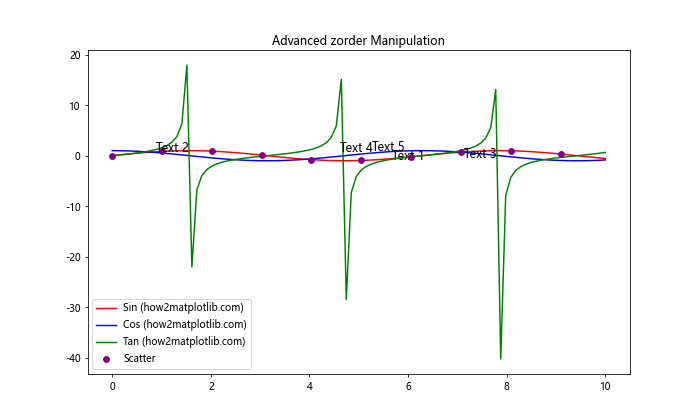
In this advanced example, we create a plot with multiple lines, scatter points, and text annotations. We use the Matplotlib.axis.Tick.get_zorder() function in Python to implement a custom zorder cycling function for the lines, set the scatter points above the lines, randomly assign zorder to text elements, and ensure that ticks are always on top. This demonstrates how get_zorder() can be used to create complex and dynamic layering effects in Matplotlib plots.
Conclusion
The Matplotlib.axis.Tick.get_zorder() function in Python is a powerful tool for managing the layering of plot elements in Matplotlib. Throughout this article, we've explored various aspects of this function and its applications:
- We introduced the basic concept of zorder and how to use get_zorder() to retrieve zorder values.
- We examined the default zorder values assigned by Matplotlib to different plot elements.
- We demonstrated how to modify zorder values and use get_zorder() to verify changes.
- We explored conditional formatting based on zorder values.
- We compared zorder values across different plot elements.
- We incorporated get_zorder() into custom plotting functions for consistent layering.
- We created animations that dynamically change zorder values.
- We managed zorder in subplot layouts.
- We applied get_zorder() to 3D plots.
- We used get_zorder() for troubleshooting layering issues.
- Finally, we explored advanced zorder manipulation techniques.