Comprehensive Guide to Matplotlib.axis.Tick.get_window_extent() Function in Python
Matplotlib.axis.Tick.get_window_extent() function in Python is a powerful tool for manipulating and customizing tick labels in Matplotlib plots. This function is essential for determining the bounding box of a tick label in display coordinates. In this comprehensive guide, we’ll explore the Matplotlib.axis.Tick.get_window_extent() function in depth, covering its usage, parameters, and various applications in data visualization.
Understanding the Basics of Matplotlib.axis.Tick.get_window_extent()
The Matplotlib.axis.Tick.get_window_extent() function is a method of the Tick class in Matplotlib’s axis module. It returns the bounding box of the tick label in display coordinates. This information is crucial for precise positioning and formatting of tick labels, especially when dealing with complex plots or custom layouts.
Let’s start with a simple example to demonstrate the basic usage of Matplotlib.axis.Tick.get_window_extent():
import matplotlib.pyplot as plt
import numpy as np

# Create a simple plot
fig, ax = plt.subplots()
x = np.linspace(0, 10, 100)
y = np.sin(x)
ax.plot(x, y)

# Get the bounding box of the first x-axis tick label
tick = ax.xaxis.get_major_ticks()[0]
bbox = tick.get_window_extent()

print(f"Bounding box of the first x-axis tick label: {bbox}")
plt.title("How2matplotlib.com - Basic Usage of get_window_extent()")
plt.show()
Output:
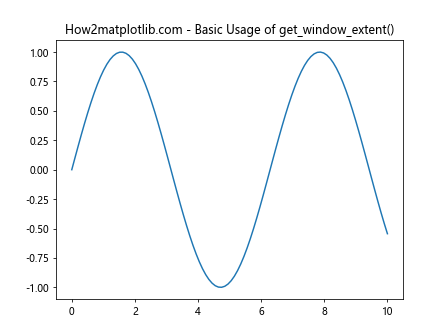
In this example, we create a simple sine wave plot and use Matplotlib.axis.Tick.get_window_extent() to get the bounding box of the first x-axis tick label. The function returns a Bbox object, which contains the coordinates of the bounding box in display units.
Applications of Matplotlib.axis.Tick.get_window_extent()
Now that we understand the basics of Matplotlib.axis.Tick.get_window_extent(), let’s explore some practical applications of this function in data visualization.
1. Adjusting Tick Label Positions
One common use case for Matplotlib.axis.Tick.get_window_extent() is adjusting the position of tick labels to avoid overlapping or to create custom layouts. Here’s an example:
import matplotlib.pyplot as plt
import numpy as np

fig, ax = plt.subplots(figsize=(10, 6))
x = np.linspace(0, 10, 11)
y = np.random.rand(11)
ax.bar(x, y)

# Adjust x-axis tick label positions
for tick in ax.xaxis.get_major_ticks():
    bbox = tick.get_window_extent()
    tick.label.set_position((0, -bbox.height * 1.2))

plt.title("How2matplotlib.com - Adjusting Tick Label Positions")
plt.tight_layout()
plt.show()
In this example, we use Matplotlib.axis.Tick.get_window_extent() to get the height of each x-axis tick label and adjust its position accordingly. This technique can be useful when dealing with long tick labels or when you want to create more space between the axis and the labels.
2. Creating Custom Tick Layouts
Matplotlib.axis.Tick.get_window_extent() can be used to create custom tick layouts, such as alternating tick label positions. Here’s an example:
import matplotlib.pyplot as plt
import numpy as np

fig, ax = plt.subplots(figsize=(12, 6))
x = np.linspace(0, 20, 21)
y = np.random.rand(21)
ax.plot(x, y, marker='o')

# Create alternating tick label positions
for i, tick in enumerate(ax.xaxis.get_major_ticks()):
    bbox = tick.get_window_extent()
    if i % 2 == 0:
        tick.label.set_position((0, -bbox.height * 1.5))
    else:
        tick.label.set_position((0, -bbox.height * 0.5))

plt.title("How2matplotlib.com - Custom Tick Layout")
plt.tight_layout()
plt.show()
This example demonstrates how to use Matplotlib.axis.Tick.get_window_extent() to create an alternating pattern of tick label positions, improving readability for dense x-axis labels.
3. Detecting Overlapping Tick Labels
Matplotlib.axis.Tick.get_window_extent() can be used to detect and handle overlapping tick labels. Here’s an example that removes overlapping labels:
import matplotlib.pyplot as plt
import numpy as np

fig, ax = plt.subplots(figsize=(10, 6))
x = np.linspace(0, 10, 50)
y = np.random.rand(50)
ax.plot(x, y)

# Detect and remove overlapping tick labels
prev_bbox = None
for tick in ax.xaxis.get_major_ticks():
    bbox = tick.get_window_extent()
    if prev_bbox is not None and bbox.x0 < prev_bbox.x1:
        tick.label.set_visible(False)
    else:
        prev_bbox = bbox

plt.title("How2matplotlib.com - Detecting Overlapping Tick Labels")
plt.tight_layout()
plt.show()
Output:
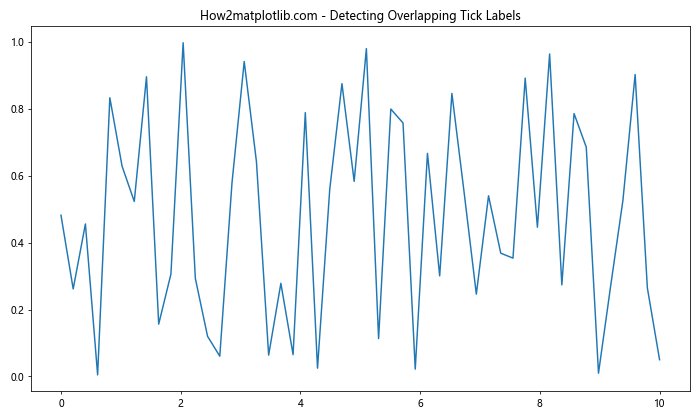
In this example, we use Matplotlib.axis.Tick.get_window_extent() to check if the current tick label overlaps with the previous one. If an overlap is detected, we hide the current label to improve readability.
4. Customizing Tick Label Appearance Based on Position
Matplotlib.axis.Tick.get_window_extent() can be used to customize the appearance of tick labels based on their position. Here's an example that changes the color of tick labels based on their x-coordinate:
import matplotlib.pyplot as plt
import numpy as np

fig, ax = plt.subplots(figsize=(12, 6))
x = np.linspace(0, 10, 11)
y = np.random.rand(11)
ax.bar(x, y)

# Customize tick label appearance based on position
for tick in ax.xaxis.get_major_ticks():
    bbox = tick.get_window_extent()
    if bbox.x0 < fig.get_figwidth() * fig.dpi / 2:
        tick.label.set_color('blue')
    else:
        tick.label.set_color('red')

plt.title("How2matplotlib.com - Customizing Tick Label Appearance")
plt.tight_layout()
plt.show()
This example demonstrates how to use Matplotlib.axis.Tick.get_window_extent() to change the color of tick labels based on their position relative to the center of the plot.
Advanced Techniques with Matplotlib.axis.Tick.get_window_extent()
Now that we've covered the basics and some common applications, let's explore some advanced techniques using Matplotlib.axis.Tick.get_window_extent().
1. Creating Custom Tick Formatters
Matplotlib.axis.Tick.get_window_extent() can be used in combination with custom tick formatters to create more complex label layouts. Here's an example that adds units to tick labels based on their position:
import matplotlib.pyplot as plt
import numpy as np

class CustomFormatter:
    def __call__(self, x, pos=None):
        bbox = plt.gca().xaxis.get_major_ticks()[pos].get_window_extent()
        if bbox.x0 < plt.gcf().get_figwidth() * plt.gcf().dpi / 2:
            return f"{x:.1f} km"
        else:
            return f"{x:.1f} mi"

fig, ax = plt.subplots(figsize=(12, 6))
x = np.linspace(0, 10, 11)
y = np.random.rand(11)
ax.plot(x, y, marker='o')

ax.xaxis.set_major_formatter(CustomFormatter())

plt.title("How2matplotlib.com - Custom Tick Formatter")
plt.tight_layout()
plt.show()
Output:
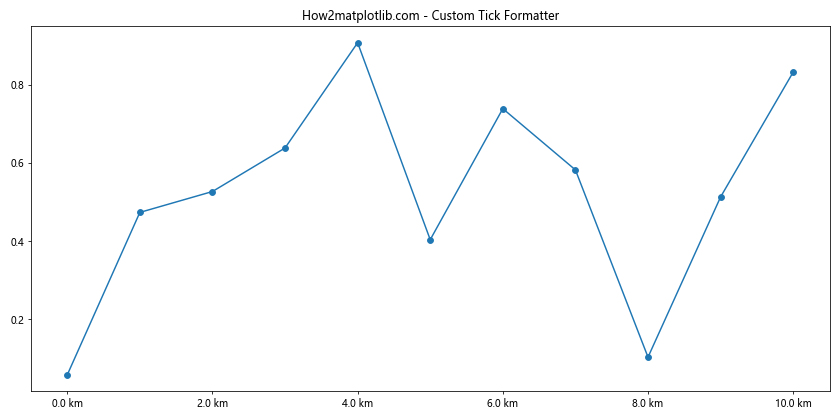
In this example, we create a custom formatter that adds different units to tick labels based on their position, using Matplotlib.axis.Tick.get_window_extent() to determine the label's location.
2. Dynamic Tick Label Rotation
Matplotlib.axis.Tick.get_window_extent() can be used to dynamically rotate tick labels based on their content and position. Here's an example:
import matplotlib.pyplot as plt
import numpy as np

fig, ax = plt.subplots(figsize=(12, 6))
x = np.arange(10)
y = np.random.rand(10)
ax.bar(x, y)

ax.set_xticklabels([f"Long Label {i}" for i in range(10)])

for tick in ax.xaxis.get_major_ticks():
    bbox = tick.get_window_extent()
    if bbox.width > 50:  # Rotate labels wider than 50 pixels
        tick.label.set_rotation(45)
        tick.label.set_ha('right')

plt.title("How2matplotlib.com - Dynamic Tick Label Rotation")
plt.tight_layout()
plt.show()
Output:
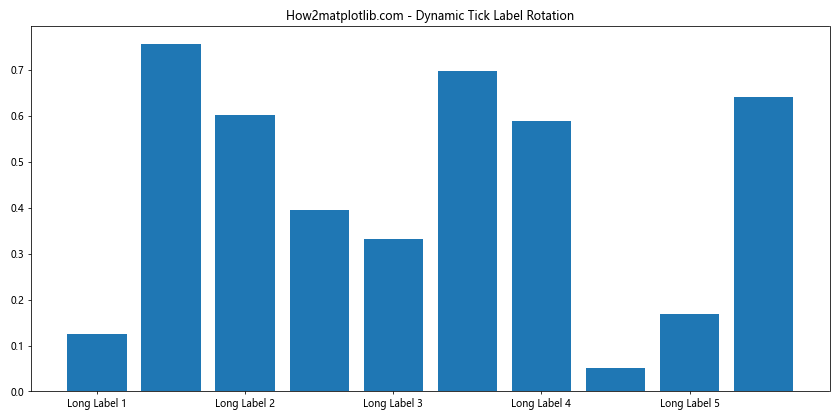
This example demonstrates how to use Matplotlib.axis.Tick.get_window_extent() to determine the width of tick labels and rotate them if they exceed a certain width, improving readability for long labels.
3. Creating Multi-line Tick Labels
Matplotlib.axis.Tick.get_window_extent() can be used to create multi-line tick labels when space is limited. Here's an example:
import matplotlib.pyplot as plt
import numpy as np

fig, ax = plt.subplots(figsize=(12, 6))
x = np.arange(5)
y = np.random.rand(5)
ax.bar(x, y)

long_labels = ["Very Long Label 1", "Very Long Label 2", "Very Long Label 3", "Very Long Label 4", "Very Long Label 5"]

for i, tick in enumerate(ax.xaxis.get_major_ticks()):
    bbox = tick.get_window_extent()
    if bbox.width > 60:  # Split labels wider than 60 pixels
        words = long_labels[i].split()
        tick.label.set_text('\n'.join([' '.join(words[:2]), ' '.join(words[2:])]))

plt.title("How2matplotlib.com - Multi-line Tick Labels")
plt.tight_layout()
plt.show()
Output:
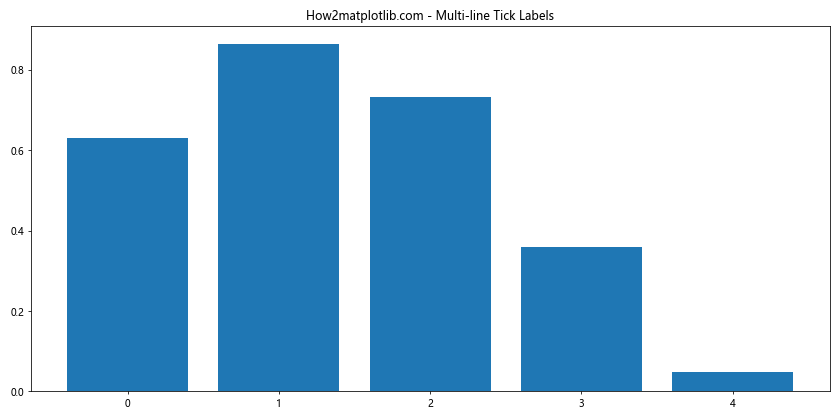
In this example, we use Matplotlib.axis.Tick.get_window_extent() to determine if a tick label is too wide and split it into multiple lines if necessary.
4. Creating Custom Tick Label Backgrounds
Matplotlib.axis.Tick.get_window_extent() can be used to create custom backgrounds for tick labels. Here's an example that adds a background color to alternate tick labels:
import matplotlib.pyplot as plt
import numpy as np
from matplotlib.patches import Rectangle

fig, ax = plt.subplots(figsize=(12, 6))
x = np.linspace(0, 10, 11)
y = np.random.rand(11)
ax.plot(x, y, marker='o')

for i, tick in enumerate(ax.xaxis.get_major_ticks()):
    bbox = tick.get_window_extent()
    if i % 2 == 0:
        rect = Rectangle((bbox.x0, bbox.y0), bbox.width, bbox.height,
                         facecolor='lightgray', edgecolor='none', alpha=0.5)
        ax.add_patch(rect)

plt.title("How2matplotlib.com - Custom Tick Label Backgrounds")
plt.tight_layout()
plt.show()
Output:
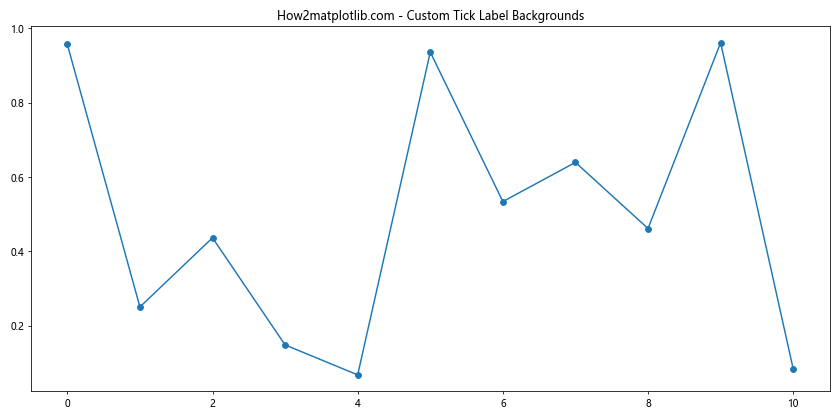
This example demonstrates how to use Matplotlib.axis.Tick.get_window_extent() to add background colors to alternate tick labels, creating a visually appealing pattern.
Best Practices and Optimization Tips
When working with Matplotlib.axis.Tick.get_window_extent(), keep the following best practices and optimization tips in mind:
- Cache results: If you're performing multiple operations on tick labels, consider caching the results of Matplotlib.axis.Tick.get_window_extent() to avoid unnecessary recalculations.
Use tight_layout(): Always use plt.tight_layout() or fig.tight_layout() to ensure that your plot adjusts properly after modifying tick labels.
Be mindful of performance: Matplotlib.axis.Tick.get_window_extent() can be computationally expensive when used on large numbers of ticks. Consider using it selectively or optimizing your code if performance becomes an issue.
Consider alternative methods: For some use cases, alternative methods like plt.xticks() or ax.set_xticks() might be more appropriate and efficient.
Test on different screen sizes: The results of Matplotlib.axis.Tick.get_window_extent() can vary depending on the screen size and DPI. Test your visualizations on different devices to ensure consistency.
Common Pitfalls and How to Avoid Them
When working with Matplotlib.axis.Tick.get_window_extent(), be aware of these common pitfalls: