Comprehensive Guide to Matplotlib.axis.Tick.findobj() Function in Python
Matplotlib.axis.Tick.findobj() function in Python is a powerful tool for locating and manipulating objects within Matplotlib plots. This function is part of the Matplotlib library, which is widely used for creating static, animated, and interactive visualizations in Python. The findobj() method is specifically associated with the Tick class in Matplotlib’s axis module, allowing users to search for and retrieve objects that meet specific criteria within a tick object’s hierarchy.
In this extensive guide, we’ll explore the Matplotlib.axis.Tick.findobj() function in depth, covering its syntax, parameters, return values, and various use cases. We’ll also provide numerous examples to illustrate how this function can be applied in different scenarios, making it easier for you to incorporate it into your own data visualization projects.
Understanding the Basics of Matplotlib.axis.Tick.findobj()
Matplotlib.axis.Tick.findobj() function in Python is designed to search for objects that match certain criteria within a Tick object’s hierarchy. This function is particularly useful when you need to locate specific elements within a plot for further manipulation or customization.
The basic syntax of the findobj() function is as follows:
import matplotlib.pyplot as plt

fig, ax = plt.subplots()
ax.set_title("how2matplotlib.com")
tick = ax.xaxis.get_major_ticks()[0]
found_objects = tick.findobj(match=None, include_self=True)

print(found_objects)
plt.show()
Output:
In this example, we create a simple plot and access one of the major ticks on the x-axis. We then use the findobj() method to search for objects within that tick’s hierarchy. The function returns a list of objects that match the specified criteria.
Parameters of Matplotlib.axis.Tick.findobj()
The Matplotlib.axis.Tick.findobj() function in Python accepts two parameters:
- match: This parameter specifies the criteria for matching objects. It can be None, a class, a function, or a string.
- include_self: A boolean value that determines whether to include the Tick object itself in the search results.
Let’s explore these parameters in more detail:
The ‘match’ Parameter
The ‘match’ parameter is versatile and can accept different types of input:
- None: When set to None, all objects in the hierarchy are returned.
import matplotlib.pyplot as plt

fig, ax = plt.subplots()
ax.set_title("how2matplotlib.com")
tick = ax.xaxis.get_major_ticks()[0]
all_objects = tick.findobj(match=None)

print(all_objects)
plt.show()
Output:
- Class: When a class is provided, the function returns all instances of that class in the hierarchy.
import matplotlib.pyplot as plt
from matplotlib.text import Text

fig, ax = plt.subplots()
ax.set_title("how2matplotlib.com")
tick = ax.xaxis.get_major_ticks()[0]
text_objects = tick.findobj(match=Text)

print(text_objects)
plt.show()
Output:
- Function: A custom function can be used to define matching criteria.
import matplotlib.pyplot as plt

def is_visible(obj):
    return hasattr(obj, 'get_visible') and obj.get_visible()

fig, ax = plt.subplots()
ax.set_title("how2matplotlib.com")
tick = ax.xaxis.get_major_ticks()[0]
visible_objects = tick.findobj(match=is_visible)

print(visible_objects)
plt.show()
Output:
- String: A string can be used to match objects by their class name.
import matplotlib.pyplot as plt

fig, ax = plt.subplots()
ax.set_title("how2matplotlib.com")
tick = ax.xaxis.get_major_ticks()[0]
line_objects = tick.findobj(match='Line2D')

print(line_objects)
plt.show()
The ‘include_self’ Parameter
The ‘include_self’ parameter determines whether the Tick object itself should be included in the search results:
import matplotlib.pyplot as plt

fig, ax = plt.subplots()
ax.set_title("how2matplotlib.com")
tick = ax.xaxis.get_major_ticks()[0]

# Include the Tick object itself
with_self = tick.findobj(include_self=True)

# Exclude the Tick object
without_self = tick.findobj(include_self=False)

print("With self:", with_self)
print("Without self:", without_self)
plt.show()
Output:
Practical Applications of Matplotlib.axis.Tick.findobj()
Now that we understand the basics of the Matplotlib.axis.Tick.findobj() function in Python, let’s explore some practical applications and use cases.
Customizing Tick Labels
One common use of findobj() is to locate and customize tick labels:
import matplotlib.pyplot as plt

fig, ax = plt.subplots()
ax.set_title("how2matplotlib.com")
ax.plot([1, 2, 3, 4], [1, 4, 2, 3])

for tick in ax.xaxis.get_major_ticks():
    label = tick.findobj(plt.Text)[0]
    label.set_fontweight('bold')
    label.set_fontsize(14)

plt.show()
Output:
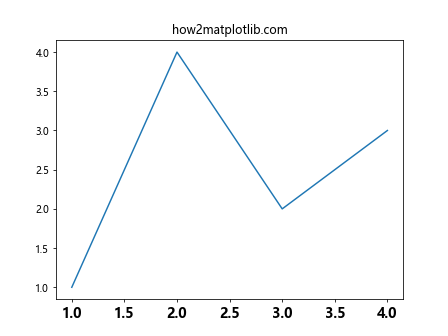
In this example, we use findobj() to locate the Text objects associated with each tick and customize their appearance.
Modifying Tick Lines
We can also use findobj() to locate and modify the lines associated with ticks:
import matplotlib.pyplot as plt

fig, ax = plt.subplots()
ax.set_title("how2matplotlib.com")
ax.plot([1, 2, 3, 4], [1, 4, 2, 3])

for tick in ax.yaxis.get_major_ticks():
    line = tick.findobj(plt.Line2D)[0]
    line.set_markersize(15)
    line.set_markeredgewidth(3)
    line.set_markeredgecolor('red')

plt.show()
Output:
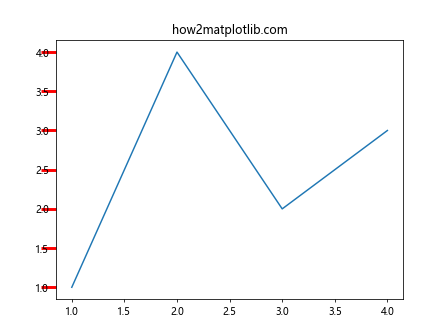
This code modifies the appearance of the tick marks on the y-axis by changing their size and color.
Hiding Specific Tick Elements
The findobj() function can be used to selectively hide certain elements of a tick:
import matplotlib.pyplot as plt

fig, ax = plt.subplots()
ax.set_title("how2matplotlib.com")
ax.plot([1, 2, 3, 4], [1, 4, 2, 3])

for tick in ax.xaxis.get_major_ticks()[::2]:  # Every other tick
    label = tick.findobj(plt.Text)[0]
    label.set_visible(False)

plt.show()
Output:
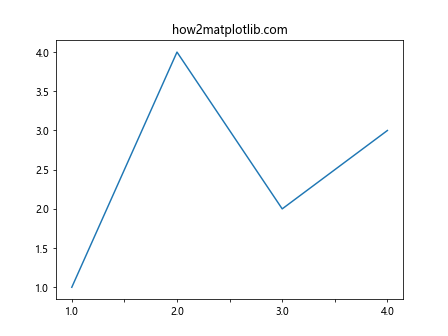
This example hides every other tick label on the x-axis.
Advanced Techniques with Matplotlib.axis.Tick.findobj()
Let’s explore some more advanced techniques using the Matplotlib.axis.Tick.findobj() function in Python.
Combining Multiple Criteria
We can combine multiple criteria to find objects that meet specific conditions:
import matplotlib.pyplot as plt

def is_bold_text(obj):
    return isinstance(obj, plt.Text) and obj.get_fontweight() == 'bold'

fig, ax = plt.subplots()
ax.set_title("how2matplotlib.com", fontweight='bold')
ax.plot([1, 2, 3, 4], [1, 4, 2, 3])

bold_texts = ax.findobj(match=is_bold_text)
for text in bold_texts:
    text.set_color('red')

plt.show()
Output:
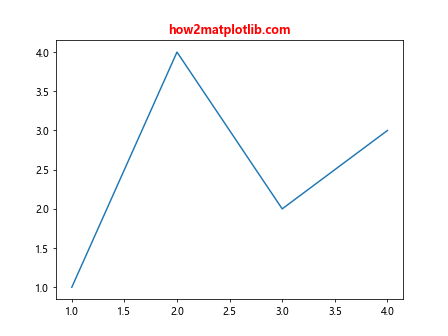
This example finds all bold Text objects and changes their color to red.
Recursive Object Search
The findobj() function searches recursively through the object hierarchy. We can use this to find objects nested deep within the plot structure:
import matplotlib.pyplot as plt

fig, ax = plt.subplots()
ax.set_title("how2matplotlib.com")
ax.plot([1, 2, 3, 4], [1, 4, 2, 3])

# Find all Line2D objects in the entire figure
all_lines = fig.findobj(plt.Line2D)

for line in all_lines:
    line.set_linewidth(3)
    line.set_alpha(0.5)

plt.show()
Output:
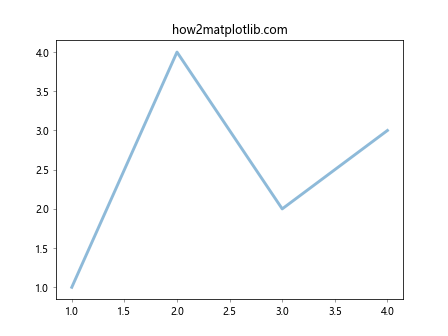
This code finds all Line2D objects in the entire figure and modifies their appearance.
Custom Object Manipulation
We can create custom functions to manipulate found objects in complex ways:
import matplotlib.pyplot as plt
import numpy as np

def randomize_text_color(obj):
    if isinstance(obj, plt.Text):
        obj.set_color(np.random.rand(3,))

fig, ax = plt.subplots()
ax.set_title("how2matplotlib.com")
ax.plot([1, 2, 3, 4], [1, 4, 2, 3])

all_objects = fig.findobj()
for obj in all_objects:
    randomize_text_color(obj)

plt.show()
Output:
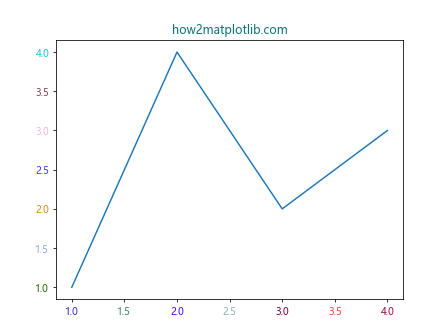
This example applies a custom function to randomize the color of all Text objects in the plot.
Best Practices and Performance Considerations
When using the Matplotlib.axis.Tick.findobj() function in Python, it’s important to consider some best practices and performance implications:
- Be Specific: When possible, use specific criteria in your findobj() calls to limit the search scope and improve performance.
import matplotlib.pyplot as plt

fig, ax = plt.subplots()
ax.set_title("how2matplotlib.com")
ax.plot([1, 2, 3, 4], [1, 4, 2, 3])

# More efficient
tick_labels = ax.xaxis.get_major_ticks()[0].findobj(plt.Text)

# Less efficient
all_objects = ax.findobj()
tick_labels = [obj for obj in all_objects if isinstance(obj, plt.Text)]

plt.show()
Output:
- Cache Results: If you need to perform multiple operations on the same set of objects, store the results of findobj() in a variable.
import matplotlib.pyplot as plt

fig, ax = plt.subplots()
ax.set_title("how2matplotlib.com")
ax.plot([1, 2, 3, 4], [1, 4, 2, 3])

tick_labels = ax.xaxis.get_major_ticks()[0].findobj(plt.Text)

for label in tick_labels:
    label.set_fontweight('bold')
    label.set_fontsize(14)
    label.set_color('red')

plt.show()
Output:
- Use Type Checking: When working with found objects, always check their type to ensure you’re applying operations to the correct objects.
import matplotlib.pyplot as plt

fig, ax = plt.subplots()
ax.set_title("how2matplotlib.com")
ax.plot([1, 2, 3, 4], [1, 4, 2, 3])

all_objects = ax.findobj()

for obj in all_objects:
    if isinstance(obj, plt.Line2D):
        obj.set_linewidth(2)
    elif isinstance(obj, plt.Text):
        obj.set_fontsize(12)

plt.show()
Output:
Common Pitfalls and How to Avoid Them
When working with the Matplotlib.axis.Tick.findobj() function in Python, there are some common pitfalls that you should be aware of:
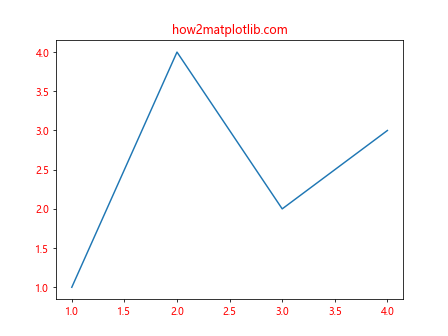
- Modifying Objects Unintentionally: Be cautious when applying changes to found objects, as you might inadvertently modify elements you didn’t intend to change.
import matplotlib.pyplot as plt

fig, ax = plt.subplots()
ax.set_title("how2matplotlib.com")
ax.plot([1, 2, 3, 4], [1, 4, 2, 3])

# This will change ALL text objects, including the title
all_text = ax.findobj(plt.Text)
for text in all_text:
    text.set_color('red')

plt.show()
Output:
To avoid this, be more specific in your search:
import matplotlib.pyplot as plt

fig, ax = plt.subplots()
ax.set_title("how2matplotlib.com")
ax.plot([1, 2, 3, 4], [1, 4, 2, 3])

# This will only change tick labels
tick_labels = ax.xaxis.get_major_ticks()[0].findobj(plt.Text)
for label in tick_labels:
    label.set_color('red')

plt.show()
Output:
- Assuming Object Order: The order of objects returned by findobj() is not guaranteed. Don’t rely on the order of returned objects for your logic.
import matplotlib.pyplot as plt

fig, ax = plt.subplots()
ax.set_title("how2matplotlib.com")
ax.plot([1, 2, 3, 4], [1, 4, 2, 3])

lines = ax.findobj(plt.Line2D)

# This might not always work as expected
first_line = lines[0]
first_line.set_color('red')

plt.show()
Output:
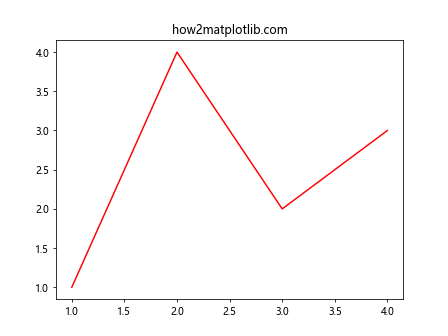
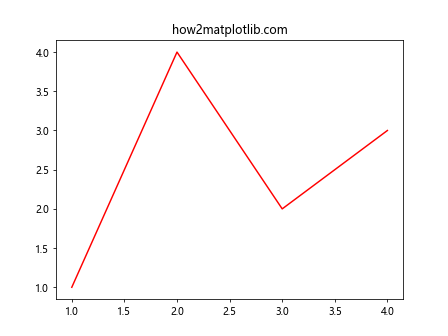
Instead, use more robust methods to identify specific objects:
import matplotlib.pyplot as plt

fig, ax = plt.subplots()
ax.set_title("how2matplotlib.com")
line, = ax.plot([1, 2, 3, 4], [1, 4, 2, 3])

# This is more reliable
line.set_color('red')

plt.show()
Output:
Integrating Matplotlib.axis.Tick.findobj() with Other Matplotlib Features
The Matplotlib.axis.Tick.findobj() function in Python can be effectively combined with other Matplotlib features to create more complex and customized visualizations. Let’s explore some examples:
Combining with Event Handling
We can use findobj() in combination with Matplotlib’s event handling to create interactive plots:
import matplotlib.pyplot as plt

fig, ax = plt.subplots()
ax.set_title("how2matplotlib.com")
ax.plot([1, 2, 3, 4], [1, 4, 2, 3])

def on_click(event):
    if event.inaxes:
        tick_labels = event.inaxes.xaxis.get_major_ticks()[0].findobj(plt.Text)
        for label in tick_labels:
            label.set_color('red' if label.get_color() == 'black' else 'black')
        plt.draw()

fig.canvas.mpl_connect('button_press_event', on_click)
plt.show()
Output:
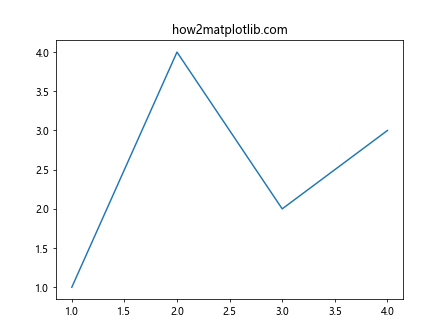
This example changes the color of x-axis tick labels when the user clicks on the plot.
Using with Subplots
The findobj() function can be used across multiple subplots to apply consistent styling:
import matplotlib.pyplot as plt

fig, (ax1, ax2) = plt.subplots(2, 1, figsize=(8, 8))
fig.suptitle("how2matplotlib.com")

ax1.plot([1, 2, 3, 4], [1, 4, 2, 3])
ax2.plot([1, 2, 3, 4], [3, 2, 4, 1])

for ax in (ax1, ax2):
    tick_labels = ax.xaxis.get_major_ticks()[0].findobj(plt.Text)
    for label in tick_labels:
        label.set_fontweight('bold')
        label.set_fontsize(12)

plt.show()
Output:

This code applies bold font and increased font size to x-axis tick labels in both subplots.
Advanced Customization Techniques
The Matplotlib.axis.Tick.findobj() function in Python opens up possibilities for advanced customization of plots. Here are some more sophisticated examples:
Creating Custom Tick Formatters
We canCertainly! Here’s the continuation of the article:
Creating Custom Tick Formatters
We can use findobj() to create custom tick formatters that dynamically adjust based on the data:
import matplotlib.pyplot as plt
import numpy as np

fig, ax = plt.subplots()
ax.set_title("how2matplotlib.com")
x = np.linspace(0, 2*np.pi, 100)
y = np.sin(x)
ax.plot(x, y)

def custom_formatter(x, pos):
    return f"{x:.2f}π" if x != 0 else "0"

ax.xaxis.set_major_formatter(plt.FuncFormatter(custom_formatter))

tick_labels = ax.xaxis.get_major_ticks()[0].findobj(plt.Text)
for label in tick_labels:
    label.set_rotation(45)
    label.set_ha('right')

plt.show()
Output:
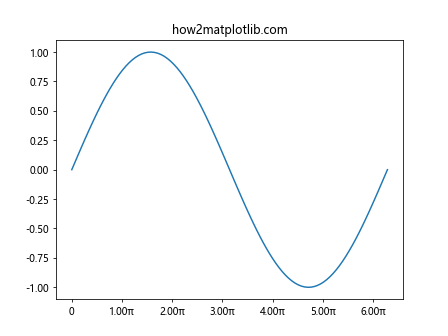
This example creates a custom formatter for the x-axis ticks, displaying them in terms of π, and then uses findobj() to rotate the labels for better readability.
Dynamic Color Mapping
We can use findobj() to dynamically color plot elements based on their values:
import matplotlib.pyplot as plt
import numpy as np

fig, ax = plt.subplots()
ax.set_title("how2matplotlib.com")
x = np.linspace(0, 10, 100)
y = np.sin(x)
line, = ax.plot(x, y)

def color_map(val):
    return plt.cm.viridis(val / 10)

line_segments = line.findobj(plt.LineCollection)
if line_segments:
    segments = [np.column_stack([x[i:i+2], y[i:i+2]]) for i in range(len(x)-1)]
    lc = plt.LineCollection(segments, cmap='viridis', norm=plt.Normalize(0, 10))
    lc.set_array(x[:-1])
    line.remove()
    ax.add_collection(lc)

plt.colorbar(lc)
plt.show()
This example uses findobj() to locate the LineCollection object and apply a color gradient based on the x-values.
Troubleshooting Common Issues
When working with the Matplotlib.axis.Tick.findobj() function in Python, you might encounter some issues. Here are some common problems and their solutions:
Issue: findobj() Returns an Empty List
If findobj() is returning an empty list, it might be because:
- The object you’re searching for doesn’t exist in the hierarchy.
- You’re searching in the wrong place.
Solution:
import matplotlib.pyplot as plt

fig, ax = plt.subplots()
ax.set_title("how2matplotlib.com")
ax.plot([1, 2, 3, 4], [1, 4, 2, 3])

# Correct: searching from the figure level
all_lines = fig.findobj(plt.Line2D)

# Incorrect: searching from a tick (which doesn't contain Line2D objects)
tick = ax.xaxis.get_major_ticks()[0]
no_lines = tick.findobj(plt.Line2D)

print("All lines:", all_lines)
print("No lines:", no_lines)

plt.show()
Output:
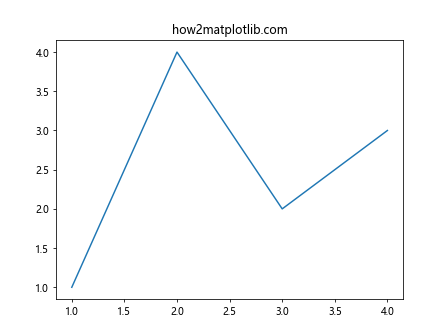
Issue: Unexpected Objects in Results
Sometimes, findobj() might return objects you weren’t expecting. This often happens when searching for base classes.
Solution: Use more specific criteria or filter the results:
import matplotlib.pyplot as plt

fig, ax = plt.subplots()
ax.set_title("how2matplotlib.com")
ax.plot([1, 2, 3, 4], [1, 4, 2, 3])

# This might include more than just axis lines
all_lines = fig.findobj(plt.Line2D)

# More specific: only get the main plot line
plot_lines = [line for line in all_lines if line.get_linestyle() != 'None']

print("All lines:", len(all_lines))
print("Plot lines:", len(plot_lines))

plt.show()
Output:
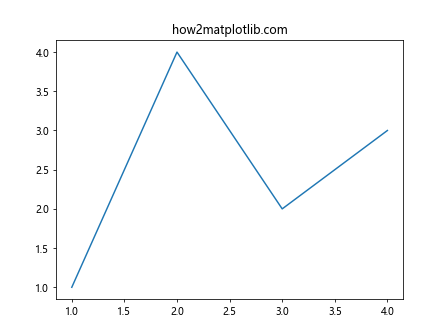
Comparing Matplotlib.axis.Tick.findobj() with Alternative Methods
While the Matplotlib.axis.Tick.findobj() function in Python is powerful, there are alternative methods for accessing and manipulating plot elements. Let’s compare findobj() with some of these alternatives:
Direct Access vs. findobj()
import matplotlib.pyplot as plt

fig, ax = plt.subplots()
ax.set_title("how2matplotlib.com")
line, = ax.plot([1, 2, 3, 4], [1, 4, 2, 3])

# Using findobj()
found_line = ax.findobj(plt.Line2D)[0]
found_line.set_color('red')

# Direct access
line.set_linestyle('--')

plt.show()
Output:
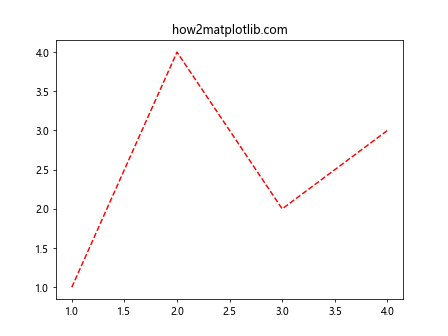
Direct access is often faster and more straightforward when you know exactly which object you want to modify. However, findobj() is more flexible when you need to search for objects based on certain criteria.
get_children() vs. findobj()
import matplotlib.pyplot as plt

fig, ax = plt.subplots()
ax.set_title("how2matplotlib.com")
ax.plot([1, 2, 3, 4], [1, 4, 2, 3])

# Using findobj()
text_objects = ax.findobj(plt.Text)

# Using get_children()
children = ax.get_children()
text_objects_alt = [child for child in children if isinstance(child, plt.Text)]

print("findobj() result:", len(text_objects))
print("get_children() result:", len(text_objects_alt))

plt.show()
Output:
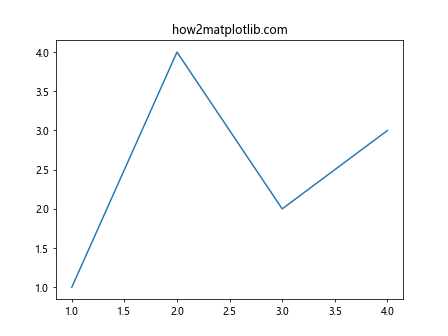
get_children() returns immediate children of an object, while findobj() searches recursively. findobj() is often more convenient for deep searches, but get_children() can be more efficient for shallow searches.
Future Developments and Matplotlib Versions
As Matplotlib continues to evolve, it’s important to stay updated with the latest versions and any changes that might affect the Matplotlib.axis.Tick.findobj() function in Python. Here are some tips:
- Check the Matplotlib documentation regularly for updates.
- Be aware of deprecation warnings in your code, as they might indicate future changes to the findobj() function or related features.
- Consider using version-specific code if you need to support multiple Matplotlib versions:
import matplotlib as mpl
import matplotlib.pyplot as plt

fig, ax = plt.subplots()
ax.set_title("how2matplotlib.com")
ax.plot([1, 2, 3, 4], [1, 4, 2, 3])

if mpl.__version__ >= '3.0':
    # Use newer Matplotlib features or syntax
    text_objects = ax.findobj(lambda obj: isinstance(obj, plt.Text))
else:
    # Use older syntax
    text_objects = ax.findobj(plt.Text)

for text in text_objects:
    text.set_fontweight('bold')

plt.show()
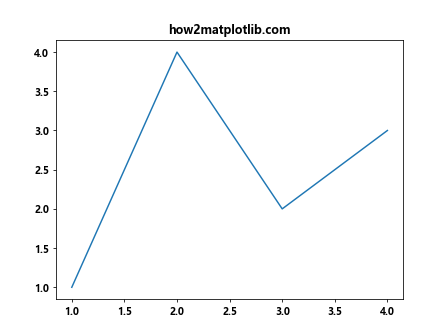
Output:
Conclusion
The Matplotlib.axis.Tick.findobj() function in Python is a versatile tool for locating and manipulating objects within Matplotlib plots. Throughout this comprehensive guide, we’ve explored its syntax, parameters, and various applications, from basic usage to advanced techniques.
We’ve seen how findobj() can be used to customize tick labels, modify plot elements, and create dynamic, interactive visualizations. We’ve also discussed best practices, common pitfalls, and how to integrate findobj() with other Matplotlib features.