How to Use Matplotlib Slider Widget
Matplotlib Slider Widget is a powerful tool for creating interactive visualizations in Python. This article will provide an in-depth exploration of the Matplotlib Slider Widget, covering its features, implementation, and various use cases. By the end of this guide, you’ll have a thorough understanding of how to leverage this widget to enhance your data visualization projects.
Introduction to Matplotlib Slider Widget
Matplotlib Slider Widget is an interactive component that allows users to dynamically adjust parameters in a plot. It’s part of the Matplotlib library, which is widely used for creating static, animated, and interactive visualizations in Python. The Slider Widget provides a convenient way to explore data and visualize the effects of changing variables in real-time.
Let’s start with a simple example to demonstrate the basic usage of a Matplotlib Slider Widget:
import numpy as np
import matplotlib.pyplot as plt
from matplotlib.widgets import Slider

# Create the figure and the line that we will manipulate
fig, ax = plt.subplots()
t = np.arange(0, 1, 0.001)
a0 = 5
f0 = 3
s = a0 * np.sin(2 * np.pi * f0 * t)
l, = plt.plot(t, s, lw=2)
ax.set_xlabel('Time [s]')

# Adjust the main plot to make room for the sliders
plt.subplots_adjust(left=0.25, bottom=0.25)

# Make a horizontal slider to control the frequency
axfreq = plt.axes([0.25, 0.1, 0.65, 0.03])
freq_slider = Slider(
    ax=axfreq,
    label='Frequency [Hz]',
    valmin=0.1,
    valmax=30,
    valinit=f0,
)

# Make a vertical slider to control the amplitude
axamp = plt.axes([0.1, 0.25, 0.0225, 0.63])
amp_slider = Slider(
    ax=axamp,
    label="Amplitude",
    valmin=0,
    valmax=10,
    valinit=a0,
    orientation="vertical"
)

# The function to be called anytime a slider's value changes
def update(val):
    amp = amp_slider.val
    freq = freq_slider.val
    l.set_ydata(amp * np.sin(2 * np.pi * freq * t))
    fig.canvas.draw_idle()

# Register the update function with each slider
freq_slider.on_changed(update)
amp_slider.on_changed(update)

plt.title('Interactive Sine Wave - how2matplotlib.com')
plt.show()
Output:
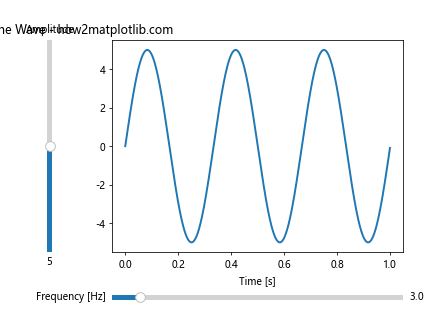
In this example, we create two sliders: one for controlling the frequency and another for the amplitude of a sine wave. The update function is called whenever a slider value changes, updating the plot accordingly.
Understanding the Matplotlib Slider Widget Components
To effectively use the Matplotlib Slider Widget, it’s essential to understand its key components:
- Axes: The slider requires its own axes object, separate from the main plot.
- Label: A text label describing the slider’s purpose.
- Value Range: Defined by
valminandvalmaxparameters. - Initial Value: Set using the
valinitparameter. - Orientation: Can be horizontal (default) or vertical.
Let’s create a more complex example with multiple sliders controlling different aspects of a plot:
import numpy as np
import matplotlib.pyplot as plt
from matplotlib.widgets import Slider, Button

def f(t, amplitude, frequency, phase, offset):
    return amplitude * np.sin(2 * np.pi * frequency * t + phase) + offset

# Generate the initial plot
t = np.linspace(0, 1, 1000)
initial_amplitude = 1
initial_frequency = 2
initial_phase = 0
initial_offset = 0

fig, ax = plt.subplots()
line, = ax.plot(t, f(t, initial_amplitude, initial_frequency, initial_phase, initial_offset))
ax.set_xlabel('Time')
ax.set_ylabel('Amplitude')

# Adjust the main plot to make room for the sliders
plt.subplots_adjust(left=0.1, bottom=0.35)

# Create sliders
slider_color = 'lightgoldenrodyellow'
slider_ax_amplitude = plt.axes([0.1, 0.2, 0.8, 0.03], facecolor=slider_color)
slider_ax_frequency = plt.axes([0.1, 0.15, 0.8, 0.03], facecolor=slider_color)
slider_ax_phase = plt.axes([0.1, 0.1, 0.8, 0.03], facecolor=slider_color)
slider_ax_offset = plt.axes([0.1, 0.05, 0.8, 0.03], facecolor=slider_color)

slider_amplitude = Slider(slider_ax_amplitude, 'Amplitude', 0.1, 5.0, valinit=initial_amplitude)
slider_frequency = Slider(slider_ax_frequency, 'Frequency', 0.1, 10.0, valinit=initial_frequency)
slider_phase = Slider(slider_ax_phase, 'Phase', 0, 2*np.pi, valinit=initial_phase)
slider_offset = Slider(slider_ax_offset, 'Offset', -2, 2, valinit=initial_offset)

def update(val):
    amplitude = slider_amplitude.val
    frequency = slider_frequency.val
    phase = slider_phase.val
    offset = slider_offset.val
    line.set_ydata(f(t, amplitude, frequency, phase, offset))
    fig.canvas.draw_idle()

slider_amplitude.on_changed(update)
slider_frequency.on_changed(update)
slider_phase.on_changed(update)
slider_offset.on_changed(update)

# Add a reset button
reset_button_ax = plt.axes([0.8, 0.025, 0.1, 0.04])
reset_button = Button(reset_button_ax, 'Reset', color=slider_color, hovercolor='0.975')

def reset(event):
    slider_amplitude.reset()
    slider_frequency.reset()
    slider_phase.reset()
    slider_offset.reset()

reset_button.on_clicked(reset)

plt.title('Interactive Sine Wave with Multiple Parameters - how2matplotlib.com')
plt.show()
Output:
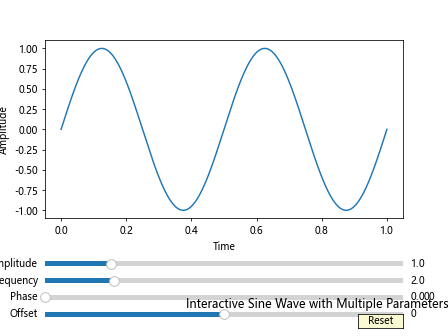
This example demonstrates how to create multiple sliders to control different parameters of a sine wave, including amplitude, frequency, phase, and offset. It also includes a reset button to restore the initial values.
Advanced Features of Matplotlib Slider Widget
The Matplotlib Slider Widget offers several advanced features that can enhance your interactive visualizations. Let’s explore some of these features:
Custom Slider Styles
You can customize the appearance of sliders by modifying their properties. Here’s an example that demonstrates custom slider styles:
import numpy as np
import matplotlib.pyplot as plt
from matplotlib.widgets import Slider

fig, ax = plt.subplots()
plt.subplots_adjust(left=0.1, bottom=0.25)

t = np.arange(0.0, 1.0, 0.001)
a0 = 5
f0 = 3
s = a0 * np.sin(2 * np.pi * f0 * t)
l, = plt.plot(t, s, lw=2)

ax_freq = plt.axes([0.1, 0.1, 0.8, 0.03])
ax_amp = plt.axes([0.1, 0.15, 0.8, 0.03])

slider_freq = Slider(ax_freq, 'Frequency', 0.1, 30.0, valinit=f0, valstep=0.1)
slider_amp = Slider(ax_amp, 'Amplitude', 0.1, 10.0, valinit=a0, valstep=0.1)

# Customize slider appearance
slider_freq.valtext.set_color('red')
slider_amp.valtext.set_color('green')
slider_freq.label.set_size(10)
slider_amp.label.set_size(10)
slider_freq.poly.set_color('lightblue')
slider_amp.poly.set_color('lightgreen')

def update(val):
    amp = slider_amp.val
    freq = slider_freq.val
    l.set_ydata(amp * np.sin(2 * np.pi * freq * t))
    fig.canvas.draw_idle()

slider_freq.on_changed(update)
slider_amp.on_changed(update)

plt.title('Custom Styled Sliders - how2matplotlib.com')
plt.show()
Output:
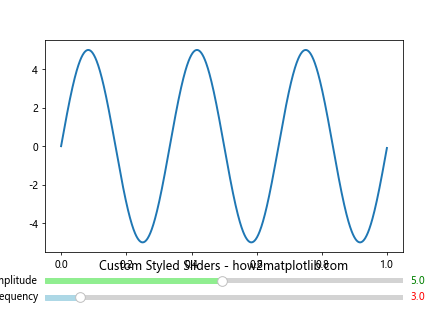
In this example, we’ve customized the color of the slider value text, label size, and the color of the slider itself.
Logarithmic Sliders
For scenarios where you need to cover a wide range of values, logarithmic sliders can be useful. Here’s how to create a logarithmic slider:
import numpy as np
import matplotlib.pyplot as plt
from matplotlib.widgets import Slider

fig, ax = plt.subplots()
plt.subplots_adjust(bottom=0.25)

t = np.arange(0.1, 100.0, 0.1)
s = np.sin(t)
l, = plt.semilogx(t, s)
ax.set_xlim(0.1, 100.0)

ax_freq = plt.axes([0.1, 0.1, 0.8, 0.03])
slider_freq = Slider(ax_freq, 'Frequency', 0.1, 100.0, valinit=1.0, valstep=0.1)
slider_freq.valtext.set_text('{:.2f}'.format(slider_freq.val))

def update(val):
    freq = slider_freq.val
    l.set_xdata(t * freq)
    ax.set_xlim(0.1 * freq, 100.0 * freq)
    slider_freq.valtext.set_text('{:.2f}'.format(freq))
    fig.canvas.draw_idle()

slider_freq.on_changed(update)

plt.title('Logarithmic Slider - how2matplotlib.com')
plt.show()
Output:
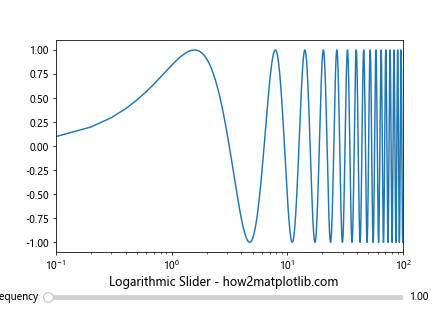
This example creates a logarithmic slider that adjusts the frequency of a sine wave plotted on a logarithmic x-axis.
Discrete Sliders
Sometimes you may want to limit the slider to specific discrete values. Here’s how to create a discrete slider:
import numpy as np
import matplotlib.pyplot as plt
from matplotlib.widgets import Slider

fig, ax = plt.subplots()
plt.subplots_adjust(bottom=0.25)

t = np.arange(0.0, 1.0, 0.001)
a0 = 5
f0 = 3
s = a0 * np.sin(2 * np.pi * f0 * t)
l, = plt.plot(t, s, lw=2)

ax_freq = plt.axes([0.1, 0.1, 0.8, 0.03])
freq_values = [1, 2, 3, 4, 5, 6, 7, 8, 9, 10]
slider_freq = Slider(ax_freq, 'Frequency', 0, len(freq_values) - 1, valinit=freq_values.index(f0), valstep=1)

def update(val):
    freq = freq_values[int(slider_freq.val)]
    l.set_ydata(a0 * np.sin(2 * np.pi * freq * t))
    slider_freq.valtext.set_text(str(freq))
    fig.canvas.draw_idle()

slider_freq.on_changed(update)

plt.title('Discrete Slider - how2matplotlib.com')
plt.show()
Output:
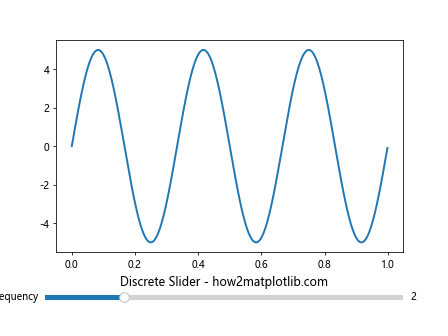
This example creates a discrete slider that allows selection from a predefined set of frequency values.
Combining Matplotlib Slider Widget with Other Widgets
The Matplotlib Slider Widget can be combined with other widgets to create more complex interactive visualizations. Let’s explore some examples:
Slider with Radio Buttons
Here’s an example that combines a slider with radio buttons to control different aspects of a plot:
import numpy as np
import matplotlib.pyplot as plt
from matplotlib.widgets import Slider, RadioButtons

fig, ax = plt.subplots()
plt.subplots_adjust(left=0.3, bottom=0.25)

t = np.arange(0.0, 1.0, 0.001)
a0 = 5
f0 = 3
s = a0 * np.sin(2 * np.pi * f0 * t)
l, = plt.plot(t, s, lw=2)

ax_freq = plt.axes([0.1, 0.1, 0.8, 0.03])
slider_freq = Slider(ax_freq, 'Frequency', 0.1, 30.0, valinit=f0)

ax_radio = plt.axes([0.025, 0.5, 0.15, 0.15])
radio = RadioButtons(ax_radio, ('sin', 'cos', 'tan'))

def update_slider(val):
    f = slider_freq.val
    func = radio.value_selected
    if func == 'sin':
        ydata = a0 * np.sin(2 * np.pi * f * t)
    elif func == 'cos':
        ydata = a0 * np.cos(2 * np.pi * f * t)
    else:
        ydata = a0 * np.tan(2 * np.pi * f * t)
    l.set_ydata(ydata)
    fig.canvas.draw_idle()

def update_radio(label):
    update_slider(slider_freq.val)

slider_freq.on_changed(update_slider)
radio.on_clicked(update_radio)

plt.title('Slider with Radio Buttons - how2matplotlib.com')
plt.show()
Output:
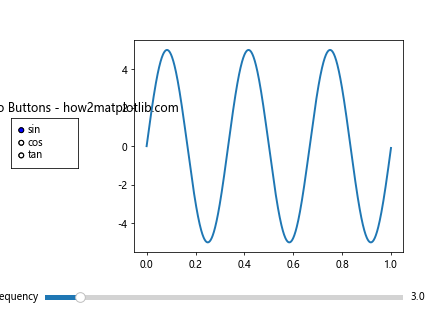
This example allows users to switch between sine, cosine, and tangent functions using radio buttons, while adjusting the frequency with a slider.
Slider with Checkboxes
Here’s an example that combines sliders with checkboxes to control the visibility of multiple plots:
import numpy as np
import matplotlib.pyplot as plt
from matplotlib.widgets import Slider, CheckButtons

fig, ax = plt.subplots()
plt.subplots_adjust(left=0.3, bottom=0.25)

t = np.arange(0.0, 1.0, 0.001)
a0 = 5
f0 = 3
s1 = a0 * np.sin(2 * np.pi * f0 * t)
s2 = a0 * np.cos(2 * np.pi * f0 * t)
l1, = plt.plot(t, s1, lw=2, color='red', visible=True, label='sin')
l2, = plt.plot(t, s2, lw=2, color='blue', visible=True, label='cos')
plt.legend()

ax_freq = plt.axes([0.1, 0.1, 0.8, 0.03])
slider_freq = Slider(ax_freq, 'Frequency', 0.1, 30.0, valinit=f0)

ax_check = plt.axes([0.025, 0.5, 0.15, 0.15])
check = CheckButtons(ax_check, ('sin', 'cos'), (True, True))

def update_slider(val):
    f = slider_freq.val
    l1.set_ydata(a0 * np.sin(2 * np.pi * f * t))
    l2.set_ydata(a0 * np.cos(2 * np.pi * f * t))
    fig.canvas.draw_idle()

def update_check(label):
    if label == 'sin':
        l1.set_visible(not l1.get_visible())
    elif label == 'cos':
        l2.set_visible(not l2.get_visible())
    plt.legend()
    fig.canvas.draw_idle()

slider_freq.on_changed(update_slider)
check.on_clicked(update_check)

plt.title('Slider with Checkboxes - how2matplotlib.com')
plt.show()
Output:
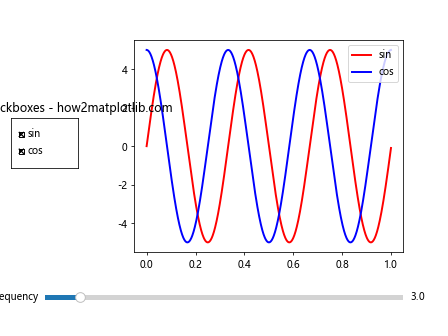
This example allows users to control the frequency of sine and cosine waves using a slider, while toggling their visibility with checkboxes.
Real-world Applications of Matplotlib Slider Widget
The Matplotlib Slider Widget has numerous practical applications in data visualization and analysis. Let’s explore some real-world scenarios where this widget can be particularly useful:
Interactive Data Exploration
Sliders can be used to interactively explore large datasets by allowing users to filter or zoom into specific ranges. Here’s an example that demonstrates this concept:
import numpy as np
import matplotlib.pyplot as plt
from matplotlib.widgets import Slider

# Generate sample data
np.random.seed(0)
x = np.linspace(0, 10, 1000)
y = np.sin(x) + 0.1 * np.random.randn(1000)

fig, ax = plt.subplots()
plt.subplots_adjust(bottom=0.25)

line, = ax.plot(x, y)
ax.set_xlim(0, 10)
ax.set_ylim(-1.5, 1.5)

# Create sliders for x-axis range
ax_xmin = plt.axes([0.1, 0.1, 0.8, 0.03])
ax_xmax = plt.axes([0.1, 0.15, 0.8, 0.03])

slider_xmin = Slider(ax_xmin, 'X Min', 0, 10, valinit=0)
slider_xmax = Slider(ax_xmax, 'X Max', 0, 10, valinit=10)

def update(val):
    xmin = slider_xmin.val
    xmax = slider_xmax.val
    ax.set_xlim(xmin, xmax)
    fig.canvas.draw_idle()

slider_xmin.on_changed(update)
slider_xmax.on_changed(update)

plt.title('Interactive Data Exploration - how2matplotlib.com')
plt.show()
Output:
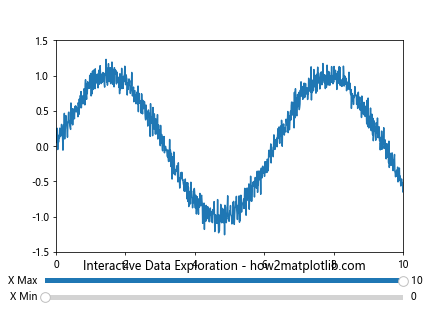
This example allows users to interactively adjust the x-axis range of a plot, enabling them to zoom in on specific regions of interest.
Parameter Tuning in Machine Learning
Sliders can be useful for visualizing the effects of hyperparameter tuning in machine learning models. Here’s a simple example demonstrating this concept with a polynomial regression model:
import numpy as np
import matplotlib.pyplot as plt
from matplotlib.widgets import Slider
from sklearn.preprocessing import PolynomialFeatures
from sklearn.linear_model import LinearRegression

# Generate sample data
np.random.seed(0)
X = np.sort(5 * np.random.rand(80, 1), axis=0)
y = np.sin(X).ravel() + np.sin(6 * X).ravel() + np.random.randn(80) * 0.1

fig, ax = plt.subplots()
plt.subplots_adjust(bottom=0.25)

scatter = ax.scatter(X, y, color='blue')
line, = ax.plot([], [], color='red')

ax_degree = plt.axes([0.1, 0.1, 0.8, 0.03])
slider_degree = Slider(ax_degree, 'Polynomial Degree', 1, 10, valinit=1, valstep=1)

def update(val):
    degree = int(slider_degree.val)
    poly_features = PolynomialFeatures(degree=degree, include_bias=False)
    X_poly = poly_features.fit_transform(X)

    model = LinearRegression()
    model.fit(X_poly, y)

    X_plot = np.linspace(0, 5, 100).reshape(-1, 1)
    X_plot_poly = poly_features.transform(X_plot)
    y_plot = model.predict(X_plot_poly)

    line.set_data(X_plot, y_plot)
    ax.set_ylim(y.min() - 0.1, y.max() + 0.1)
    fig.canvas.draw_idle()

slider_degree.on_changed(update)

update(1)  # Initial plot

plt.title('Polynomial Regression Degree Tuning - how2matplotlib.com')
plt.show()
Output:
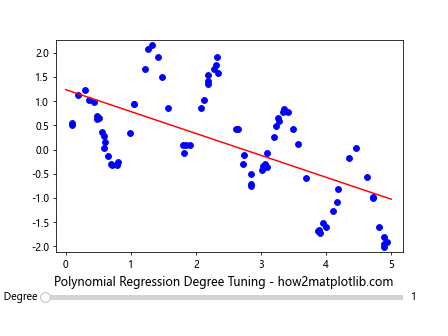
This example allows users to adjust the degree of a polynomial regression model and visualize how it affects the fit to the data.
Interactive Function Visualization
Sliders can be used to create interactive visualizations of mathematical functions. Here’s an example that visualizes a parametric function:
import numpy as np
import matplotlib.pyplot as plt
from matplotlib.widgets import Slider

def parametric_function(t, a, b):
    x = a * np.cos(t)
    y = b * np.sin(t)
    return x, y

fig, ax = plt.subplots()
plt.subplots_adjust(bottom=0.3)

t = np.linspace(0, 2*np.pi, 1000)
a0, b0 = 1, 1
x, y = parametric_function(t, a0, b0)
line, = ax.plot(x, y)

ax.set_xlim(-2, 2)
ax.set_ylim(-2, 2)
ax.set_aspect('equal')

ax_a = plt.axes([0.1, 0.1, 0.8, 0.03])
ax_b = plt.axes([0.1, 0.15, 0.8, 0.03])

slider_a = Slider(ax_a, 'a', 0.1, 2.0, valinit=a0)
slider_b = Slider(ax_b, 'b', 0.1, 2.0, valinit=b0)

def update(val):
    a = slider_a.val
    b = slider_b.val
    x, y = parametric_function(t, a, b)
    line.set_data(x, y)
    fig.canvas.draw_idle()

slider_a.on_changed(update)
slider_b.on_changed(update)

plt.title('Interactive Parametric Function - how2matplotlib.com')
plt.show()
Output:
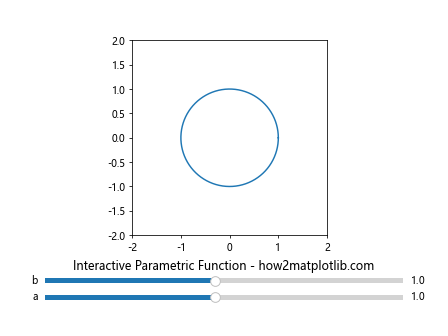
This example allows users to interactively adjust the parameters of a parametric function (in this case, an ellipse) and visualize the resulting curve.
Best Practices for Using Matplotlib Slider Widget
When working with Matplotlib Slider Widget, consider the following best practices to create effective and user-friendly interactive visualizations:
- Clear Labeling: Provide clear and descriptive labels for each slider to indicate what parameter it controls.
Appropriate Value Ranges: Set appropriate minimum and maximum values for sliders to prevent unrealistic or meaningless parameter values.
Initial Values: Choose sensible initial values that provide a good starting point for exploration.
Responsive Updates: Ensure that the plot updates smoothly and quickly when sliders are adjusted to provide a responsive user experience.
Combine with Other Widgets: Consider combining sliders with other widgets like buttons or checkboxes for more complex interactions.
Layout Considerations: Carefully plan the layout of sliders and other UI elements to make efficient use of space and maintain a clean interface.
Error Handling: Implement error handling to gracefully manage potential issues, such as division by zero or invalid parameter combinations.
Performance Optimization: For complex visualizations, consider optimizing performance by updating only necessary elements or using efficient data structures.
Troubleshooting Common Issues with Matplotlib Slider Widget
When working with Matplotlib Slider Widget, you may encounter some common issues. Here are some troubleshooting tips: