How to Master Matplotlib Radio Buttons
Matplotlib Radio Buttons are an essential interactive tool for data visualization in Python. This comprehensive guide will explore the various aspects of Matplotlib Radio Buttons, providing detailed explanations and practical examples to help you master this powerful feature. Whether you’re a beginner or an experienced data scientist, this article will equip you with the knowledge and skills to effectively use Matplotlib Radio Buttons in your projects.
Introduction to Matplotlib Radio Buttons
Matplotlib Radio Buttons are a type of widget provided by the Matplotlib library that allows users to select one option from a group of mutually exclusive options. These buttons are particularly useful when you want to provide a simple and intuitive way for users to switch between different views or settings in your data visualization.
Let’s start with a basic example of how to create and use Matplotlib Radio Buttons:
import matplotlib.pyplot as plt
from matplotlib.widgets import RadioButtons

fig, ax = plt.subplots()
plt.subplots_adjust(left=0.3)

# Create some sample data
x = range(10)
y1 = [i**2 for i in x]
y2 = [i**3 for i in x]

# Plot initial data
line, = ax.plot(x, y1, lw=2)

# Create radio buttons
rax = plt.axes([0.05, 0.7, 0.15, 0.15])
radio = RadioButtons(rax, ('Square', 'Cube'))

# Define update function
def update_plot(label):
    if label == 'Square':
        line.set_ydata(y1)
    elif label == 'Cube':
        line.set_ydata(y2)
    plt.draw()

# Connect the radio buttons to the update function
radio.on_clicked(update_plot)

plt.title('How2matplotlib.com - Radio Buttons Example')
plt.show()
Output:
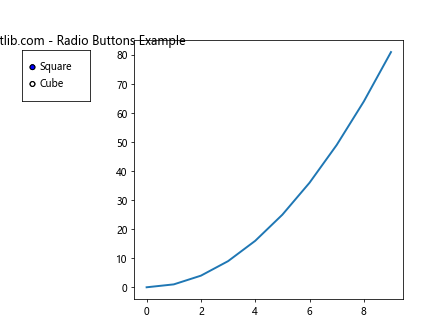
In this example, we create a simple plot with two options: ‘Square’ and ‘Cube’. The radio buttons allow the user to switch between these two options, updating the plot accordingly. This demonstrates the basic functionality of Matplotlib Radio Buttons.
Creating Radio Buttons in Matplotlib
To create radio buttons in Matplotlib, we use the RadioButtons class from the matplotlib.widgets module. The process involves several steps:
- Import the necessary modules
- Create a figure and axes for the main plot
- Define the position for the radio buttons
- Create the radio buttons with labels
- Define an update function
- Connect the radio buttons to the update function
Let’s break down these steps with another example:
import matplotlib.pyplot as plt
from matplotlib.widgets import RadioButtons
import numpy as np

# Create figure and axes
fig, ax = plt.subplots()
plt.subplots_adjust(left=0.3)

# Generate sample data
t = np.linspace(0, 10, 1000)
y_sin = np.sin(t)
y_cos = np.cos(t)
y_tan = np.tan(t)

# Plot initial data
line, = ax.plot(t, y_sin)

# Create radio buttons
rax = plt.axes([0.05, 0.7, 0.15, 0.15])
radio = RadioButtons(rax, ('sin', 'cos', 'tan'))

# Define update function
def update_function(label):
    if label == 'sin':
        line.set_ydata(y_sin)
    elif label == 'cos':
        line.set_ydata(y_cos)
    elif label == 'tan':
        line.set_ydata(y_tan)
    ax.relim()
    ax.autoscale_view()
    plt.draw()

# Connect radio buttons to update function
radio.on_clicked(update_function)

plt.title('How2matplotlib.com - Trigonometric Functions')
plt.show()
Output:
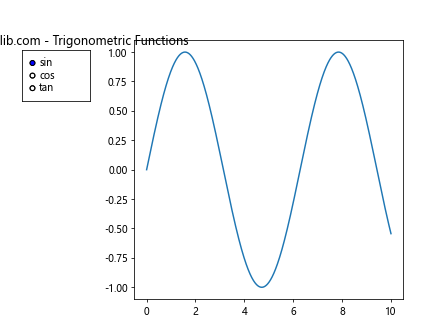
In this example, we create radio buttons to switch between different trigonometric functions. The update_function changes the y-data of the plot based on the selected option. The on_clicked method connects this function to the radio buttons.
Customizing Radio Buttons
Matplotlib Radio Buttons offer various customization options to enhance their appearance and functionality. Let’s explore some of these options:
Modifying Button Size and Shape
You can also adjust the size and shape of the radio buttons:
import matplotlib.pyplot as plt
from matplotlib.widgets import RadioButtons

fig, ax = plt.subplots()
plt.subplots_adjust(left=0.3)

# Create sample data
x = range(5)
y = [i**2 for i in x]

# Plot data
line, = ax.plot(x, y)

# Create radio buttons with custom size and shape
rax = plt.axes([0.05, 0.7, 0.15, 0.15])
radio = RadioButtons(rax, ('Small', 'Medium', 'Large'),
                     radio_props={'s': [20, 40, 60]})  # Varying sizes

def update(label):
    pass  # Placeholder function

radio.on_clicked(update)

plt.title('How2matplotlib.com - Custom Size Radio Buttons')
plt.show()
Output:
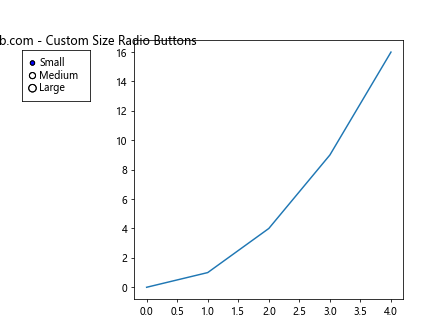
This example demonstrates how to create radio buttons with different sizes.
Using Radio Buttons for Data Visualization
Radio buttons are particularly useful for interactive data visualization. They allow users to switch between different views or subsets of data easily. Let’s explore some practical applications:
Switching Between Different Datasets
import matplotlib.pyplot as plt
from matplotlib.widgets import RadioButtons
import numpy as np

fig, ax = plt.subplots()
plt.subplots_adjust(left=0.3)

# Generate multiple datasets
x = np.linspace(0, 10, 100)
y1 = np.sin(x)
y2 = np.cos(x)
y3 = np.tan(x)

# Plot initial dataset
line, = ax.plot(x, y1)

# Create radio buttons
rax = plt.axes([0.05, 0.7, 0.15, 0.15])
radio = RadioButtons(rax, ('Dataset 1', 'Dataset 2', 'Dataset 3'))

# Define update function
def update_dataset(label):
    if label == 'Dataset 1':
        line.set_ydata(y1)
    elif label == 'Dataset 2':
        line.set_ydata(y2)
    elif label == 'Dataset 3':
        line.set_ydata(y3)
    ax.relim()
    ax.autoscale_view()
    plt.draw()

radio.on_clicked(update_dataset)

plt.title('How2matplotlib.com - Dataset Selector')
plt.show()
Output:
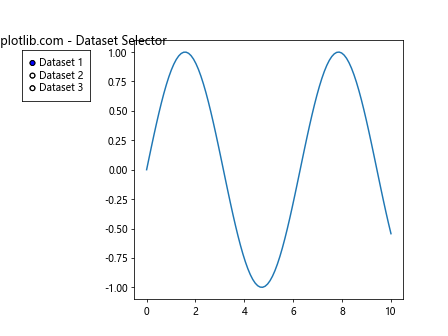
This example allows users to switch between three different datasets using radio buttons.
Changing Plot Styles
Radio buttons can also be used to change the style of the plot:
import matplotlib.pyplot as plt
from matplotlib.widgets import RadioButtons
import numpy as np

fig, ax = plt.subplots()
plt.subplots_adjust(left=0.3)

# Generate data
x = np.linspace(0, 10, 100)
y = np.sin(x)

# Plot initial data
line, = ax.plot(x, y)

# Create radio buttons for plot styles
rax = plt.axes([0.05, 0.7, 0.15, 0.15])
radio = RadioButtons(rax, ('Solid', 'Dashed', 'Dotted'))

# Define update function
def update_style(label):
    if label == 'Solid':
        line.set_linestyle('-')
    elif label == 'Dashed':
        line.set_linestyle('--')
    elif label == 'Dotted':
        line.set_linestyle(':')
    plt.draw()

radio.on_clicked(update_style)

plt.title('How2matplotlib.com - Line Style Selector')
plt.show()
Output:
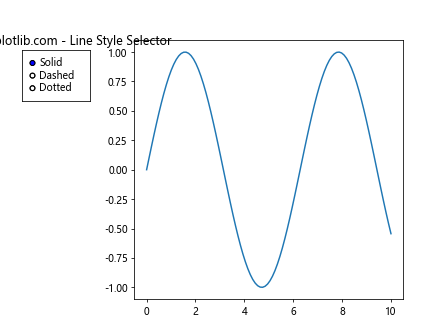
This example demonstrates how to use radio buttons to change the line style of the plot.
Advanced Techniques with Matplotlib Radio Buttons
As you become more comfortable with basic radio button functionality, you can explore more advanced techniques to create sophisticated interactive visualizations.
Combining Radio Buttons with Other Widgets
Radio buttons can be combined with other Matplotlib widgets for more complex interactions. Here’s an example that combines radio buttons with a slider:
import matplotlib.pyplot as plt
from matplotlib.widgets import RadioButtons, Slider
import numpy as np

fig, ax = plt.subplots()
plt.subplots_adjust(left=0.3, bottom=0.25)

# Generate data
t = np.linspace(0, 10, 1000)
y_sin = np.sin(t)
y_cos = np.cos(t)

# Plot initial data
line, = ax.plot(t, y_sin)

# Create radio buttons
rax = plt.axes([0.05, 0.7, 0.15, 0.15])
radio = RadioButtons(rax, ('sin', 'cos'))

# Create slider
sax = plt.axes([0.2, 0.1, 0.6, 0.03])
slider = Slider(sax, 'Frequency', 0.1, 10.0, valinit=1)

# Define update functions
def update_function(label):
    freq = slider.val
    if label == 'sin':
        line.set_ydata(np.sin(freq * t))
    elif label == 'cos':
        line.set_ydata(np.cos(freq * t))
    fig.canvas.draw_idle()

def update_freq(val):
    freq = slider.val
    if radio.value_selected == 'sin':
        line.set_ydata(np.sin(freq * t))
    elif radio.value_selected == 'cos':
        line.set_ydata(np.cos(freq * t))
    fig.canvas.draw_idle()

radio.on_clicked(update_function)
slider.on_changed(update_freq)

plt.title('How2matplotlib.com - Radio Buttons and Slider')
plt.show()
Output:
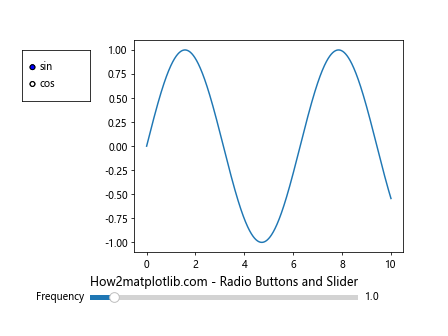
This example combines radio buttons to switch between sine and cosine functions with a slider to adjust the frequency.
Using Radio Buttons for Multiple Plot Elements
Radio buttons can control multiple elements of a plot simultaneously. Here’s an example that changes both the data and the color of the plot:
import matplotlib.pyplot as plt
from matplotlib.widgets import RadioButtons
import numpy as np

fig, ax = plt.subplots()
plt.subplots_adjust(left=0.3)

# Generate data
x = np.linspace(0, 10, 100)
y1 = np.sin(x)
y2 = np.cos(x)

# Plot initial data
line, = ax.plot(x, y1, color='red')

# Create radio buttons
rax = plt.axes([0.05, 0.7, 0.15, 0.15])
radio = RadioButtons(rax, ('Red Sin', 'Blue Cos'))

# Define update function
def update_plot(label):
    if label == 'Red Sin':
        line.set_ydata(y1)
        line.set_color('red')
    elif label == 'Blue Cos':
        line.set_ydata(y2)
        line.set_color('blue')
    ax.relim()
    ax.autoscale_view()
    plt.draw()

radio.on_clicked(update_plot)

plt.title('How2matplotlib.com - Multi-element Control')
plt.show()
Output:
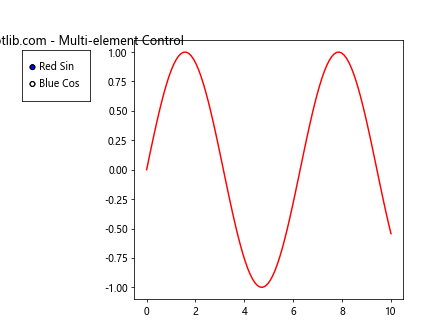
This example uses radio buttons to change both the data (sine or cosine) and the color of the plot (red or blue) simultaneously.
Troubleshooting Common Issues with Matplotlib Radio Buttons
When working with Matplotlib Radio Buttons, you may encounter some common issues. Here are some problems and their solutions:
Radio Buttons Not Updating the Plot
If your radio buttons are not updating the plot, ensure that:
- The update function is correctly defined and connected to the radio buttons.
- The
set_ydata()method is called with the correct data. - You call
plt.draw()orfig.canvas.draw_idle()at the end of your update function.
Here’s an example that demonstrates proper updating:
import matplotlib.pyplot as plt
from matplotlib.widgets import RadioButtons
import numpy as np

fig, ax = plt.subplots()
plt.subplots_adjust(left=0.3)

# Generate data
x = np.linspace(0, 10, 100)
y1 = np.sin(x)
y2 = np.cos(x)

# Plot initial data
line, = ax.plot(x, y1)# Create radio buttons
rax = plt.axes([0.05, 0.7, 0.15, 0.15])
radio = RadioButtons(rax, ('Sine', 'Cosine'))

# Define update function
def update_plot(label):
    if label == 'Sine':
        line.set_ydata(y1)
    elif label == 'Cosine':
        line.set_ydata(y2)
    ax.relim()
    ax.autoscale_view()
    fig.canvas.draw_idle()  # Use this instead of plt.draw()

radio.on_clicked(update_plot)

plt.title('How2matplotlib.com - Proper Plot Updating')
plt.show()
Output:
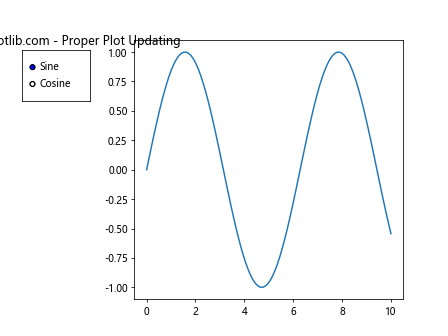
This example ensures that the plot updates correctly when radio buttons are clicked.
Radio Buttons Not Visible
If your radio buttons are not visible, check the following:
- The position of the radio buttons is within the figure bounds.
- The
subplots_adjust()method is called to make room for the buttons. - The radio buttons are created after the main plot.
Here’s an example that addresses these issues:
import matplotlib.pyplot as plt
from matplotlib.widgets import RadioButtons
import numpy as np

# Create figure and axes
fig, ax = plt.subplots()
plt.subplots_adjust(left=0.3, bottom=0.25)  # Make room for buttons

# Generate data
x = np.linspace(0, 10, 100)
y = np.sin(x)

# Plot data
line, = ax.plot(x, y)

# Create radio buttons in a visible area
rax = plt.axes([0.05, 0.4, 0.15, 0.15])  # Adjust position as needed
radio = RadioButtons(rax, ('Option 1', 'Option 2'))

def update(label):
    pass  # Placeholder function

radio.on_clicked(update)

plt.title('How2matplotlib.com - Visible Radio Buttons')
plt.show()
Output:
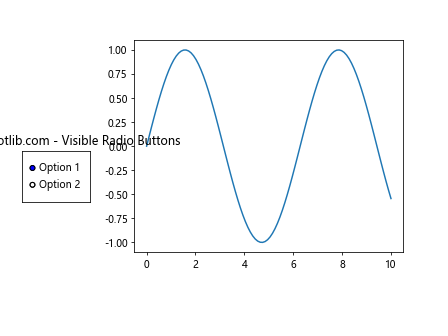
This example ensures that the radio buttons are visible and properly positioned.
Advanced Applications of Matplotlib Radio Buttons
Matplotlib Radio Buttons can be used in more complex scenarios to create highly interactive and informative visualizations. Let’s explore some advanced applications:
Multiple Sets of Radio Buttons
You can use multiple sets of radio buttons to control different aspects of your visualization:
import matplotlib.pyplot as plt
from matplotlib.widgets import RadioButtons
import numpy as np

fig, ax = plt.subplots(figsize=(10, 6))
plt.subplots_adjust(left=0.3, bottom=0.25)

# Generate data
x = np.linspace(0, 10, 100)
y_sin = np.sin(x)
y_cos = np.cos(x)

# Plot initial data
line, = ax.plot(x, y_sin, 'r-')

# Create first set of radio buttons for function selection
rax1 = plt.axes([0.05, 0.7, 0.15, 0.15])
radio1 = RadioButtons(rax1, ('Sine', 'Cosine'))

# Create second set of radio buttons for color selection
rax2 = plt.axes([0.05, 0.4, 0.15, 0.15])
radio2 = RadioButtons(rax2, ('Red', 'Blue', 'Green'))

# Define update functions
def update_function(label):
    if label == 'Sine':
        line.set_ydata(y_sin)
    elif label == 'Cosine':
        line.set_ydata(y_cos)
    ax.relim()
    ax.autoscale_view()
    fig.canvas.draw_idle()

def update_color(label):
    line.set_color(label.lower())
    fig.canvas.draw_idle()

radio1.on_clicked(update_function)
radio2.on_clicked(update_color)

plt.title('How2matplotlib.com - Multiple Radio Button Sets')
plt.show()
Output:
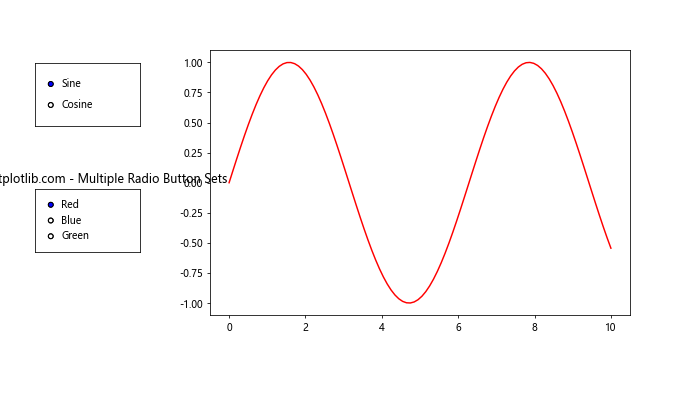
This example uses two sets of radio buttons: one to switch between sine and cosine functions, and another to change the line color.
Radio Buttons for Subplot Selection
Radio buttons can be used to switch between different subplots:
import matplotlib.pyplot as plt
from matplotlib.widgets import RadioButtons
import numpy as np

fig, (ax1, ax2, ax3) = plt.subplots(3, 1, figsize=(8, 10))
plt.subplots_adjust(left=0.3)

# Generate data
x = np.linspace(0, 10, 100)
y1 = np.sin(x)
y2 = np.cos(x)
y3 = np.tan(x)

# Plot data
line1, = ax1.plot(x, y1)
line2, = ax2.plot(x, y2)
line3, = ax3.plot(x, y3)

# Hide all subplots initially
ax1.set_visible(False)
ax2.set_visible(False)
ax3.set_visible(False)

# Create radio buttons
rax = plt.axes([0.05, 0.4, 0.15, 0.15])
radio = RadioButtons(rax, ('Sine', 'Cosine', 'Tangent'))

# Define update function
def update_subplot(label):
    if label == 'Sine':
        ax1.set_visible(True)
        ax2.set_visible(False)
        ax3.set_visible(False)
    elif label == 'Cosine':
        ax1.set_visible(False)
        ax2.set_visible(True)
        ax3.set_visible(False)
    elif label == 'Tangent':
        ax1.set_visible(False)
        ax2.set_visible(False)
        ax3.set_visible(True)
    plt.draw()

radio.on_clicked(update_subplot)

plt.suptitle('How2matplotlib.com - Subplot Selector')
plt.show()
Output:
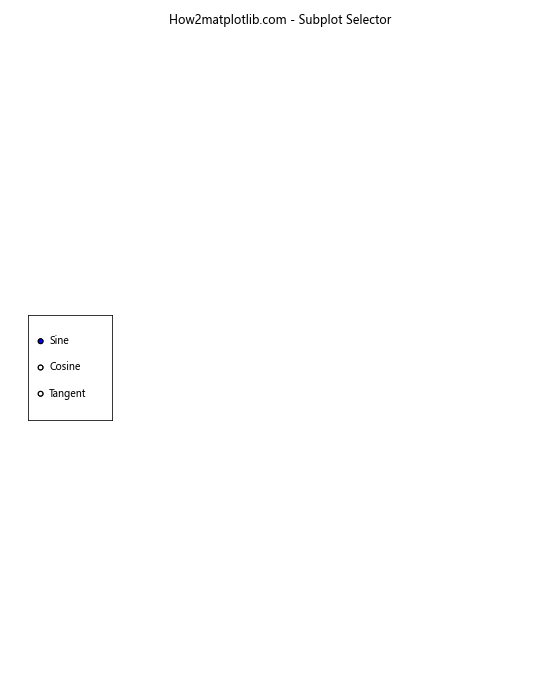
This example uses radio buttons to switch between different subplots, showing one at a time.
Integrating Matplotlib Radio Buttons with Data Analysis
Matplotlib Radio Buttons can be particularly useful when integrated with data analysis tasks. Let’s explore an example where radio buttons are used to switch between different statistical measures:
import matplotlib.pyplot as plt
from matplotlib.widgets import RadioButtons
import numpy as np

# Generate sample data
np.random.seed(42)
data1 = np.random.normal(0, 1, 1000)
data2 = np.random.normal(2, 1.5, 1000)

fig, ax = plt.subplots(figsize=(10, 6))
plt.subplots_adjust(left=0.3)

# Plot initial histogram
n, bins, patches = ax.hist(data1, bins=30, alpha=0.7)

# Create radio buttons
rax = plt.axes([0.05, 0.7, 0.15, 0.15])
radio = RadioButtons(rax, ('Dataset 1', 'Dataset 2'))

# Create radio buttons for statistics
rax2 = plt.axes([0.05, 0.4, 0.15, 0.15])
radio2 = RadioButtons(rax2, ('Mean', 'Median', 'Std Dev'))

# Initialize statistics display
stats_text = ax.text(0.7, 0.95, '', transform=ax.transAxes, verticalalignment='top')

# Define update functions
def update_dataset(label):
    if label == 'Dataset 1':
        n, bins, patches = ax.hist(data1, bins=30, alpha=0.7)
    elif label == 'Dataset 2':
        n, bins, patches = ax.hist(data2, bins=30, alpha=0.7)
    ax.relim()
    ax.autoscale_view()
    update_stats(radio2.value_selected)
    fig.canvas.draw_idle()

def update_stats(label):
    current_data = data1 if radio.value_selected == 'Dataset 1' else data2
    if label == 'Mean':
        value = np.mean(current_data)
        stats_text.set_text(f'Mean: {value:.2f}')
    elif label == 'Median':
        value = np.median(current_data)
        stats_text.set_text(f'Median: {value:.2f}')
    elif label == 'Std Dev':
        value = np.std(current_data)
        stats_text.set_text(f'Std Dev: {value:.2f}')
    fig.canvas.draw_idle()

radio.on_clicked(update_dataset)
radio2.on_clicked(update_stats)

plt.title('How2matplotlib.com - Data Analysis with Radio Buttons')
plt.show()
Output:
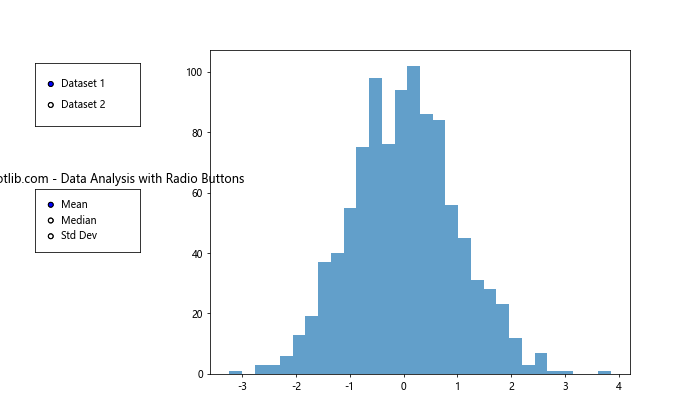
This example demonstrates how radio buttons can be used to switch between different datasets and display various statistical measures, integrating data visualization with basic statistical analysis.
Performance Considerations for Matplotlib Radio Buttons
When working with large datasets or complex visualizations, performance can become an issue. Here are some tips to optimize the performance of your Matplotlib Radio Buttons:
- Minimize Redrawing: Only redraw the necessary parts of the plot.
- Use
blitting: For animations or frequent updates, use blitting to improve performance. - Optimize Data Handling: Pre-compute data if possible, rather than recalculating on each update.
Here’s an example that implements some of these optimizations:
import matplotlib.pyplot as plt
from matplotlib.widgets import RadioButtons
import numpy as np

fig, ax = plt.subplots()
plt.subplots_adjust(left=0.3)

# Generate data
x = np.linspace(0, 10, 1000)
y1 = np.sin(x)
y2 = np.cos(x)

# Plot initial data
line, = ax.plot(x, y1)

# Create radio buttons
rax = plt.axes([0.05, 0.7, 0.15, 0.15])
radio = RadioButtons(rax, ('Sine', 'Cosine'))

# Pre-compute the artist for blitting
background = fig.canvas.copy_from_bbox(ax.bbox)

# Define optimized update function
def update_plot(label):
    if label == 'Sine':
        line.set_ydata(y1)
    elif label == 'Cosine':
        line.set_ydata(y2)

    # Restore the background
    fig.canvas.restore_region(background)

    # Redraw only the updated artist
    ax.draw_artist(line)

    # Blit the redrawn area
    fig.canvas.blit(ax.bbox)

radio.on_clicked(update_plot)

plt.title('How2matplotlib.com - Optimized Radio Buttons')
plt.show()
Output:
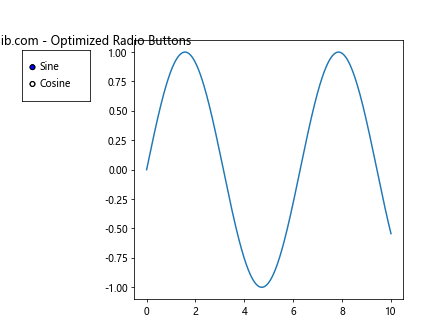
This example uses blitting to optimize the performance of the radio button updates, which can be particularly useful for larger datasets or more complex visualizations.
Conclusion
Matplotlib Radio Buttons are a powerful tool for creating interactive data visualizations in Python. Throughout this comprehensive guide, we’ve explored various aspects of Matplotlib Radio Buttons, from basic usage to advanced applications and performance optimizations.
We’ve covered:
- Creating and customizing radio buttons
- Using radio buttons for data visualization
- Combining radio buttons with other widgets
- Best practices for using radio buttons
- Troubleshooting common issues
- Advanced applications in data analysis
- Performance considerations