Comprehensive Guide to Matplotlib.axis.Axis.get_figure() Function in Python
Matplotlib.axis.Axis.get_figure() function in Python is an essential method for retrieving the Figure object associated with an Axis instance. This function plays a crucial role in manipulating and customizing plots created using Matplotlib. In this comprehensive guide, we’ll explore the Matplotlib.axis.Axis.get_figure() function in depth, covering its usage, applications, and providing numerous examples to illustrate its functionality.
Understanding the Matplotlib.axis.Axis.get_figure() Function
The Matplotlib.axis.Axis.get_figure() function is a method of the Axis class in Matplotlib. Its primary purpose is to return the Figure object to which the Axis instance belongs. This function is particularly useful when you need to access or modify properties of the entire figure from within the context of an individual axis.
Let’s start with a simple example to demonstrate how to use the Matplotlib.axis.Axis.get_figure() function:
import matplotlib.pyplot as plt

# Create a figure and axis
fig, ax = plt.subplots()

# Plot some data
ax.plot([1, 2, 3, 4], [1, 4, 2, 3], label='Data from how2matplotlib.com')

# Get the figure object using get_figure()
figure = ax.get_figure()

# Customize the figure title
figure.suptitle('Plot created using how2matplotlib.com')

plt.show()
Output:
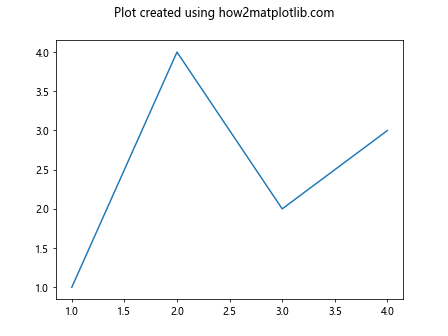
In this example, we create a figure and axis using plt.subplots(). After plotting some data, we use the get_figure() method to retrieve the Figure object associated with the axis. We then use this Figure object to set a title for the entire figure using suptitle().
Exploring the Functionality of Matplotlib.axis.Axis.get_figure()
The Matplotlib.axis.Axis.get_figure() function is straightforward in its operation. It doesn’t take any arguments and always returns the Figure object associated with the Axis instance. This simplicity makes it easy to use in various scenarios where you need to access figure-level properties or methods.
Here’s another example that demonstrates how to use Matplotlib.axis.Axis.get_figure() to adjust figure-wide properties:
import matplotlib.pyplot as plt

# Create a figure with two subplots
fig, (ax1, ax2) = plt.subplots(1, 2, figsize=(10, 5))

# Plot data on both axes
ax1.plot([1, 2, 3, 4], [1, 4, 2, 3], label='Data 1 from how2matplotlib.com')
ax2.plot([1, 2, 3, 4], [3, 1, 4, 2], label='Data 2 from how2matplotlib.com')

# Get the figure object using get_figure() from either axis
figure = ax1.get_figure()

# Adjust the spacing between subplots
figure.tight_layout()

# Add a overall title to the figure
figure.suptitle('Multiple plots using how2matplotlib.com', fontsize=16)

plt.show()
Output:
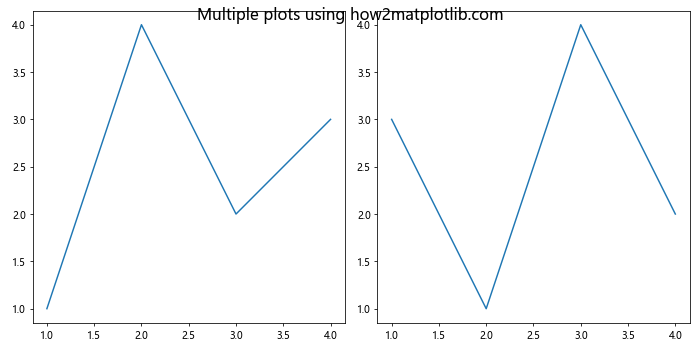
In this example, we create a figure with two subplots. We then use the get_figure() method on one of the axes to retrieve the Figure object. This allows us to adjust the layout of the entire figure and add an overall title.
Practical Applications of Matplotlib.axis.Axis.get_figure()
The Matplotlib.axis.Axis.get_figure() function has numerous practical applications in data visualization and plot customization. Let’s explore some of these applications with examples.
1. Adjusting Figure Size
One common use of Matplotlib.axis.Axis.get_figure() is to adjust the size of the figure after it has been created:
import matplotlib.pyplot as plt

# Create a figure and axis
fig, ax = plt.subplots()

# Plot some data
ax.plot([1, 2, 3, 4], [1, 4, 2, 3], label='Data from how2matplotlib.com')

# Get the figure object
figure = ax.get_figure()

# Adjust the figure size
figure.set_size_inches(10, 6)

plt.show()
Output:
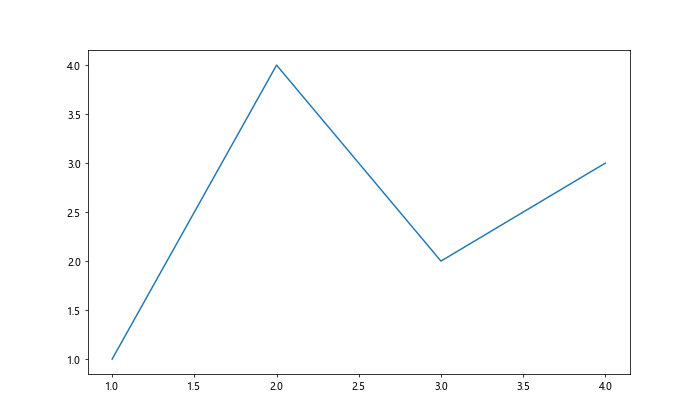
In this example, we use get_figure() to access the Figure object and then use set_size_inches() to change the size of the figure.
2. Adding Colorbars
When working with color-mapped plots, you might want to add a colorbar to the figure. The Matplotlib.axis.Axis.get_figure() function can be useful in this scenario:
import matplotlib.pyplot as plt
import numpy as np

# Create data for a color-mapped plot
x = np.linspace(0, 10, 100)
y = np.linspace(0, 10, 100)
X, Y = np.meshgrid(x, y)
Z = np.sin(X) * np.cos(Y)

# Create a figure and axis
fig, ax = plt.subplots()

# Create a color-mapped plot
im = ax.imshow(Z, cmap='viridis', extent=[0, 10, 0, 10])

# Get the figure object
figure = ax.get_figure()

# Add a colorbar to the figure
cbar = figure.colorbar(im)
cbar.set_label('Values from how2matplotlib.com')

plt.show()
Output:
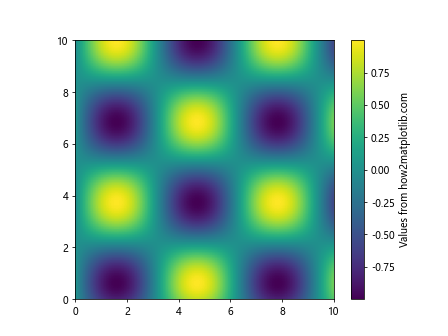
In this example, we create a color-mapped plot using imshow(). We then use get_figure() to access the Figure object and add a colorbar to it.
3. Saving Figures
The Matplotlib.axis.Axis.get_figure() function can be useful when you want to save a figure programmatically:
import matplotlib.pyplot as plt

# Create a figure and axis
fig, ax = plt.subplots()

# Plot some data
ax.plot([1, 2, 3, 4], [1, 4, 2, 3], label='Data from how2matplotlib.com')

# Get the figure object
figure = ax.get_figure()

# Save the figure
figure.savefig('how2matplotlib_plot.png', dpi=300, bbox_inches='tight')

plt.show()
Output:
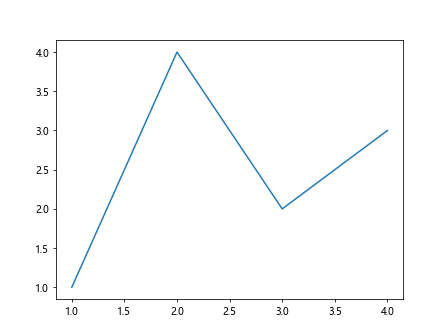
In this example, we use get_figure() to access the Figure object and then use its savefig() method to save the plot as an image file.
4. Adding Text to Figures
The Matplotlib.axis.Axis.get_figure() function can be used to add text to specific locations on the figure:
import matplotlib.pyplot as plt

# Create a figure and axis
fig, ax = plt.subplots()

# Plot some data
ax.plot([1, 2, 3, 4], [1, 4, 2, 3], label='Data from how2matplotlib.com')

# Get the figure object
figure = ax.get_figure()

# Add text to the figure
figure.text(0.5, 0.02, 'X-axis label from how2matplotlib.com', ha='center')
figure.text(0.02, 0.5, 'Y-axis label from how2matplotlib.com', va='center', rotation='vertical')

plt.show()
Output:
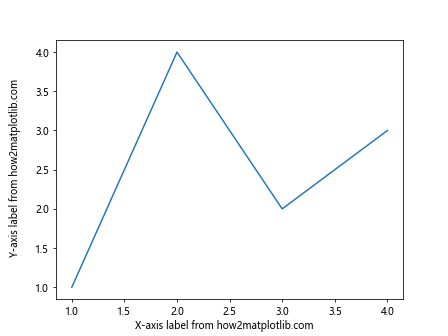
In this example, we use get_figure() to access the Figure object and then use its text() method to add custom labels to the x and y axes.
5. Creating Subplots with Shared Axes
The Matplotlib.axis.Axis.get_figure() function can be helpful when creating subplots with shared axes:
import matplotlib.pyplot as plt
import numpy as np

# Create data
x = np.linspace(0, 10, 100)
y1 = np.sin(x)
y2 = np.cos(x)

# Create a figure with two subplots sharing the x-axis
fig, (ax1, ax2) = plt.subplots(2, 1, sharex=True)

# Plot data on both axes
ax1.plot(x, y1, label='Sin from how2matplotlib.com')
ax2.plot(x, y2, label='Cos from how2matplotlib.com')

# Get the figure object
figure = ax1.get_figure()

# Adjust the spacing between subplots
figure.tight_layout()

# Add a overall title to the figure
figure.suptitle('Trigonometric functions from how2matplotlib.com', fontsize=16)

plt.show()
Output:
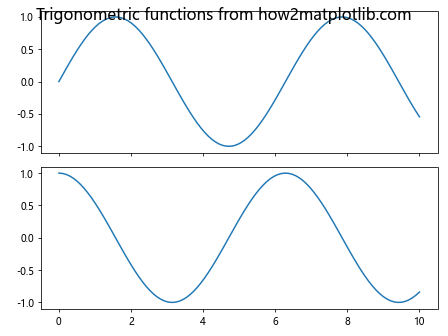
In this example, we create two subplots with a shared x-axis. We use get_figure() to access the Figure object and adjust the layout and add a title to the entire figure.
Advanced Usage of Matplotlib.axis.Axis.get_figure()
While the Matplotlib.axis.Axis.get_figure() function is simple in its operation, it can be used in more advanced scenarios to create complex visualizations. Let’s explore some of these advanced uses.
1. Creating Inset Axes
The Matplotlib.axis.Axis.get_figure() function can be used in conjunction with inset_axes() to create inset plots:
import matplotlib.pyplot as plt
from mpl_toolkits.axes_grid1.inset_locator import inset_axes

# Create a figure and axis
fig, ax = plt.subplots()

# Plot some data
ax.plot([1, 2, 3, 4], [1, 4, 2, 3], label='Main data from how2matplotlib.com')

# Get the figure object
figure = ax.get_figure()

# Create an inset axes
axins = inset_axes(ax, width="40%", height="30%", loc=2)
axins.plot([1, 2, 3, 4], [2, 1, 3, 4], label='Inset data from how2matplotlib.com')

# Add a title to the figure
figure.suptitle('Main plot with inset from how2matplotlib.com', fontsize=16)

plt.show()
Output:
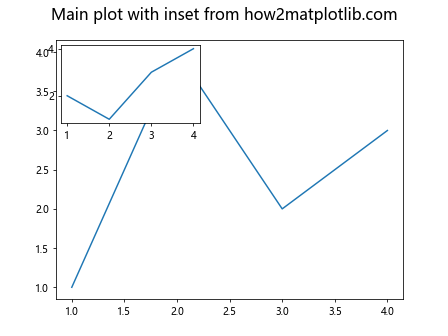
In this example, we use get_figure() to access the Figure object and add a title to the entire figure, which includes both the main plot and the inset plot.
2. Creating Custom Layouts
The Matplotlib.axis.Axis.get_figure() function can be used with GridSpec to create custom layouts:
import matplotlib.pyplot as plt
from matplotlib.gridspec import GridSpec

# Create a figure
fig = plt.figure(figsize=(12, 8))

# Create a custom grid
gs = GridSpec(3, 3, figure=fig)

# Create subplots using the grid
ax1 = fig.add_subplot(gs[0, :])
ax2 = fig.add_subplot(gs[1, :-1])
ax3 = fig.add_subplot(gs[1:, -1])
ax4 = fig.add_subplot(gs[-1, 0])
ax5 = fig.add_subplot(gs[-1, -2])

# Plot some data
ax1.plot([1, 2, 3, 4], [1, 4, 2, 3], label='Data 1 from how2matplotlib.com')
ax2.plot([1, 2, 3, 4], [3, 1, 4, 2], label='Data 2 from how2matplotlib.com')
ax3.plot([1, 2, 3, 4], [2, 3, 1, 4], label='Data 3 from how2matplotlib.com')
ax4.plot([1, 2, 3, 4], [4, 2, 3, 1], label='Data 4 from how2matplotlib.com')
ax5.plot([1, 2, 3, 4], [1, 3, 2, 4], label='Data 5 from how2matplotlib.com')

# Get the figure object from any of the axes
figure = ax1.get_figure()

# Add a title to the figure
figure.suptitle('Custom layout using GridSpec from how2matplotlib.com', fontsize=16)

plt.tight_layout()
plt.show()
Output:
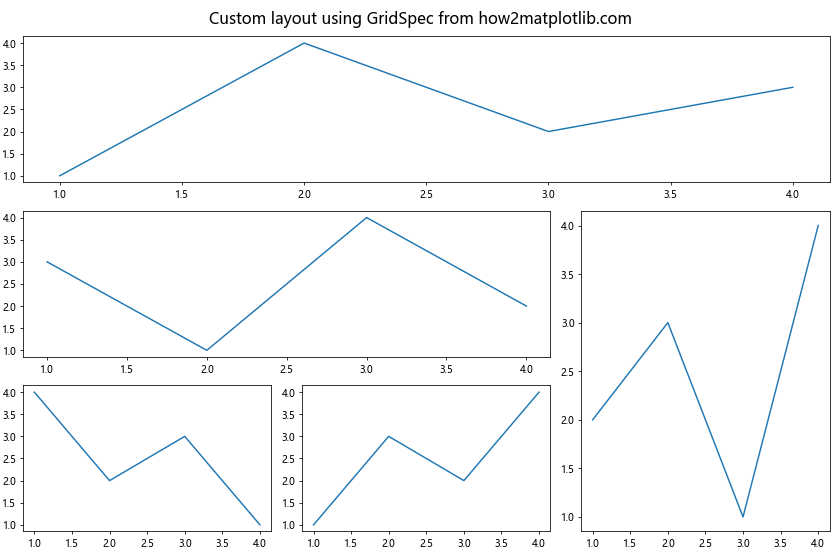
In this example, we create a custom layout using GridSpec. We then use get_figure() to access the Figure object and add a title to the entire figure.
3. Adding Annotations to Multiple Subplots
The Matplotlib.axis.Axis.get_figure() function can be useful when adding annotations to multiple subplots:
import matplotlib.pyplot as plt
import numpy as np

# Create data
x = np.linspace(0, 10, 100)
y1 = np.sin(x)
y2 = np.cos(x)

# Create a figure with two subplots
fig, (ax1, ax2) = plt.subplots(1, 2, figsize=(12, 5))

# Plot data on both axes
ax1.plot(x, y1, label='Sin from how2matplotlib.com')
ax2.plot(x, y2, label='Cos from how2matplotlib.com')

# Get the figure object
figure = ax1.get_figure()

# Add annotations to both subplots
for ax in figure.axes:
    ax.annotate('Peak', xy=(np.pi/2, 1), xytext=(np.pi/2, 0.5),
                arrowprops=dict(facecolor='black', shrink=0.05))

# Add a overall title to the figure
figure.suptitle('Trigonometric functions with annotations from how2matplotlib.com', fontsize=16)

plt.tight_layout()
plt.show()
Output:
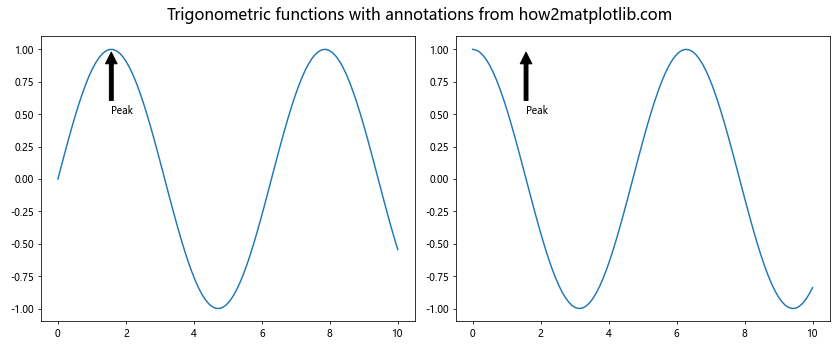
In this example, we create two subplots and use get_figure() to access the Figure object. We then iterate over all axes in the figure to add annotations to each subplot.
4. Creating Animated Plots
The Matplotlib.axis.Axis.get_figure() function can be used in creating animated plots:
import matplotlib.pyplot as plt
import numpy as np
from matplotlib.animation import FuncAnimation

# Create a figure and axis
fig, ax = plt.subplots()

# Initialize an empty line
line, = ax.plot([], [], lw=2)

# Set the plot limits
ax.set_xlim(0, 2*np.pi)
ax.set_ylim(-1, 1)

# Define the animation function
def animate(i):
    x = np.linspace(0, 2*np.pi, 100)
    y = np.sin(x + i/10)
    line.set_data(x, y)
    return line,

# Get the figure object
figure = ax.get_figure()

# Create the animation
anim = FuncAnimation(figure, animate, frames=200, interval=20, blit=True)

# Add a title to the figure
figure.suptitle('Animated sine wave from how2matplotlib.com', fontsize=16)

plt.show()
Output:
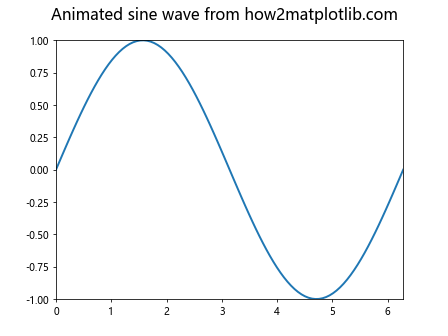
In this example, we create an animated plot of a sine wave. We use get_figure() to access the Figure object, which is then used to create the animation and add a title to the figure.
5. Creating Subplots with Different Scales
The Matplotlib.axis.Axis.get_figure() function can be helpful when creating subplots with different scales:
import matplotlib.pyplot as plt
import numpy as np

# Create data
x = np.linspace(0, 10, 100)
y1 = np.exp(x)
y2 = np.log(x)

# Create a figure with two subplots
fig, (ax1, ax2) = plt.subplots(1, 2, figsize=(12, 5))

# Plot data on both axes
ax1.plot(x, y1, label='Exponential from how2matplotlib.com')
ax2.plot(x, y2, label='Logarithmic from how2matplotlib.com')

# Set different scales for the y-axes
ax1.set_yscale('log')
ax2.set_yscale('linear')

# Get the figure object
figure = ax1.get_figure()

# Add a overall title to the figure
figure.suptitle('Functions with different scales from how2matplotlib.com', fontsize=16)

# Add legends
ax1.legend()
ax2.legend()

plt.tight_layout()
plt.show()
Output:
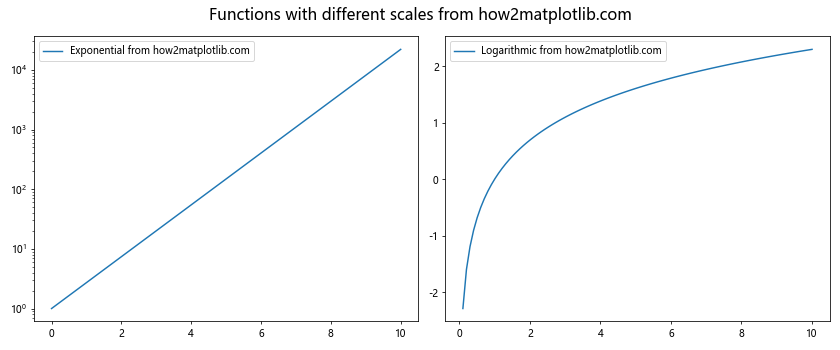
In this example,we create two subplots with different y-axis scales. We use get_figure() to access the Figure object and add a title to the entire figure.
Best Practices for Using Matplotlib.axis.Axis.get_figure()
When working with the Matplotlib.axis.Axis.get_figure() function, there are several best practices to keep in mind:
- Use
get_figure()sparingly: While it’s a useful function, overusing it can lead to cluttered and hard-to-read code. Only use it when you need to access figure-level properties or methods. Combine with other Matplotlib functions: The Matplotlib.axis.Axis.get_figure() function is most powerful when used in combination with other Matplotlib functions and methods.
Be aware of the context: Remember that
get_figure()returns the Figure object, which represents the entire figure. Make sure you’re operating on the correct level (figure vs. axis) when making changes.Use for consistent styling: The Matplotlib.axis.Axis.get_figure() function can be particularly useful for applying consistent styling across multiple subplots.
Consider alternative approaches: In some cases, there might be more direct ways to achieve what you’re trying to do without using
get_figure(). Always consider if there’s a more straightforward approach.
Common Pitfalls and How to Avoid Them
While using the Matplotlib.axis.Axis.get_figure() function, there are some common pitfalls that you should be aware of: