Comprehensive Guide to Matplotlib.axis.Axis.get_gid() Function in Python

Comprehensive Guide to Matplotlib.axis.Axis.get_gid() Function in Python

Matplotlib.axis.Axis.get_gid() function in Python is an essential method for retrieving the group id of an Axis object in Matplotlib. This function plays a crucial role in managing and identifying specific elements within a plot. In this comprehensive guide, we’ll explore the Matplotlib.axis.Axis.get_gid() function in depth, covering its usage, applications, and providing numerous examples to illustrate its functionality.

Understanding the Matplotlib.axis.Axis.get_gid() Function

The Matplotlib.axis.Axis.get_gid() function is a method associated with the Axis class in Matplotlib. Its primary purpose is to retrieve the group id (gid) of an Axis object. The group id is a string that can be used to identify and group related elements in a plot. This function is particularly useful when working with complex plots that contain multiple axes or when you need to manipulate specific axes programmatically.

Let’s start with a simple example to demonstrate how to use the Matplotlib.axis.Axis.get_gid() function:

import matplotlib.pyplot as plt

# Create a figure and axis
fig, ax = plt.subplots()

# Set a group id for the axis
ax.set_gid("how2matplotlib.com_axis1")

# Retrieve the group id using get_gid()
gid = ax.get_gid()

print(f"The group id of the axis is: {gid}")

plt.show()

Output:
Comprehensive Guide to Matplotlib.axis.Axis.get_gid() Function in Python

In this example, we create a figure and an axis, set a group id for the axis using the set_gid() method, and then retrieve it using the get_gid() function. The group id is then printed to the console.

Practical Applications of Matplotlib.axis.Axis.get_gid()

The Matplotlib.axis.Axis.get_gid() function has several practical applications in data visualization and plot management. Let’s explore some of these applications:

1. Identifying Specific Axes in Multi-Axis Plots

When working with plots that contain multiple axes, the Matplotlib.axis.Axis.get_gid() function can be used to identify and manipulate specific axes. Here’s an example:

import matplotlib.pyplot as plt

# Create a figure with multiple subplots
fig, (ax1, ax2) = plt.subplots(2, 1, figsize=(8, 6))

# Set group ids for each axis
ax1.set_gid("how2matplotlib.com_top_axis")
ax2.set_gid("how2matplotlib.com_bottom_axis")

# Plot some data
ax1.plot([1, 2, 3, 4], [1, 4, 2, 3])
ax2.plot([1, 2, 3, 4], [4, 3, 2, 1])

# Retrieve and print the group ids
print(f"Top axis group id: {ax1.get_gid()}")
print(f"Bottom axis group id: {ax2.get_gid()}")

plt.tight_layout()
plt.show()

Output:
Comprehensive Guide to Matplotlib.axis.Axis.get_gid() Function in Python

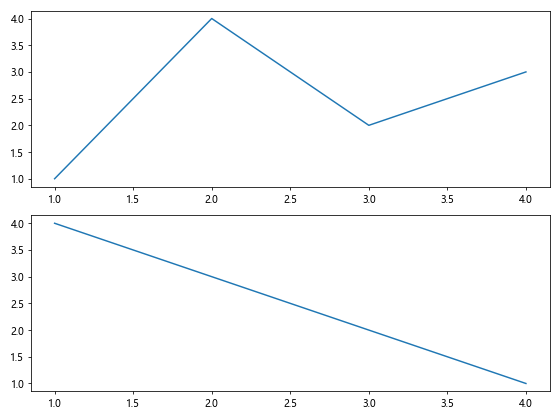
In this example, we create a figure with two subplots, set different group ids for each axis, and then retrieve and print these ids using the Matplotlib.axis.Axis.get_gid() function.

2. Customizing Axis Properties Based on Group ID

The Matplotlib.axis.Axis.get_gid() function can be used in conjunction with conditional statements to apply custom properties to specific axes. Here’s an example:

import matplotlib.pyplot as plt

# Create a figure with multiple subplots
fig, (ax1, ax2, ax3) = plt.subplots(3, 1, figsize=(8, 8))

# Set group ids for each axis
ax1.set_gid("how2matplotlib.com_red_axis")
ax2.set_gid("how2matplotlib.com_green_axis")
ax3.set_gid("how2matplotlib.com_blue_axis")

# Function to customize axis based on group id
def customize_axis(ax):
    gid = ax.get_gid()
    if gid == "how2matplotlib.com_red_axis":
        ax.set_facecolor("#ffcccc")
    elif gid == "how2matplotlib.com_green_axis":
        ax.set_facecolor("#ccffcc")
    elif gid == "how2matplotlib.com_blue_axis":
        ax.set_facecolor("#ccccff")

# Apply customization to each axis
for ax in (ax1, ax2, ax3):
    customize_axis(ax)
    ax.plot([1, 2, 3, 4], [1, 4, 2, 3])

plt.tight_layout()
plt.show()

Output:
Comprehensive Guide to Matplotlib.axis.Axis.get_gid() Function in Python

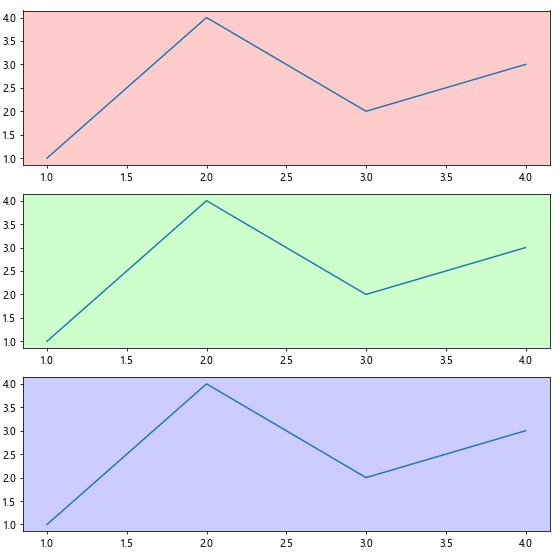
In this example, we create three subplots and assign different group ids to each. We then define a function that uses the Matplotlib.axis.Axis.get_gid() function to retrieve the group id and apply custom background colors based on the id.

Advanced Usage of Matplotlib.axis.Axis.get_gid()

The Matplotlib.axis.Axis.get_gid() function can be used in more advanced scenarios to enhance plot management and interactivity. Let’s explore some of these advanced use cases:

1. Dynamic Axis Manipulation

The Matplotlib.axis.Axis.get_gid() function can be used to dynamically manipulate axes based on user input or other conditions. Here’s an example:

import matplotlib.pyplot as plt

# Create a figure with multiple subplots
fig, (ax1, ax2) = plt.subplots(2, 1, figsize=(8, 6))

# Set group ids for each axis
ax1.set_gid("how2matplotlib.com_axis1")
ax2.set_gid("how2matplotlib.com_axis2")

# Plot some data
ax1.plot([1, 2, 3, 4], [1, 4, 2, 3])
ax2.plot([1, 2, 3, 4], [4, 3, 2, 1])

# Function to toggle axis visibility
def toggle_axis_visibility(event):
    if event.key == '1':
        ax = fig.get_axes()[0]
        ax.set_visible(not ax.get_visible())
    elif event.key == '2':
        ax = fig.get_axes()[1]
        ax.set_visible(not ax.get_visible())
    plt.draw()

# Connect the key press event to the function
fig.canvas.mpl_connect('key_press_event', toggle_axis_visibility)

plt.tight_layout()
plt.show()

Output:
Comprehensive Guide to Matplotlib.axis.Axis.get_gid() Function in Python

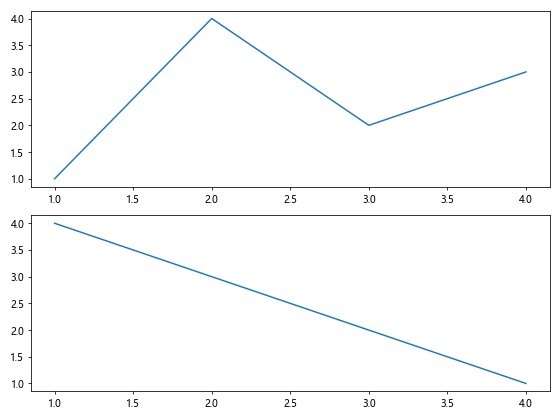
In this example, we create two subplots and assign group ids to each. We then define a function that toggles the visibility of each axis based on user input. The Matplotlib.axis.Axis.get_gid() function could be used within this function to identify which axis to manipulate.

2. Axis Grouping and Batch Operations

The Matplotlib.axis.Axis.get_gid() function can be used to group axes and perform batch operations on them. Here’s an example:

import matplotlib.pyplot as plt

# Create a figure with multiple subplots
fig, axes = plt.subplots(2, 2, figsize=(10, 8))

# Flatten the axes array for easier iteration
axes = axes.flatten()

# Set group ids for each axis
for i, ax in enumerate(axes):
    ax.set_gid(f"how2matplotlib.com_axis{i+1}")

# Plot some data
for ax in axes:
    ax.plot([1, 2, 3, 4], [1, 4, 2, 3])

# Function to apply a common operation to a group of axes
def apply_to_group(axes, group_prefix, operation):
    for ax in axes:
        if ax.get_gid().startswith(group_prefix):
            operation(ax)

# Example operation: change y-axis limits
def change_ylim(ax):
    ax.set_ylim(0, 5)

# Apply the operation to axes with group ids starting with "how2matplotlib.com_axis"
apply_to_group(axes, "how2matplotlib.com_axis", change_ylim)

plt.tight_layout()
plt.show()

Output:
Comprehensive Guide to Matplotlib.axis.Axis.get_gid() Function in Python

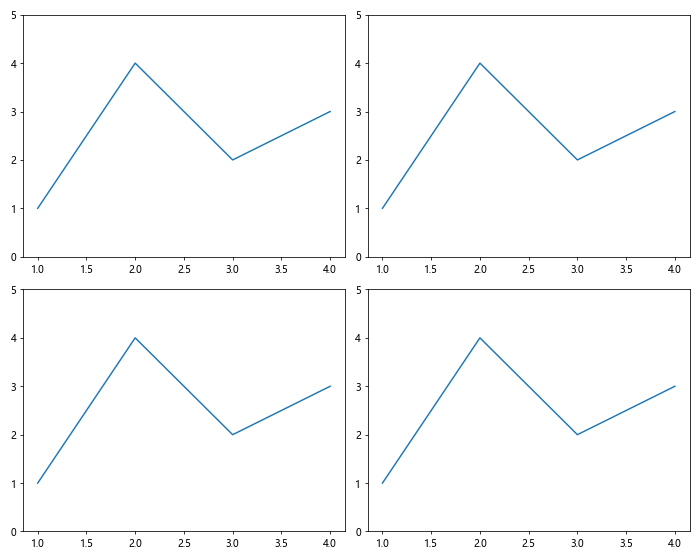
In this example, we create a 2×2 grid of subplots and assign unique group ids to each. We then define a function that applies a common operation to axes based on their group id prefix. The Matplotlib.axis.Axis.get_gid() function is used to retrieve the group id and determine which axes to operate on.

Best Practices for Using Matplotlib.axis.Axis.get_gid()

When working with the Matplotlib.axis.Axis.get_gid() function, it’s important to follow some best practices to ensure efficient and maintainable code:

  1. Use descriptive group ids: Choose group ids that clearly describe the purpose or content of the axis. This makes it easier to understand and maintain your code.

  2. Be consistent with naming conventions: Establish a consistent naming convention for your group ids across your project.

  3. Document your group ids: Maintain a list or documentation of the group ids used in your project and their purposes.

  4. Use group ids sparingly: Only use group ids when necessary for specific identification or grouping purposes. Overuse can lead to cluttered and hard-to-maintain code.

  5. Combine with other Matplotlib functions: Use the Matplotlib.axis.Axis.get_gid() function in combination with other Matplotlib functions to create more powerful and flexible visualizations.

Let’s look at an example that demonstrates these best practices:

import matplotlib.pyplot as plt

# Create a figure with multiple subplots
fig, (ax1, ax2, ax3) = plt.subplots(3, 1, figsize=(8, 10))

# Set descriptive group ids
ax1.set_gid("how2matplotlib.com_temperature")
ax2.set_gid("how2matplotlib.com_humidity")
ax3.set_gid("how2matplotlib.com_pressure")

# Plot some data
ax1.plot([1, 2, 3, 4], [20, 22, 21, 23], label="Temperature (°C)")
ax2.plot([1, 2, 3, 4], [50, 55, 52, 48], label="Humidity (%)")
ax3.plot([1, 2, 3, 4], [1013, 1015, 1014, 1012], label="Pressure (hPa)")

# Function to customize axis based on group id
def customize_axis(ax):
    gid = ax.get_gid()
    if gid == "how2matplotlib.com_temperature":
        ax.set_ylabel("Temperature (°C)")
        ax.set_ylim(0, 30)
    elif gid == "how2matplotlib.com_humidity":
        ax.set_ylabel("Humidity (%)")
        ax.set_ylim(0, 100)
    elif gid == "how2matplotlib.com_pressure":
        ax.set_ylabel("Pressure (hPa)")
        ax.set_ylim(1000, 1020)
    ax.legend()
    ax.grid(True)

# Apply customization to each axis
for ax in (ax1, ax2, ax3):
    customize_axis(ax)

plt.tight_layout()
plt.show()

Output:

Comprehensive Guide to Matplotlib.axis.Axis.get_gid() Function in Python

In this example, we use descriptive group ids for each axis, representing different weather parameters. We then use a function that customizes each axis based on its group id, demonstrating how the Matplotlib.axis.Axis.get_gid() function can be used effectively in combination with other Matplotlib functions.

Common Pitfalls and How to Avoid Them

When working with the Matplotlib.axis.Axis.get_gid() function, there are some common pitfalls that you should be aware of:

  1. Forgetting to set the group id: If you try to retrieve a group id that hasn’t been set, you’ll get None. Always make sure to set the group id before trying to retrieve it.

  2. Case sensitivity: Group ids are case-sensitive. Make sure you’re consistent with your capitalization when setting and retrieving group ids.

  3. Overwriting group ids: Be careful not to accidentally overwrite group ids, especially when working with multiple axes.

  4. Using non-string group ids: Group ids should always be strings. Using other data types may lead to unexpected behavior.

Let’s look at an example that demonstrates how to avoid these pitfalls:

import matplotlib.pyplot as plt

# Create a figure with multiple subplots
fig, (ax1, ax2) = plt.subplots(2, 1, figsize=(8, 6))

# Set group ids correctly
ax1.set_gid("how2matplotlib.com_upper")
ax2.set_gid("how2matplotlib.com_lower")

# Retrieve group ids safely
upper_gid = ax1.get_gid() or "Default"
lower_gid = ax2.get_gid() or "Default"

print(f"Upper axis group id: {upper_gid}")
print(f"Lower axis group id: {lower_gid}")

# Demonstrate case sensitivity
ax1.set_gid("How2matplotlib.com_Upper")
print(f"Updated upper axis group id: {ax1.get_gid()}")

# Avoid overwriting
if ax2.get_gid() != "how2matplotlib.com_new_lower":
    ax2.set_gid("how2matplotlib.com_new_lower")

print(f"Updated lower axis group id: {ax2.get_gid()}")

# Use string group ids
# ax1.set_gid(123)  # This would be incorrect
ax1.set_gid("123")  # This is correct

plt.tight_layout()
plt.show()

Output:

Comprehensive Guide to Matplotlib.axis.Axis.get_gid() Function in Python

In this example, we demonstrate how to set and retrieve group ids safely, show the case sensitivity of group ids, avoid overwriting existing group ids, and use string group ids correctly.

Integrating Matplotlib.axis.Axis.get_gid() with Other Matplotlib Features

The Matplotlib.axis.Axis.get_gid() function can be integrated with other Matplotlib features to create more complex and interactive visualizations. Let’s explore some examples:

1. Combining with Event Handling

You can use the Matplotlib.axis.Axis.get_gid() function in combination with Matplotlib’s event handling to create interactive plots. Here’s an example:

import matplotlib.pyplot as plt

# Create a figure with multiple subplots
fig, (ax1, ax2) = plt.subplots(2, 1, figsize=(8, 6))

# Set group ids for each axis
ax1.set_gid("how2matplotlib.com_upper")
ax2.set_gid("how2matplotlib.com_lower")

# Plot some data
ax1.plot([1, 2, 3, 4], [1, 4, 2, 3])
ax2.plot([1, 2, 3, 4], [4, 3, 2, 1])

# Function to handle mouse click events
def on_click(event):
    if event.inaxes is not None:
        gid = event.inaxes.get_gid()
        print(f"Clicked on axis with group id: {gid}")

# Connect the mouse click event to the function
fig.canvas.mpl_connect('button_press_event', on_click)

plt.tight_layout()
plt.show()

Output:

Comprehensive Guide to Matplotlib.axis.Axis.get_gid() Function in Python

In this example, we create two subplots and assign group ids to each. We then define a function that prints the group id of the clicked axis using the Matplotlib.axis.Axis.get_gid() function.

2. Dynamic Legend Management

The Matplotlib.axis.Axis.get_gid() function can be used to dynamically manage legends in complex plots. Here’s an example:

import matplotlib.pyplot as plt

# Create a figure with multiple subplots
fig, (ax1, ax2) = plt.subplots(2, 1, figsize=(8, 6))

# Set group ids for each axis
ax1.set_gid("how2matplotlib.com_temperature")
ax2.set_gid("how2matplotlib.com_humidity")

# Plot some data```python
# Plot some data
ax1.plot([1, 2, 3, 4], [20, 22, 21, 23], label="City A")
ax1.plot([1, 2, 3, 4], [19, 21, 20, 22], label="City B")
ax2.plot([1, 2, 3, 4], [50, 55, 52, 48], label="City A")
ax2.plot([1, 2, 3, 4], [52, 57, 54, 50], label="City B")

# Function to update legend based on group id
def update_legend(event):
    if event.inaxes is not None:
        gid = event.inaxes.get_gid()
        if gid == "how2matplotlib.com_temperature":
            event.inaxes.legend(title="Temperature (°C)")
        elif gid == "how2matplotlib.com_humidity":
            event.inaxes.legend(title="Humidity (%)")
        plt.draw()

# Connect the mouse click event to the function
fig.canvas.mpl_connect('button_press_event', update_legend)

plt.tight_layout()
plt.show()

Output:

Comprehensive Guide to Matplotlib.axis.Axis.get_gid() Function in Python

In this example, we create two subplots for temperature and humidity data. We use the Matplotlib.axis.Axis.get_gid() function in the update_legend function to determine which axis was clicked and update the legend accordingly.

Advanced Techniques with Matplotlib.axis.Axis.get_gid()

Let’s explore some advanced techniques that leverage the Matplotlib.axis.Axis.get_gid() function:

1. Dynamic Axis Creation and Management

You can use the Matplotlib.axis.Axis.get_gid() function to manage dynamically created axes. Here’s an example:

import matplotlib.pyplot as plt

class DynamicPlotter:
    def __init__(self):
        self.fig, self.ax = plt.subplots()
        self.ax.set_gid("how2matplotlib.com_main")
        self.axes = [self.ax]
        self.fig.canvas.mpl_connect('button_press_event', self.add_subplot)

    def add_subplot(self, event):
        if event.inaxes and event.inaxes.get_gid() == "how2matplotlib.com_main":
            new_ax = self.fig.add_subplot(len(self.axes) + 1, 1, len(self.axes) + 1)
            new_ax.set_gid(f"how2matplotlib.com_sub_{len(self.axes)}")
            new_ax.plot([1, 2, 3, 4], [1, 4, 2, 3])
            self.axes.append(new_ax)
            plt.tight_layout()
            plt.draw()

plotter = DynamicPlotter()
plt.show()

In this example, we create a class that allows dynamic addition of subplots when the main plot is clicked. The Matplotlib.axis.Axis.get_gid() function is used to identify the main plot and assign unique group ids to new subplots.

2. Axis Grouping for Synchronized Zooming

The Matplotlib.axis.Axis.get_gid() function can be used to create groups of axes that zoom synchronously. Here’s an example:

import matplotlib.pyplot as plt
from matplotlib.widgets import RectangleSelector

class SyncZoomer:
    def __init__(self):
        self.fig, (self.ax1, self.ax2) = plt.subplots(2, 1, figsize=(8, 6))
        self.ax1.set_gid("how2matplotlib.com_group1")
        self.ax2.set_gid("how2matplotlib.com_group1")

        self.ax1.plot([1, 2, 3, 4], [1, 4, 2, 3])
        self.ax2.plot([1, 2, 3, 4], [4, 3, 2, 1])

        self.rs = RectangleSelector(self.ax1, self.zoom_callback, useblit=True)

    def zoom_callback(self, eclick, erelease):
        x1, y1 = eclick.xdata, eclick.ydata
        x2, y2 = erelease.xdata, erelease.ydata

        for ax in self.fig.get_axes():
            if ax.get_gid() == "how2matplotlib.com_group1":
                ax.set_xlim(min(x1, x2), max(x1, x2))
                ax.set_ylim(min(y1, y2), max(y1, y2))

        self.fig.canvas.draw_idle()

zoomer = SyncZoomer()
plt.show()

Output:

Comprehensive Guide to Matplotlib.axis.Axis.get_gid() Function in Python

In this example, we create two subplots and assign them the same group id. We then use a RectangleSelector to allow zooming on the first subplot. The zoom is applied to all axes with the same group id using the Matplotlib.axis.Axis.get_gid() function.

Conclusion

The Matplotlib.axis.Axis.get_gid() function is a powerful tool in the Matplotlib library that allows for efficient management and identification of axes in complex plots. Throughout this comprehensive guide, we’ve explored its basic usage, advanced applications, best practices, and real-world scenarios.

Key takeaways include:

  1. The Matplotlib.axis.Axis.get_gid() function retrieves the group id of an Axis object, which can be used for identification and grouping.
  2. It can be used in combination with other Matplotlib features to create dynamic and interactive visualizations.
  3. Proper use of group ids can significantly improve code readability and maintainability in complex plotting scenarios.
  4. The function is particularly useful in scenarios involving multiple axes, such as dashboards or multi-sensor data visualization.

By mastering the Matplotlib.axis.Axis.get_gid() function, you can create more organized, flexible, and powerful data visualizations in Python. Whether you’re working on simple plots or complex dashboards, this function provides a valuable tool for managing your Matplotlib axes effectively.

Like(0)